Give Claude Code the Power BI skills it needs.
Install once, then just ask Claude to work with your semantic models and reports.




Why pbi-cli •
Get Started •
Modeling •
Reporting •
Skills •
All Commands •
Contributing
---
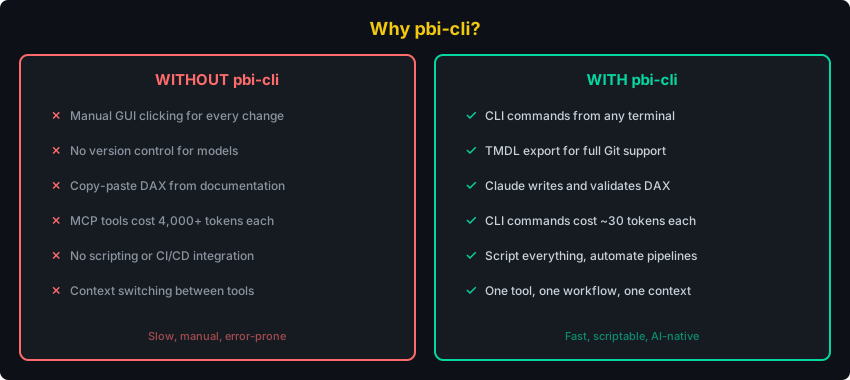
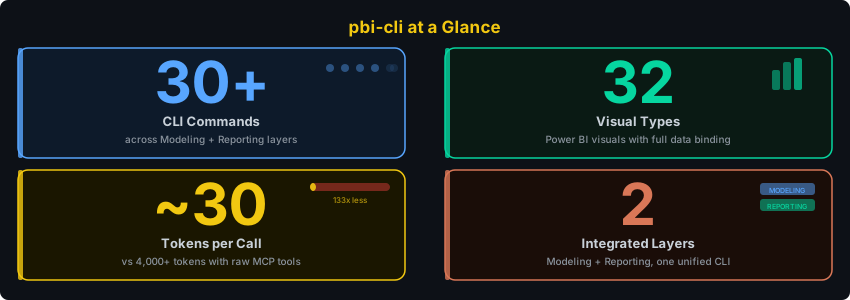
## Why pbi-cli?
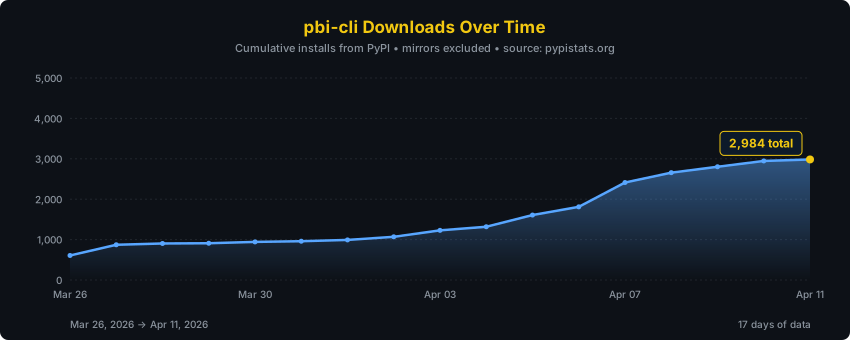
Cumulative downloads, refreshed daily from pypistats.org via GitHub Actions.
---
## Get Started
```bash
pipx install pbi-cli-tool # 1. Install (handles PATH automatically)
pbi-cli skills install # 2. Register Claude Code skills (one-time setup)
pbi connect # 3. Connect to Power BI Desktop
```
Open Power BI Desktop with a `.pbix` file, run the three commands above, and start asking Claude.
> **Requires:** Windows with Python 3.10+ and Power BI Desktop running.
Alternative: give Claude the repo URL
```
Install and set up pbi-cli from https://github.com/MinaSaad1/pbi-cli.git
```
Claude will clone, install, connect, and set up skills automatically.
Using pip instead of pipx?
```bash
pip install pbi-cli-tool
```
On Windows, `pip install` often places the `pbi` command in a directory that isn't on your PATH.
**Fix: Add the Scripts directory to PATH**
```bash
python -c "import site; print(site.getusersitepackages().replace('site-packages','Scripts'))"
```
Add the printed path to your system PATH, then restart your terminal. We recommend `pipx` to avoid this entirely.
---
## Semantic Model Layer
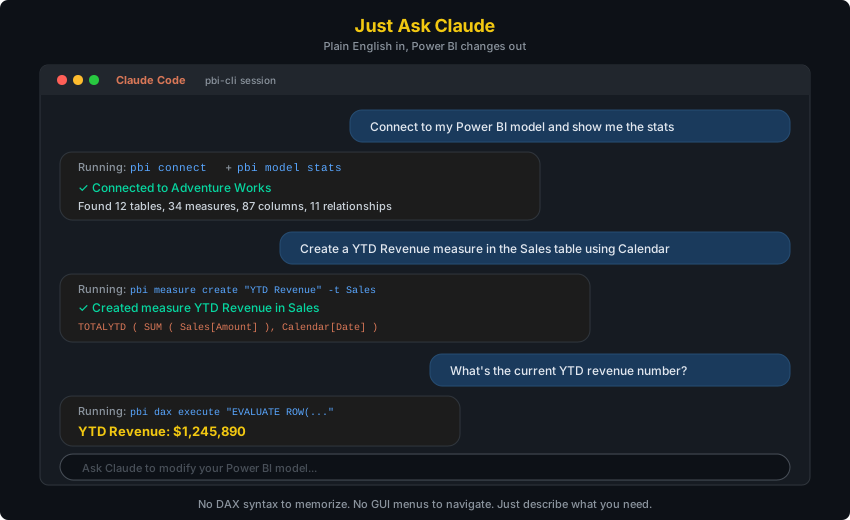
Ask Claude to work with your Power BI semantic model. Requires `pbi connect`.
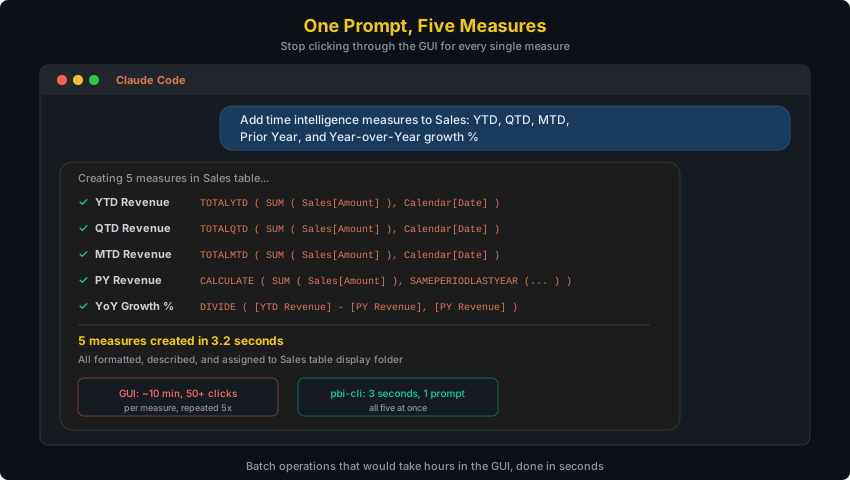
### Create measures in bulk
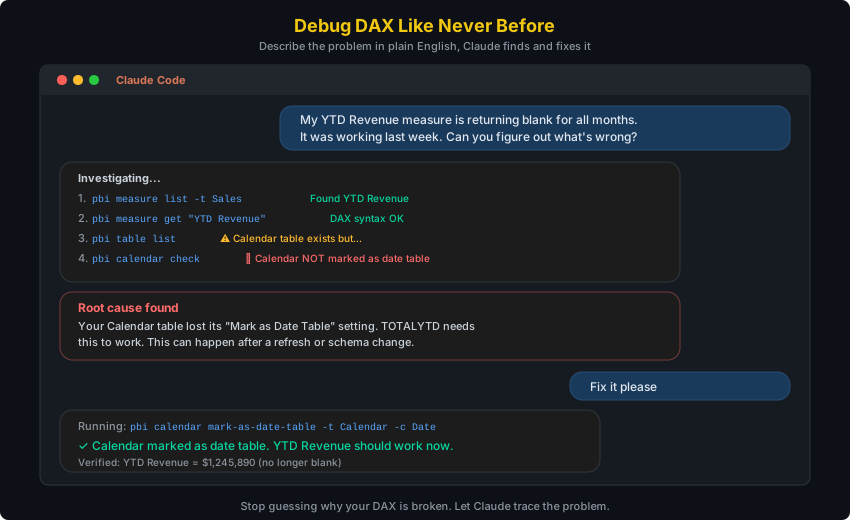
### Debug broken DAX
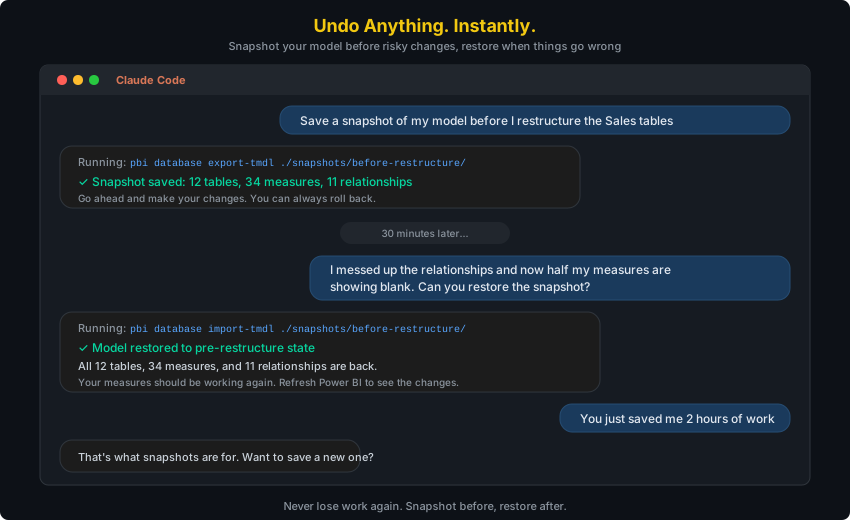
### Snapshot and restore your model
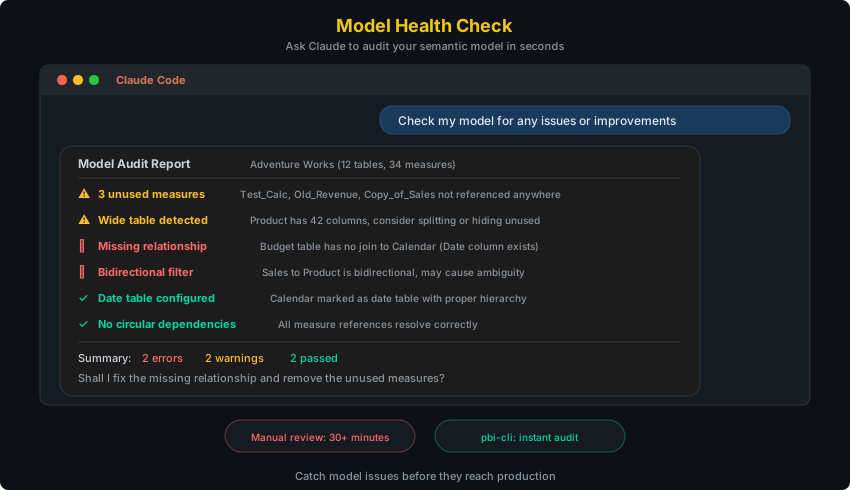
### Audit your model for issues
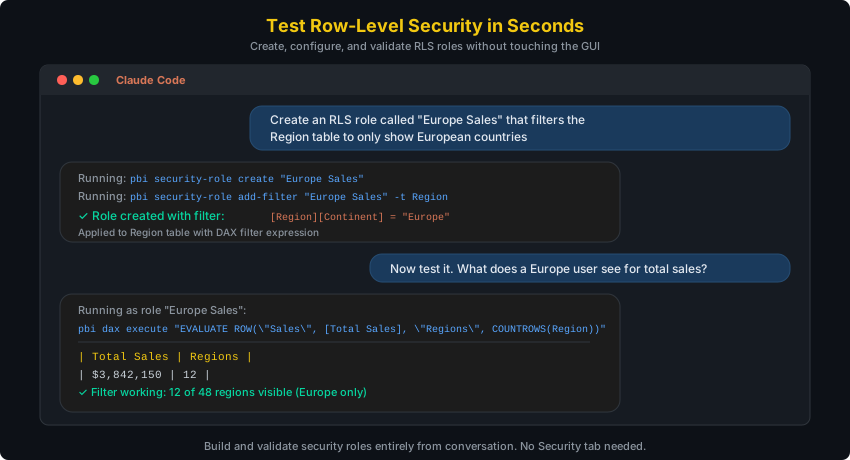
### Test row-level security
---
## Report Layer
Ask Claude to build and manage your Power BI reports. No connection needed -- works directly on PBIR files.
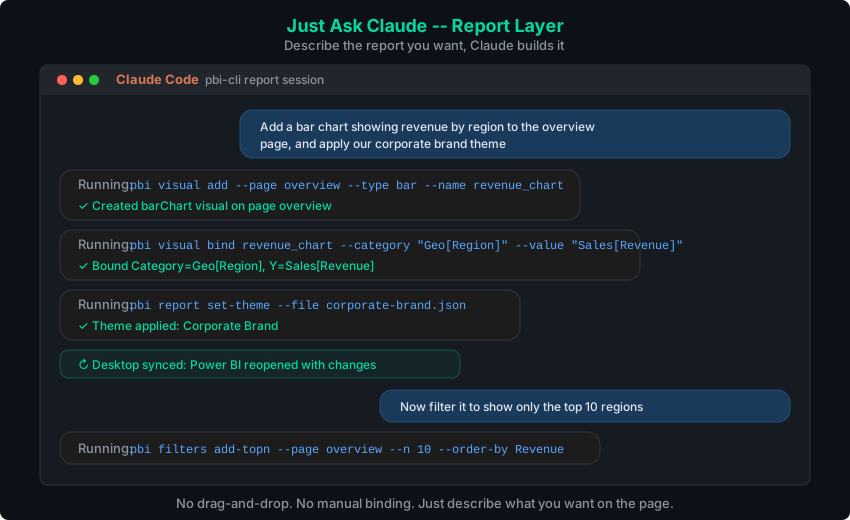
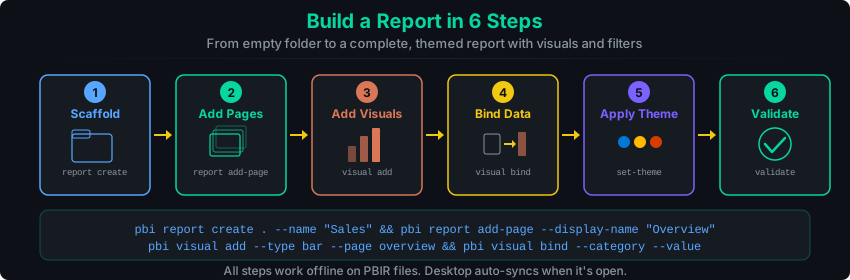
### Build a report in 6 steps
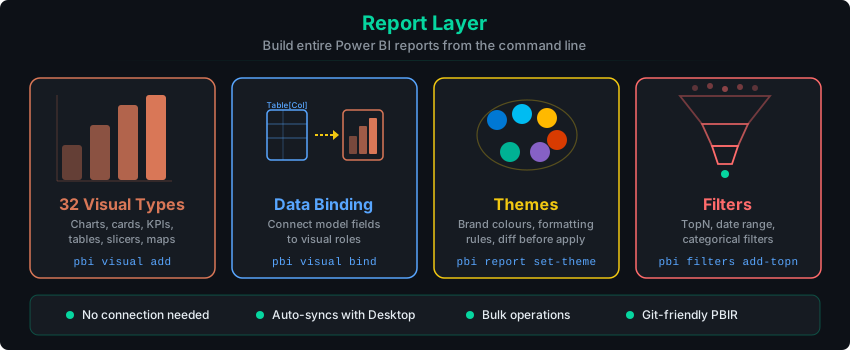
### Visuals, pages, themes, filters
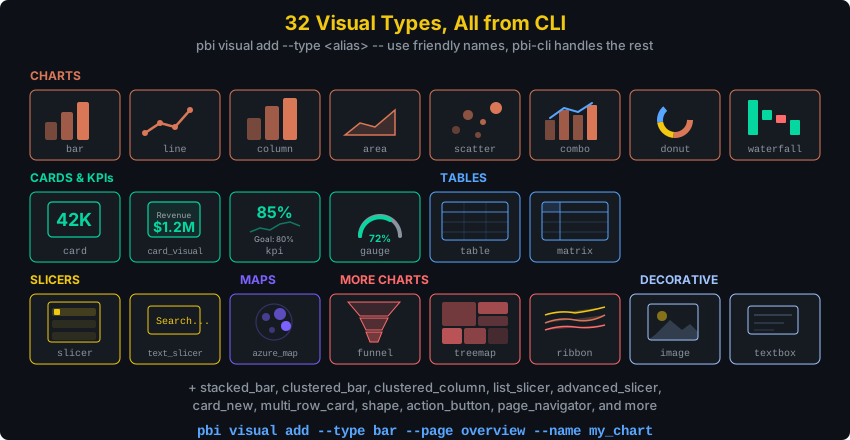
### 32 visual types
---
## Architecture

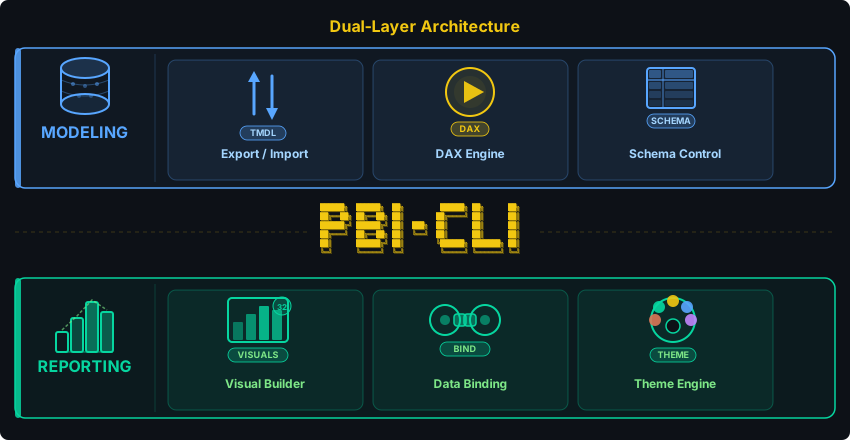
**Two layers, one CLI:**
- **Semantic Model layer** -- Direct in-process .NET interop from Python to Power BI Desktop via TOM/ADOMD. No MCP server, no external binaries, sub-second execution.
- **Report layer** -- Reads and writes PBIR (Enhanced Report Format) JSON files directly. No connection needed. Works with `.pbip` projects.
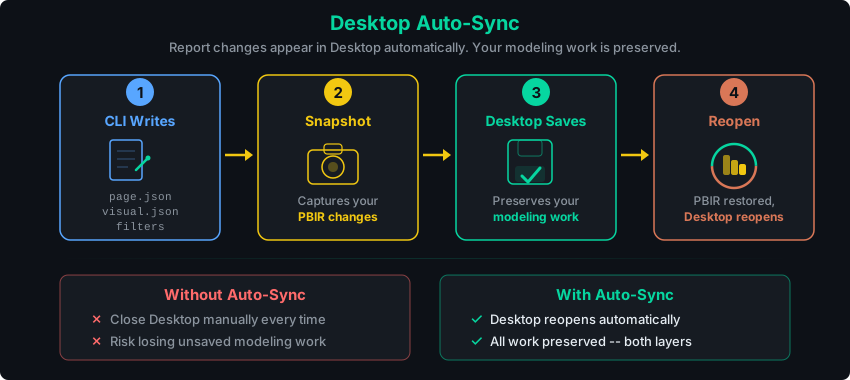
### Desktop Auto-Sync
Configuration details
All config lives in `~/.pbi-cli/`:
```
~/.pbi-cli/
config.json # Default connection preference
connections.json # Named connections
repl_history # REPL command history
```
Bundled DLLs ship inside the Python package (`pbi_cli/dlls/`).
---
## Skills
After running `pbi-cli skills install`, Claude Code discovers **13 Power BI skills**. Each skill teaches Claude a different area. You don't need to memorize commands.
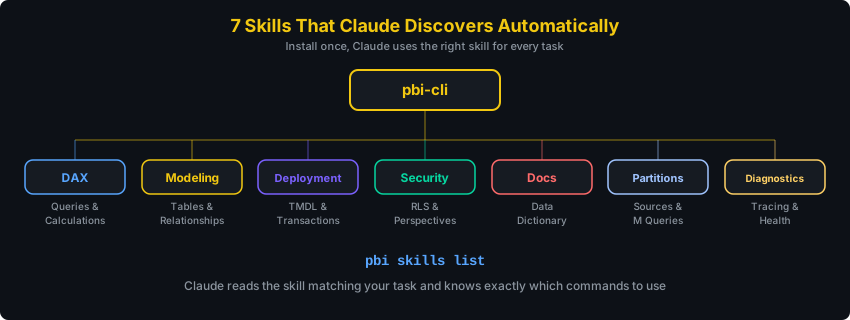
### Semantic Model Skills (require `pbi connect`)
| Skill | What you say | What Claude does |
|-------|-------------|-----------------|
| **DAX** | *"What are the top 10 products by revenue?"* | Writes and executes DAX queries, validates syntax |
| **Modeling** | *"Create a star schema with Sales and Calendar"* | Creates tables, relationships, measures, hierarchies |
| **Deployment** | *"Save a snapshot before I make changes"* | Exports/imports TMDL, manages transactions, diffs snapshots |
| **Security** | *"Set up RLS for regional managers"* | Creates roles, filters, perspectives |
| **Docs** | *"Document everything in this model"* | Generates data dictionaries, measure inventories |
| **Partitions** | *"Show me the M query for the Sales table"* | Manages partitions, expressions, calendar config |
| **Diagnostics** | *"Why is this query so slow?"* | Traces queries, checks model health, benchmarks |
### Report Layer Skills (no connection needed)
| Skill | What you say | What Claude does |
|-------|-------------|-----------------|
| **Report** | *"Create a new report project for Sales"* | Scaffolds PBIR reports, validates structure, previews layout |
| **Visuals** | *"Add a bar chart showing revenue by region"* | Adds, binds, updates, bulk-manages 32 visual types |
| **Pages** | *"Add an Executive Overview page"* | Manages pages, bookmarks, visibility, drillthrough |
| **Themes** | *"Apply our corporate brand colours"* | Applies themes, conditional formatting, colour scales |
| **Filters** | *"Show only the top 10 products"* | Adds page/visual filters (TopN, date, categorical) |
| **Custom Visuals** | *"Build a radial gauge Power BI doesn't have"* | Scaffolds a TypeScript visual project, iterates on `tsc --noEmit`, packages `.pbiviz`, imports into the report |
---
## Custom Visual Authoring
The **Custom Visuals** skill turns vibe-coding into the Power BI Visuals SDK loop.
Claude scaffolds a sibling TypeScript project with `npx pbiviz new`, iterates against
the Power BI Visuals API with `tsc --noEmit` between every change, packages a
`.pbiviz`, and embeds it into your report:
```bash
# After installing the skill, just describe what you want in Claude Code:
# "Build me a radial gauge that highlights values above target"
#
# Under the hood, the skill drives:
npx --yes powerbi-visuals-tools@^5.6.0 new mygaugevisual
# (Claude edits src/visual.ts + capabilities.json, runs tsc --noEmit until clean)
npx --yes powerbi-visuals-tools@^5.6.0 package
pbi visual import-custom dist/mygaugevisual.1.0.5.pbiviz --replace
```
The skill auto-installs Node and `pbiviz` on first run (with your consent), pins
the SDK to a known-good version, keeps the TypeScript project as a sibling to your
`.pbip` (no PBIR contamination), and operates under a curated npm allowlist for
common deps (D3, Lodash, date-fns) -- anything off-list requires explicit approval.
Three new pbi-cli commands support the loop:
| Command | What it does |
|---------|-------------|
| `pbi visual import-custom ` | Embed a locally-built `.pbiviz` into the report's `RegisteredResources/` and register it in `report.json`. `--replace` overwrites by GUID. |
| `pbi visual list-custom` | List embedded and public (AppSource) custom visuals, distinguished by `kind`. |
| `pbi visual remove-custom ` | Deregister and physically delete the `.pbiviz` resource. |
---
## All Commands
27 command groups covering both the semantic model and the report layer.
| Category | Commands |
|----------|----------|
| **Queries** | `dax execute`, `dax validate`, `dax clear-cache` |
| **Model** | `table`, `column`, `measure`, `relationship`, `hierarchy`, `calc-group` |
| **Deploy** | `database export-tmdl`, `database import-tmdl`, `database export-tmsl`, `database diff-tmdl`, `transaction` |
| **Security** | `security-role`, `perspective` |
| **Connect** | `connect`, `disconnect`, `connections list`, `connections last` |
| **Data** | `partition`, `expression`, `calendar`, `advanced culture` |
| **Diagnostics** | `trace start/stop/fetch/export`, `model stats` |
| **Report** | `report create`, `report info`, `report validate`, `report preview`, `report reload` |
| **Pages** | `report add-page`, `report delete-page`, `report get-page`, `report set-background`, `report set-visibility` |
| **Visuals** | `visual add/get/list/update/delete`, `visual bind`, `visual bulk-bind/bulk-update/bulk-delete`, `visual where` |
| **Filters** | `filters list`, `filters add-categorical/add-topn/add-relative-date`, `filters remove/clear` |
| **Formatting** | `format get/clear`, `format background-gradient/background-conditional/background-measure` |
| **Bookmarks** | `bookmarks list/get/add/delete/set-visibility` |
| **Tools** | `setup`, `repl`, `skills install/list/uninstall` |
Use `--json` for machine-readable output (for scripts and AI agents):
```bash
pbi --json measure list
pbi --json dax execute "EVALUATE Sales"
pbi --json visual list --page overview
```
Run `pbi --help` for full options.
---
## REPL Mode
For interactive work, the REPL keeps a persistent connection:
```
$ pbi repl
pbi> connect --data-source localhost:54321
Connected: localhost-54321
pbi(localhost-54321)> measure list
pbi(localhost-54321)> dax execute "EVALUATE TOPN(5, Sales)"
pbi(localhost-54321)> exit
```
Tab completion, command history, and a dynamic prompt showing your active connection.
---
## Development
```bash
git clone https://github.com/MinaSaad1/pbi-cli.git
cd pbi-cli
pip install -e ".[dev]"
```
```bash
ruff check src/ tests/ # Lint
mypy src/ # Type check
pytest -m "not e2e" # Run tests (488 tests)
```
---
## Bundled third-party software
`pbi-cli-tool` ships with Microsoft Analysis Services client library
assemblies (`Microsoft.AnalysisServices.*.dll`) under `src/pbi_cli/dlls/`.
These binaries are **not** covered by pbi-cli's MIT license. They are
redistributed unmodified under the Microsoft Software License Terms for
Microsoft Analysis Management Objects (AMO) and Microsoft Analysis
Services - ADOMD.NET. Full terms are in
[THIRD_PARTY_LICENSES.md](THIRD_PARTY_LICENSES.md) and the companion
[NOTICE](NOTICE) file. By installing `pbi-cli-tool` you agree to those
terms in addition to the MIT License that applies to the rest of the
package.
---
## Contributing
Contributions are welcome! Please open an issue first to discuss what you'd like to change.
1. Fork the repository
2. Create a feature branch
3. Make your changes with tests
4. Open a pull request
---


MIT License — bundled Microsoft DLLs are licensed separately, see THIRD_PARTY_LICENSES.md