<!DOCTYPE html> <html xmlns="http://www.w3.org/1999/xhtml"> <head> <meta charset="utf-8" /> <meta http-equiv="Content-Type" content="text/html; charset=utf-8" /> <meta name="generator" content="pandoc" /> <meta name="author" content="Kaixuan Luo" /> <title>Compare CENTIPEDE predictions for MEF2D for regions that differentially open between hypoxia vs. normoxia</title> <script src="site_libs/jquery-1.11.3/jquery.min.js"></script> <meta name="viewport" content="width=device-width, initial-scale=1" /> <link href="site_libs/bootstrap-3.3.5/css/cosmo.min.css" rel="stylesheet" /> <script src="site_libs/bootstrap-3.3.5/js/bootstrap.min.js"></script> <script src="site_libs/bootstrap-3.3.5/shim/html5shiv.min.js"></script> <script src="site_libs/bootstrap-3.3.5/shim/respond.min.js"></script> <script src="site_libs/jqueryui-1.11.4/jquery-ui.min.js"></script> <link href="site_libs/tocify-1.9.1/jquery.tocify.css" rel="stylesheet" /> <script src="site_libs/tocify-1.9.1/jquery.tocify.js"></script> <script src="site_libs/navigation-1.1/tabsets.js"></script> <script src="site_libs/navigation-1.1/codefolding.js"></script> <link href="site_libs/highlightjs-9.12.0/textmate.css" rel="stylesheet" /> <script src="site_libs/highlightjs-9.12.0/highlight.js"></script> <link href="site_libs/font-awesome-4.5.0/css/font-awesome.min.css" rel="stylesheet" /> <style type="text/css">code{white-space: pre;}</style> <style type="text/css"> pre:not([class]) { background-color: white; } </style> <script type="text/javascript"> if (window.hljs) { hljs.configure({languages: []}); hljs.initHighlightingOnLoad(); if (document.readyState && document.readyState === "complete") { window.setTimeout(function() { hljs.initHighlighting(); }, 0); } } </script> <style type="text/css"> h1 { font-size: 34px; } h1.title { font-size: 38px; } h2 { font-size: 30px; } h3 { font-size: 24px; } h4 { font-size: 18px; } h5 { font-size: 16px; } h6 { font-size: 12px; } .table th:not([align]) { text-align: left; } </style> </head> <body> <style type = "text/css"> .main-container { max-width: 940px; margin-left: auto; margin-right: auto; } code { color: inherit; background-color: rgba(0, 0, 0, 0.04); } img { max-width:100%; height: auto; } .tabbed-pane { padding-top: 12px; } button.code-folding-btn:focus { outline: none; } </style> <style type="text/css"> /* padding for bootstrap navbar */ body { padding-top: 51px; padding-bottom: 40px; } /* offset scroll position for anchor links (for fixed navbar) */ .section h1 { padding-top: 56px; margin-top: -56px; } .section h2 { padding-top: 56px; margin-top: -56px; } .section h3 { padding-top: 56px; margin-top: -56px; } .section h4 { padding-top: 56px; margin-top: -56px; } .section h5 { padding-top: 56px; margin-top: -56px; } .section h6 { padding-top: 56px; margin-top: -56px; } </style> <script> // manage active state of menu based on current page $(document).ready(function () { // active menu anchor href = window.location.pathname href = href.substr(href.lastIndexOf('/') + 1) if (href === "") href = "index.html"; var menuAnchor = $('a[href="' + href + '"]'); // mark it active menuAnchor.parent().addClass('active'); // if it's got a parent navbar menu mark it active as well menuAnchor.closest('li.dropdown').addClass('active'); }); </script> <div class="container-fluid main-container"> <!-- tabsets --> <script> $(document).ready(function () { window.buildTabsets("TOC"); }); </script> <!-- code folding --> <style type="text/css"> .code-folding-btn { margin-bottom: 4px; } </style> <script> $(document).ready(function () { window.initializeCodeFolding("hide" === "show"); }); </script> <script> $(document).ready(function () { // move toc-ignore selectors from section div to header $('div.section.toc-ignore') .removeClass('toc-ignore') .children('h1,h2,h3,h4,h5').addClass('toc-ignore'); // establish options var options = { selectors: "h1,h2,h3", theme: "bootstrap3", context: '.toc-content', hashGenerator: function (text) { return text.replace(/[.\\/?&!#<>]/g, '').replace(/\s/g, '_').toLowerCase(); }, ignoreSelector: ".toc-ignore", scrollTo: 0 }; options.showAndHide = true; options.smoothScroll = true; // tocify var toc = $("#TOC").tocify(options).data("toc-tocify"); }); </script> <style type="text/css"> #TOC { margin: 25px 0px 20px 0px; } @media (max-width: 768px) { #TOC { position: relative; width: 100%; } } .toc-content { padding-left: 30px; padding-right: 40px; } div.main-container { max-width: 1200px; } div.tocify { width: 20%; max-width: 260px; max-height: 85%; } @media (min-width: 768px) and (max-width: 991px) { div.tocify { width: 25%; } } @media (max-width: 767px) { div.tocify { width: 100%; max-width: none; } } .tocify ul, .tocify li { line-height: 20px; } .tocify-subheader .tocify-item { font-size: 0.90em; padding-left: 25px; text-indent: 0; } .tocify .list-group-item { border-radius: 0px; } </style> <!-- setup 3col/9col grid for toc_float and main content --> <div class="row-fluid"> <div class="col-xs-12 col-sm-4 col-md-3"> <div id="TOC" class="tocify"> </div> </div> <div class="toc-content col-xs-12 col-sm-8 col-md-9"> <div class="navbar navbar-default navbar-fixed-top" role="navigation"> <div class="container"> <div class="navbar-header"> <button type="button" class="navbar-toggle collapsed" data-toggle="collapse" data-target="#navbar"> <span class="icon-bar"></span> <span class="icon-bar"></span> <span class="icon-bar"></span> </button> <a class="navbar-brand" href="index.html">ATAC-seq analysis</a> </div> <div id="navbar" class="navbar-collapse collapse"> <ul class="nav navbar-nav"> <li> <a href="index.html">Home</a> </li> <li> <a href="about.html">About</a> </li> <li> <a href="license.html">License</a> </li> </ul> <ul class="nav navbar-nav navbar-right"> <li> <a href="https://github.com/kevinlkx/ATAC-seq_footprint_analysis"> <span class="fa fa-github"></span> </a> </li> </ul> </div><!--/.nav-collapse --> </div><!--/.container --> </div><!--/.navbar --> <!-- Add a small amount of space between sections. --> <style type="text/css"> div.section { padding-top: 12px; } </style> <div class="fluid-row" id="header"> <div class="btn-group pull-right"> <button type="button" class="btn btn-default btn-xs dropdown-toggle" data-toggle="dropdown" aria-haspopup="true" aria-expanded="false"><span>Code</span> <span class="caret"></span></button> <ul class="dropdown-menu" style="min-width: 50px;"> <li><a id="rmd-show-all-code" href="#">Show All Code</a></li> <li><a id="rmd-hide-all-code" href="#">Hide All Code</a></li> </ul> </div> <h1 class="title toc-ignore">Compare CENTIPEDE predictions for MEF2D for regions that differentially open between hypoxia vs. normoxia</h1> <h4 class="author"><em>Kaixuan Luo</em></h4> <h4 class="date"><em>7/25/2018</em></h4> </div> <p><strong>Last updated:</strong> 2018-07-26</p> <strong>workflowr checks:</strong> <small>(Click a bullet for more information)</small> <ul> <li> <p><details> <summary> <strong style="color:blue;">✔</strong> <strong>R Markdown file:</strong> up-to-date </summary></p> <p>Great! Since the R Markdown file has been committed to the Git repository, you know the exact version of the code that produced these results.</p> </details> </li> <li> <p><details> <summary> <strong style="color:blue;">✔</strong> <strong>Environment:</strong> empty </summary></p> <p>Great job! The global environment was empty. Objects defined in the global environment can affect the analysis in your R Markdown file in unknown ways. For reproduciblity it’s best to always run the code in an empty environment.</p> </details> </li> <li> <p><details> <summary> <strong style="color:blue;">✔</strong> <strong>Seed:</strong> <code>set.seed(20180613)</code> </summary></p> <p>The command <code>set.seed(20180613)</code> was run prior to running the code in the R Markdown file. Setting a seed ensures that any results that rely on randomness, e.g. subsampling or permutations, are reproducible.</p> </details> </li> <li> <p><details> <summary> <strong style="color:blue;">✔</strong> <strong>Session information:</strong> recorded </summary></p> <p>Great job! Recording the operating system, R version, and package versions is critical for reproducibility.</p> </details> </li> <li> <p><details> <summary> <strong style="color:blue;">✔</strong> <strong>Repository version:</strong> <a href="https://github.com/kevinlkx/ATAC-seq_footprint_analysis/tree/962aeada03d482f05e3016c1b1c22129c564befa" target="_blank">962aead</a> </summary></p> Great! You are using Git for version control. Tracking code development and connecting the code version to the results is critical for reproducibility. The version displayed above was the version of the Git repository at the time these results were generated. <br><br> Note that you need to be careful to ensure that all relevant files for the analysis have been committed to Git prior to generating the results (you can use <code>wflow_publish</code> or <code>wflow_git_commit</code>). workflowr only checks the R Markdown file, but you know if there are other scripts or data files that it depends on. Below is the status of the Git repository when the results were generated: <pre><code> Ignored files: Ignored: .DS_Store Ignored: .Rhistory Ignored: .Rproj.user/ Ignored: code_RCC/.DS_Store Ignored: data/.DS_Store Untracked files: Untracked: workflow_setup.R </code></pre> Note that any generated files, e.g. HTML, png, CSS, etc., are not included in this status report because it is ok for generated content to have uncommitted changes. </details> </li> </ul> <details> <summary> <small><strong>Expand here to see past versions:</strong></small> </summary> <ul> <table style="border-collapse:separate; border-spacing:5px;"> <thead> <tr> <th style="text-align:left;"> File </th> <th style="text-align:left;"> Version </th> <th style="text-align:left;"> Author </th> <th style="text-align:left;"> Date </th> <th style="text-align:left;"> Message </th> </tr> </thead> <tbody> <tr> <td style="text-align:left;"> html </td> <td style="text-align:left;"> <a href="https://cdn.rawgit.com/kevinlkx/ATAC-seq_footprint_analysis/84c08c3f01cee2e3c199d98e31f053501908bdcf/docs/compare_centipede_predictions_DiffACregions_MEF2D.html" target="_blank">84c08c3</a> </td> <td style="text-align:left;"> kevinlkx </td> <td style="text-align:left;"> 2018-07-26 </td> <td style="text-align:left;"> Build site. </td> </tr> <tr> <td style="text-align:left;"> Rmd </td> <td style="text-align:left;"> <a href="https://github.com/kevinlkx/ATAC-seq_footprint_analysis/blob/fa3ed4c208721fde2b4d99b6547146e2f91fc31c/analysis/compare_centipede_predictions_DiffACregions_MEF2D.Rmd" target="_blank">fa3ed4c</a> </td> <td style="text-align:left;"> kevinlkx </td> <td style="text-align:left;"> 2018-07-26 </td> <td style="text-align:left;"> compare centipede predictions for MEF2D in DiffAC regions </td> </tr> </tbody> </table> </ul> <p></details></p> <hr /> <pre class="r"><code>library(ggplot2) library(grid) library(gridExtra) suppressPackageStartupMessages(library(GenomicRanges)) library(limma)</code></pre> <pre><code> Attaching package: 'limma'</code></pre> <pre><code>The following object is masked from 'package:BiocGenerics': plotMA</code></pre> <pre class="r"><code>library(edgeR) library(VennDiagram)</code></pre> <pre><code>Warning: package 'VennDiagram' was built under R version 3.4.4</code></pre> <pre><code>Loading required package: futile.logger</code></pre> <pre class="r"><code>message <- futile.logger::flog.threshold(futile.logger::ERROR, name = "VennDiagramLogger") ## venn diagram plot_venn_overlaps <- function(overlaps.m, title = "", col_fill = NULL, category.names = NULL){ grid.newpage() overlaps_venn.l <- lapply(as.data.frame(overlaps.m), function(x) which(x == 1)) if(is.null(col_fill)){ col_fill <- 1:length(overlaps_venn.l) } if(is.null(category.names)){ category.names <- names(x) } venn.plot <- venn.diagram( x = overlaps_venn.l, category.names = category.names, filename = NULL, fill = col_fill, alpha=rep(0.5, length(overlaps_venn.l)), cex = 1.5, cat.fontface=4, main=title) grid.draw(venn.plot) }</code></pre> <div id="parameters" class="section level2"> <h2>parameters</h2> <pre class="r"><code>tf_name <- "MEF2D" pwm_name <- "MEF2D_MA0773.1_1e-4" thresh_PostPr_bound <- 0.99 flank <- 100 cat("PWM name: ", pwm_name, "\n")</code></pre> <pre><code>PWM name: MEF2D_MA0773.1_1e-4 </code></pre> </div> <div id="load-diff-accessibility-test-results-comparing-hypoxia-vs.normoxia." class="section level2"> <h2>load diff accessibility test results, comparing hypoxia vs. normoxia.</h2> <ul> <li>log fold change > 0 indicates differentially open in hypoxia.</li> <li>log fold change < 0 indicates differentially open in normoxia.</li> </ul> <pre class="r"><code>diffAC_regions.df <- read.csv("~/Dropbox/research/ATAC_DNase/ATAC-seq_Olivia_Gray/results/DiffAC_regions/ordered_results_withcoords.csv") cat(nrow(diffAC_regions.df), "regions in total \n")</code></pre> <pre><code>138927 regions in total </code></pre> <pre class="r"><code>diffAC_regions.df <- diffAC_regions.df[, c("chr", "Start", "End","GeneID", "baseMean", "Strand", "log2FoldChange", "lfcSE", "stat", "pvalue", "padj")] diffAC_sig_regions.df <- diffAC_regions.df[diffAC_regions.df$padj < 0.1, ] cat(nrow(diffAC_sig_regions.df), "significant regions \n")</code></pre> <pre><code>2390 significant regions </code></pre> <pre class="r"><code>hist(diffAC_regions.df$log2FoldChange, xlab = "log2FoldChange", main = "Differentially open regions (FDR < 10%)")</code></pre> <p><img src="figure/compare_centipede_predictions_DiffACregions_MEF2D.Rmd/unnamed-chunk-3-1.png" width="672" style="display: block; margin: auto;" /></p> <details> <summary><em>
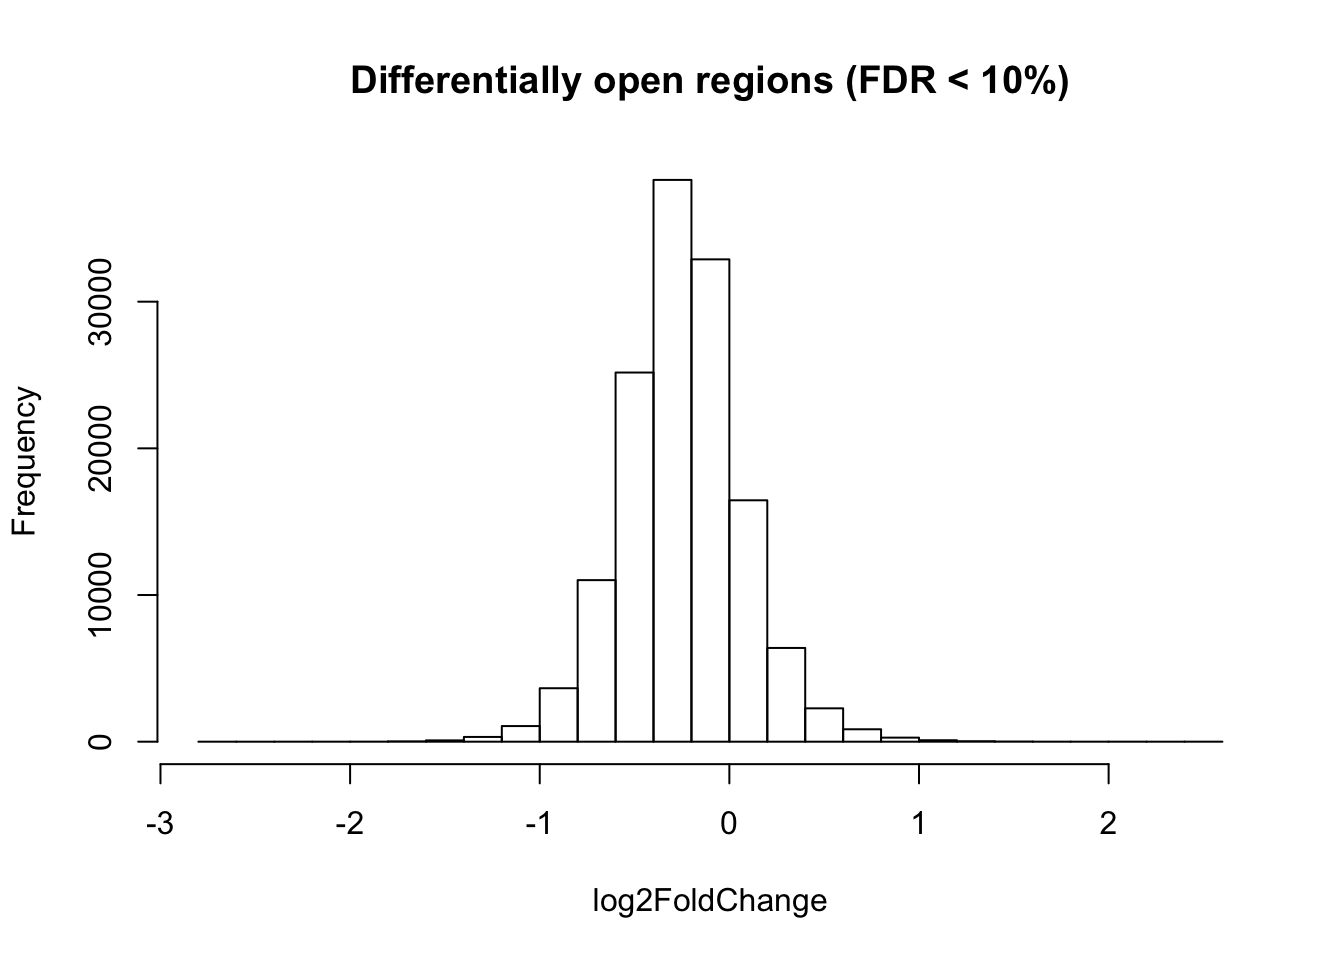
Expand here to see past versions of unnamed-chunk-3-1.png:</em></summary> <table style="border-collapse:separate; border-spacing:5px;"> <thead> <tr> <th style="text-align:left;"> Version </th> <th style="text-align:left;"> Author </th> <th style="text-align:left;"> Date </th> </tr> </thead> <tbody> <tr> <td style="text-align:left;"> <a href="https://github.com/kevinlkx/ATAC-seq_footprint_analysis/blob/84c08c3f01cee2e3c199d98e31f053501908bdcf/docs/figure/compare_centipede_predictions_DiffACregions_MEF2D.Rmd/unnamed-chunk-3-1.png" target="_blank">84c08c3</a> </td> <td style="text-align:left;"> kevinlkx </td> <td style="text-align:left;"> 2018-07-26 </td> </tr> </tbody> </table> <p></details></p> <pre class="r"><code>diffAC_sigH_regions.df <- diffAC_sig_regions.df[diffAC_sig_regions.df$log2FoldChange > 0, ] cat(nrow(diffAC_sigH_regions.df), "regions differentially open in hypoxia. \n")</code></pre> <pre><code>201 regions differentially open in hypoxia. </code></pre> <pre class="r"><code>diffAC_sigN_regions.df <- diffAC_sig_regions.df[diffAC_sig_regions.df$log2FoldChange < 0, ] cat(nrow(diffAC_sigN_regions.df), "regions differentially open in normoxia. \n")</code></pre> <pre><code>2189 regions differentially open in normoxia. </code></pre> <pre class="r"><code>diffAC_sig_regions.gr <- makeGRangesFromDataFrame(diffAC_sig_regions.df, start.field = "Start", end.field = "End", keep.extra.columns = T) diffAC_sigH_regions.gr <- makeGRangesFromDataFrame(diffAC_sigH_regions.df, start.field = "Start", end.field = "End", keep.extra.columns = T) diffAC_sigN_regions.gr <- makeGRangesFromDataFrame(diffAC_sigN_regions.df, start.field = "Start", end.field = "End", keep.extra.columns = T)</code></pre> </div> <div id="load-centipede-predictions" class="section level2"> <h2>load CENTIPEDE predictions</h2> <pre class="r"><code>dir_predictions <- paste0("~/Dropbox/research/ATAC_DNase/ATAC-seq_Olivia_Gray/results/centipede_predictions/", pwm_name) ## condition: N bam_namelist_N <- c("N1_nomito_rdup.bam", "N2_nomito_rdup.bam", "N3_nomito_rdup.bam") site_predictions_N.l <- vector("list", 3) names(site_predictions_N.l) <- bam_namelist_N for(i in 1:length(bam_namelist_N)){ bam_basename <- tools::file_path_sans_ext(basename(bam_namelist_N[[i]])) site_predictions_N.l[[i]] <- read.table(paste0(dir_predictions, "/", pwm_name, "_", bam_basename, "_predictions.txt"), header = T, stringsAsFactors = F) } CentPostPr_N.df <- data.frame(N1 = site_predictions_N.l[[1]]$CentPostPr, N2 = site_predictions_N.l[[2]]$CentPostPr, N3 = site_predictions_N.l[[3]]$CentPostPr) CentLogRatios_N.df <- data.frame(N1 = site_predictions_N.l[[1]]$CentLogRatios, N2 = site_predictions_N.l[[2]]$CentLogRatios, N3 = site_predictions_N.l[[3]]$CentLogRatios) ## condition: H bam_namelist_H <- c("H1_nomito_rdup.bam", "H2_nomito_rdup.bam", "H3_nomito_rdup.bam") site_predictions_H.l <- vector("list", 3) names(site_predictions_H.l) <- bam_namelist_H for(i in 1:length(bam_namelist_H)){ bam_basename <- tools::file_path_sans_ext(basename(bam_namelist_H[[i]])) site_predictions_H.l[[i]] <- read.table(paste0(dir_predictions, "/", pwm_name, "_", bam_basename, "_predictions.txt"), header = T, stringsAsFactors = F) } CentPostPr_H.df <- data.frame(H1 = site_predictions_H.l[[1]]$CentPostPr, H2 = site_predictions_H.l[[2]]$CentPostPr, H3 = site_predictions_H.l[[3]]$CentPostPr) CentLogRatios_H.df <- data.frame(H1 = site_predictions_H.l[[1]]$CentLogRatios, H2 = site_predictions_H.l[[2]]$CentLogRatios, H3 = site_predictions_H.l[[3]]$CentLogRatios) if(any(site_predictions_N.l[[1]]$name != site_predictions_H.l[[1]]$name)){ stop("sites not match!") } sites.df <- site_predictions_N.l[[1]][,1:7] ## get motif coordinates if(sites.df[1, "end"] - sites.df[1, "start"] > flank){ sites.df$start <- sites.df$start + flank sites.df$end <- sites.df$end - flank } sites.gr <- makeGRangesFromDataFrame(sites.df, start.field = "start", end.field = "end", keep.extra.columns = F) CentPostPr.df <- cbind(CentPostPr_N.df, CentPostPr_H.df) CentLogRatios.df <- cbind(CentLogRatios_N.df, CentLogRatios_H.df) sites_CentPostPr.df <- cbind(sites.df, CentPostPr_N.df, CentPostPr_H.df) sites_CentLogRatios.df <- cbind(sites.df, CentLogRatios_N.df, CentLogRatios_H.df)</code></pre> </div> <div id="intersect-centipede-sites-with-diffac-regions" class="section level2"> <h2>intersect CENTIPEDE sites with diffAC regions</h2> <pre class="r"><code>overlaps_diffAC.df <- as.data.frame(findOverlaps(query = sites.gr, subject = diffAC_sig_regions.gr, type = "within", ignore.strand = T)) idx_sites_diffAC <- unique(overlaps_diffAC.df$queryHits) cat(length(idx_sites_diffAC), "candidate motif sites differentially open in hypoxia or normoxia. \n")</code></pre> <pre><code>123 candidate motif sites differentially open in hypoxia or normoxia. </code></pre> <pre class="r"><code>overlaps_sigH.df <- as.data.frame(findOverlaps(query = sites.gr, subject = diffAC_sigH_regions.gr, type = "within", ignore.strand = T)) idx_sites_sigH <- unique(overlaps_sigH.df$queryHits) cat(length(idx_sites_sigH), "candidate motif sites differentially open in hypoxia. \n")</code></pre> <pre><code>23 candidate motif sites differentially open in hypoxia. </code></pre> <pre class="r"><code>overlaps_sigN.df <- as.data.frame(findOverlaps(query = sites.gr, subject = diffAC_sigN_regions.gr, type = "within", ignore.strand = T)) idx_sites_sigN <- unique(overlaps_sigN.df$queryHits) cat(length(idx_sites_sigN), "candidate motif sites differentially open in normoxia. \n")</code></pre> <pre><code>100 candidate motif sites differentially open in normoxia. </code></pre> </div> <div id="number-of-reads-mapped" class="section level2"> <h2>number of reads mapped</h2> <pre class="r"><code>dir_bam <- "~/Dropbox/research/ATAC_DNase/ATAC-seq_Olivia_Gray/ATAC-seq_BAMfiles/" bam_basename_list <- c("N1_nomito_rdup", "N2_nomito_rdup", "N3_nomito_rdup", "H1_nomito_rdup", "H2_nomito_rdup", "H3_nomito_rdup") reads_mapped <- rep(NA, length = length(bam_basename_list)) names(reads_mapped) <- bam_basename_list for(bam_basename in bam_basename_list){ readstats_name <- paste0(dir_bam, "/", bam_basename, ".idxstats.txt") readstats.df <- read.table(readstats_name, header = F) reads_mapped[bam_basename] <- sum(readstats.df[,3]) } cat("Number of reads mapped (million): \n")</code></pre> <pre><code>Number of reads mapped (million): </code></pre> <pre class="r"><code>print(reads_mapped/1e6)</code></pre> <pre><code>N1_nomito_rdup N2_nomito_rdup N3_nomito_rdup H1_nomito_rdup H2_nomito_rdup 44.52970 45.87505 43.06390 30.81426 38.17168 H3_nomito_rdup 37.04096 </code></pre> </div> <div id="binarize-to-bound-and-unbound" class="section level2"> <h2>binarize to bound and unbound</h2> <pre class="r"><code>cat("Number of bound sites that are differentially open in hypoxia: \n")</code></pre> <pre><code>Number of bound sites that are differentially open in hypoxia: </code></pre> <pre class="r"><code>colSums(CentPostPr.df[idx_sites_sigH, ] > thresh_PostPr_bound)</code></pre> <pre><code>N1 N2 N3 H1 H2 H3 19 19 16 23 20 23 </code></pre> <pre class="r"><code>cat("Number of bound sites that are differentially open in normoxia: \n")</code></pre> <pre><code>Number of bound sites that are differentially open in normoxia: </code></pre> <pre class="r"><code>colSums(CentPostPr.df[idx_sites_sigN, ] > thresh_PostPr_bound)</code></pre> <pre><code> N1 N2 N3 H1 H2 H3 100 99 99 80 71 90 </code></pre> </div> <div id="average-binding-probablity-and-average-logratios" class="section level2"> <h2>Average binding probablity and average logRatios</h2> <div id="all-motif-sites" class="section level3"> <h3>all motif sites</h3> <pre class="r"><code># binding probablity par(pty="s") plot(rowMeans(CentPostPr_N.df), rowMeans(CentPostPr_H.df), xlab = "N average P(Bound)", ylab = "H average P(Bound)", main = tf_name, pch = ".", col = rgb(0,0,1,0.7)) abline(a=0, b=1, col = "darkgray")</code></pre> <p><img src="figure/compare_centipede_predictions_DiffACregions_MEF2D.Rmd/unnamed-chunk-8-1.png" width="672" style="display: block; margin: auto;" /></p> <details> <summary><em>
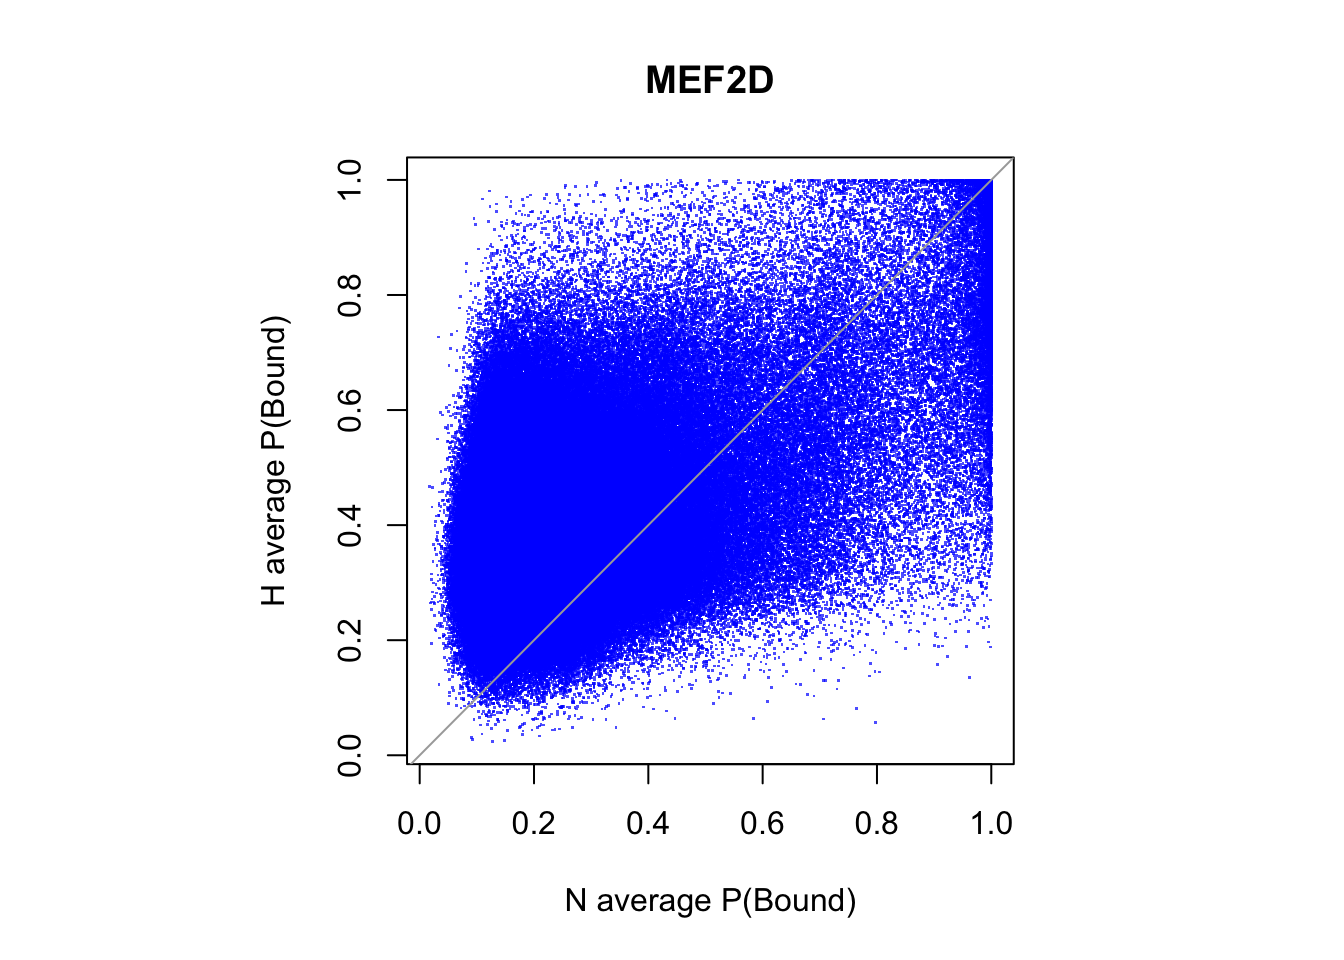
Expand here to see past versions of unnamed-chunk-8-1.png:</em></summary> <table style="border-collapse:separate; border-spacing:5px;"> <thead> <tr> <th style="text-align:left;"> Version </th> <th style="text-align:left;"> Author </th> <th style="text-align:left;"> Date </th> </tr> </thead> <tbody> <tr> <td style="text-align:left;"> <a href="https://github.com/kevinlkx/ATAC-seq_footprint_analysis/blob/84c08c3f01cee2e3c199d98e31f053501908bdcf/docs/figure/compare_centipede_predictions_DiffACregions_MEF2D.Rmd/unnamed-chunk-8-1.png" target="_blank">84c08c3</a> </td> <td style="text-align:left;"> kevinlkx </td> <td style="text-align:left;"> 2018-07-26 </td> </tr> </tbody> </table> <p></details></p> <pre class="r"><code># logRatios par(mfrow = c(1,2)) par(pty="s") plot(rowMeans(CentLogRatios_N.df), rowMeans(CentLogRatios_H.df), xlab = "N average logRatios", ylab = "H average logRatios", main = tf_name, pch = ".", col = rgb(0,0,1,0.7)) abline(a=0,b=1,col = "darkgray") plot(x = (rowMeans(CentLogRatios_H.df)+rowMeans(CentLogRatios_N.df))/2, y = rowMeans(CentLogRatios_H.df) - rowMeans(CentLogRatios_N.df), xlab = "average logRatios", ylab = "Difference in logRatios (H - N)", main = tf_name, pch = ".", col = rgb(0,0,1,0.7)) abline(v=0, h=0, col = "darkgray")</code></pre> <p><img src="figure/compare_centipede_predictions_DiffACregions_MEF2D.Rmd/unnamed-chunk-8-2.png" width="672" style="display: block; margin: auto;" /></p> <details> <summary><em>
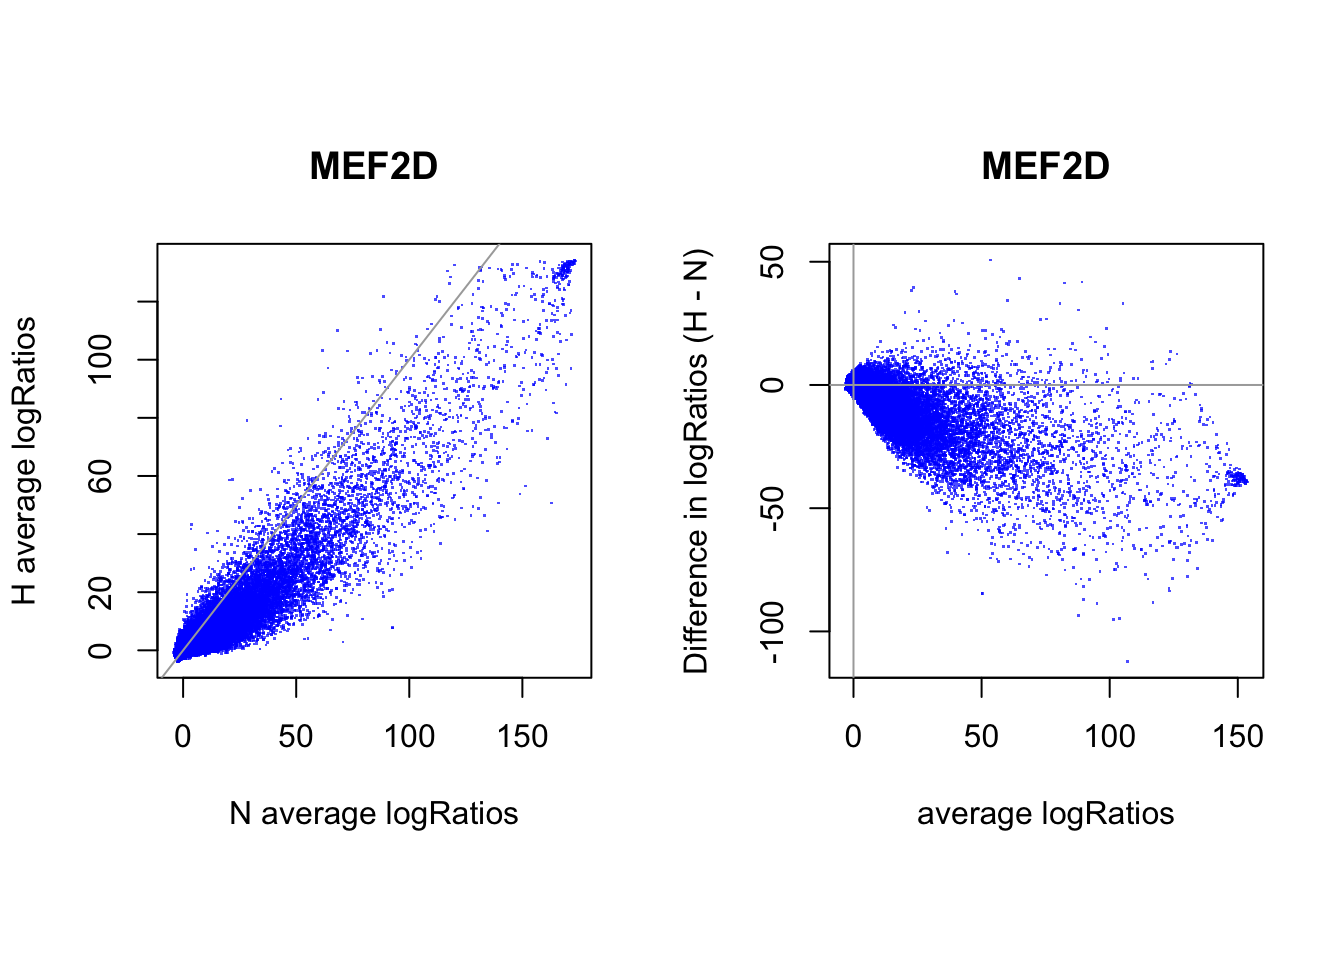
Expand here to see past versions of unnamed-chunk-8-2.png:</em></summary> <table style="border-collapse:separate; border-spacing:5px;"> <thead> <tr> <th style="text-align:left;"> Version </th> <th style="text-align:left;"> Author </th> <th style="text-align:left;"> Date </th> </tr> </thead> <tbody> <tr> <td style="text-align:left;"> <a href="https://github.com/kevinlkx/ATAC-seq_footprint_analysis/blob/84c08c3f01cee2e3c199d98e31f053501908bdcf/docs/figure/compare_centipede_predictions_DiffACregions_MEF2D.Rmd/unnamed-chunk-8-2.png" target="_blank">84c08c3</a> </td> <td style="text-align:left;"> kevinlkx </td> <td style="text-align:left;"> 2018-07-26 </td> </tr> </tbody> </table> <p></details></p> </div> <div id="sites-that-are-differentially-open-in-hypoxia" class="section level3"> <h3>sites that are differentially open in hypoxia</h3> <pre class="r"><code>cat(length(idx_sites_sigH), "candidate motif sites differentially open in hypoxia. \n")</code></pre> <pre><code>23 candidate motif sites differentially open in hypoxia. </code></pre> <pre class="r"><code># binding probablity par(pty="s") plot(rowMeans(CentPostPr_N.df[idx_sites_sigH,]), rowMeans(CentPostPr_H.df[idx_sites_sigH,]), xlab = "N average P(Bound)", ylab = "H average P(Bound)", main = paste(tf_name, "bound sites"), pch = 20, col = rgb(0,0,1,0.7)) abline(a=0, b=1, col = "darkgray")</code></pre> <p><img src="figure/compare_centipede_predictions_DiffACregions_MEF2D.Rmd/unnamed-chunk-9-1.png" width="672" style="display: block; margin: auto;" /></p> <details> <summary><em>
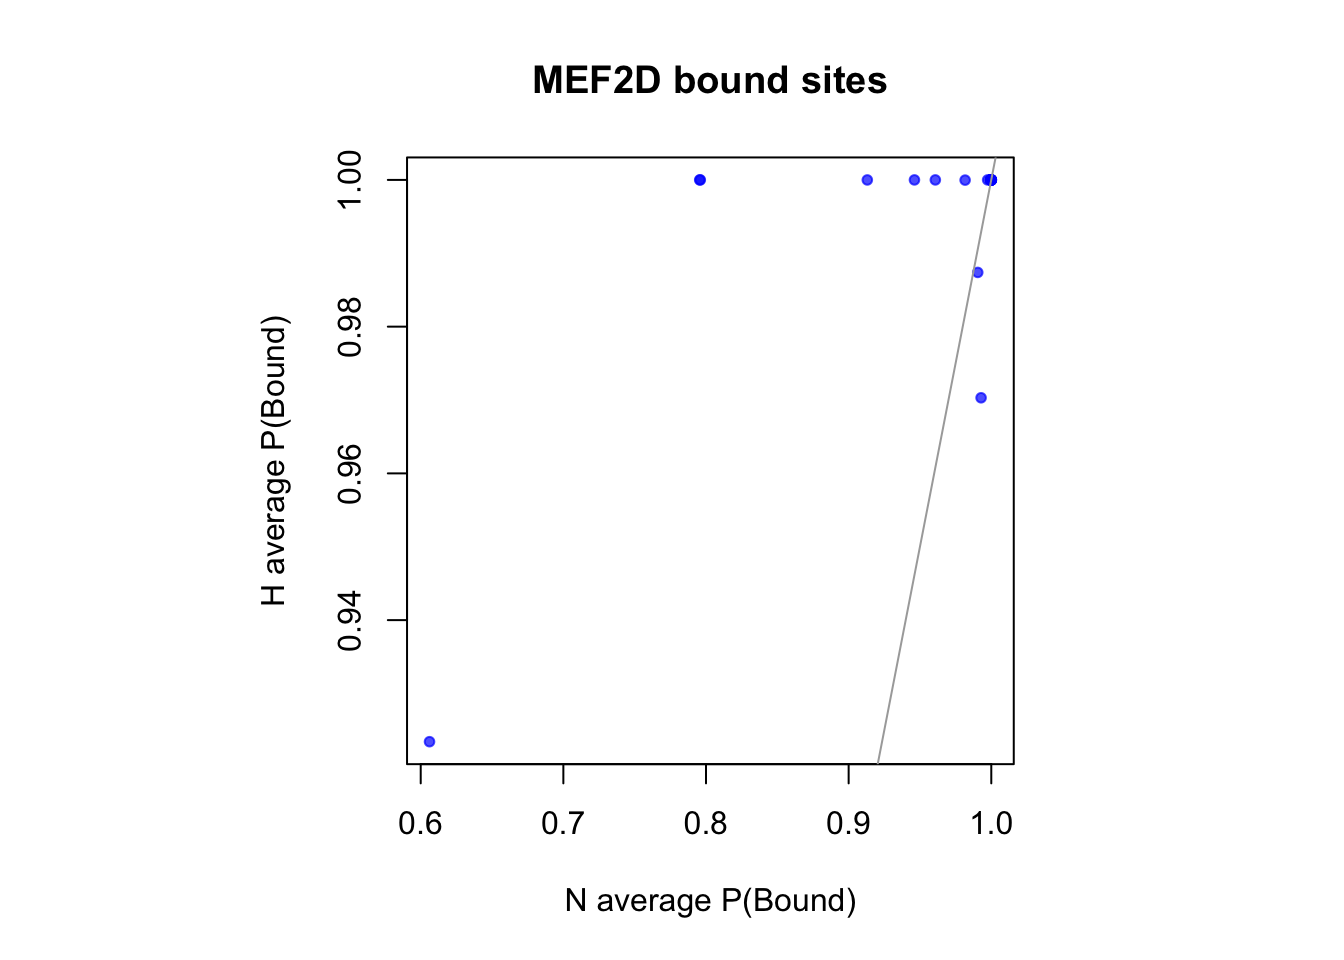
Expand here to see past versions of unnamed-chunk-9-1.png:</em></summary> <table style="border-collapse:separate; border-spacing:5px;"> <thead> <tr> <th style="text-align:left;"> Version </th> <th style="text-align:left;"> Author </th> <th style="text-align:left;"> Date </th> </tr> </thead> <tbody> <tr> <td style="text-align:left;"> <a href="https://github.com/kevinlkx/ATAC-seq_footprint_analysis/blob/84c08c3f01cee2e3c199d98e31f053501908bdcf/docs/figure/compare_centipede_predictions_DiffACregions_MEF2D.Rmd/unnamed-chunk-9-1.png" target="_blank">84c08c3</a> </td> <td style="text-align:left;"> kevinlkx </td> <td style="text-align:left;"> 2018-07-26 </td> </tr> </tbody> </table> <p></details></p> <pre class="r"><code># logRatios par(mfrow = c(1,2)) par(pty="s") plot(rowMeans(CentLogRatios_N.df[idx_sites_sigH,]), rowMeans(CentLogRatios_H.df[idx_sites_sigH,]), xlab = "N average logRatios", ylab = "H average logRatios", main = tf_name, pch = 20, col = rgb(0,0,1,0.7)) abline(a=0,b=1,col = "darkgray") plot(x = (rowMeans(CentLogRatios_H.df[idx_sites_sigH,])+rowMeans(CentLogRatios_N.df[idx_sites_sigH,]))/2, y = rowMeans(CentLogRatios_H.df[idx_sites_sigH,]) - rowMeans(CentLogRatios_N.df[idx_sites_sigH,]), xlab = "average logRatios", ylab = "Difference in logRatios (H - N)", main = tf_name, pch = 20, col = rgb(0,0,1,0.7)) abline(v=0, h=0, col = "darkgray")</code></pre> <p><img src="figure/compare_centipede_predictions_DiffACregions_MEF2D.Rmd/unnamed-chunk-9-2.png" width="672" style="display: block; margin: auto;" /></p> <details> <summary><em>
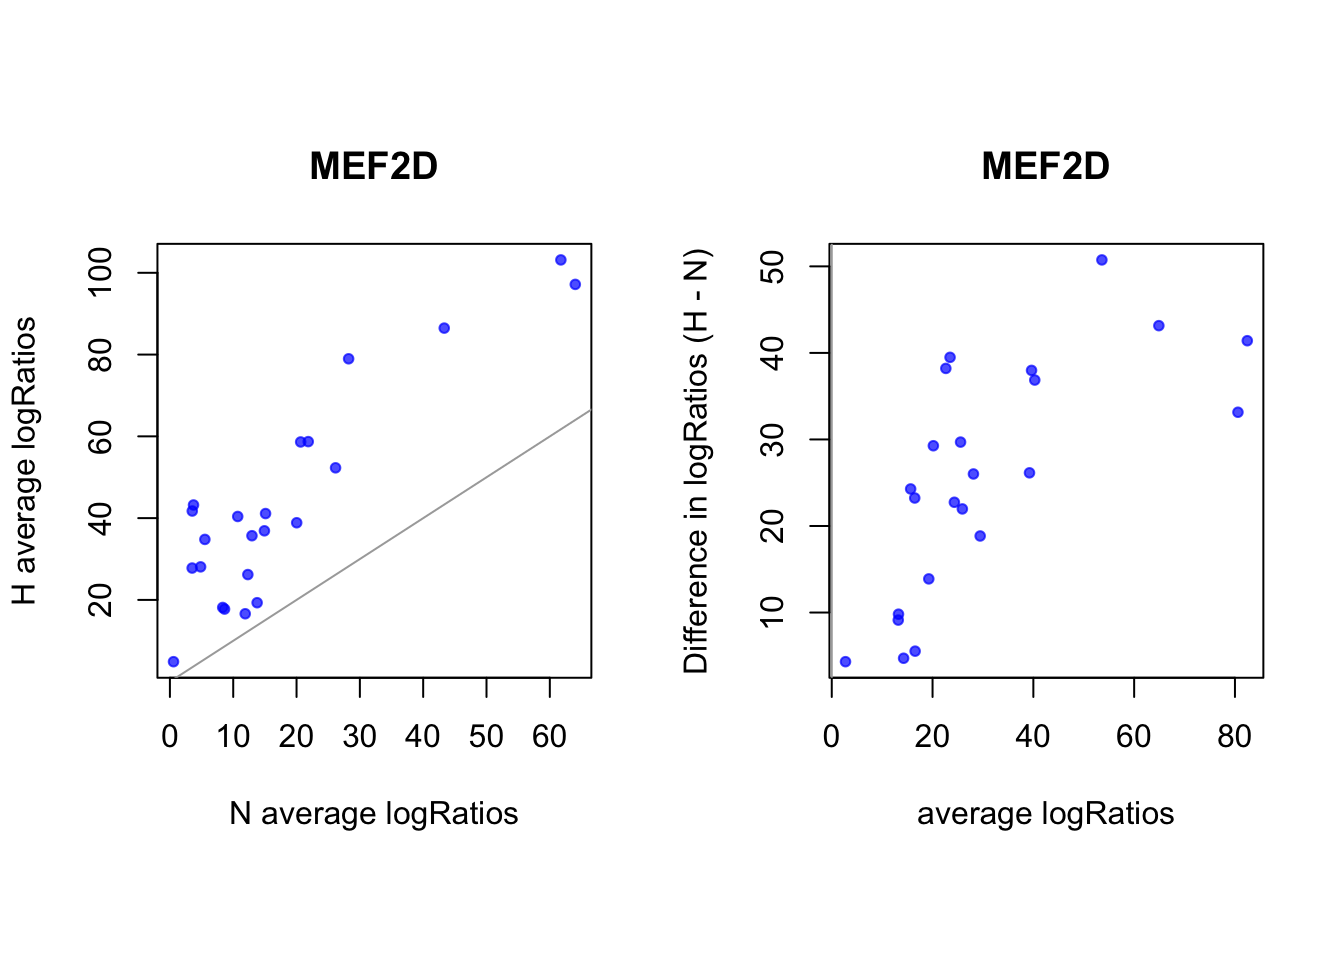
Expand here to see past versions of unnamed-chunk-9-2.png:</em></summary> <table style="border-collapse:separate; border-spacing:5px;"> <thead> <tr> <th style="text-align:left;"> Version </th> <th style="text-align:left;"> Author </th> <th style="text-align:left;"> Date </th> </tr> </thead> <tbody> <tr> <td style="text-align:left;"> <a href="https://github.com/kevinlkx/ATAC-seq_footprint_analysis/blob/84c08c3f01cee2e3c199d98e31f053501908bdcf/docs/figure/compare_centipede_predictions_DiffACregions_MEF2D.Rmd/unnamed-chunk-9-2.png" target="_blank">84c08c3</a> </td> <td style="text-align:left;"> kevinlkx </td> <td style="text-align:left;"> 2018-07-26 </td> </tr> </tbody> </table> <p></details></p> </div> <div id="sites-that-are-differentially-open-in-normoxia" class="section level3"> <h3>sites that are differentially open in normoxia</h3> <pre class="r"><code>cat(length(idx_sites_sigN), "candidate motif sites differentially open in normoxia \n")</code></pre> <pre><code>100 candidate motif sites differentially open in normoxia </code></pre> <pre class="r"><code># binding probablity par(pty="s") plot(rowMeans(CentPostPr_N.df[idx_sites_sigN,]), rowMeans(CentPostPr_H.df[idx_sites_sigN,]), xlab = "N average P(Bound)", ylab = "H average P(Bound)", main = paste(tf_name, "bound sites"), pch = 20, col = rgb(0,0,1,0.7)) abline(a=0, b=1, col = "darkgray")</code></pre> <p><img src="figure/compare_centipede_predictions_DiffACregions_MEF2D.Rmd/unnamed-chunk-10-1.png" width="672" style="display: block; margin: auto;" /></p> <details> <summary><em>
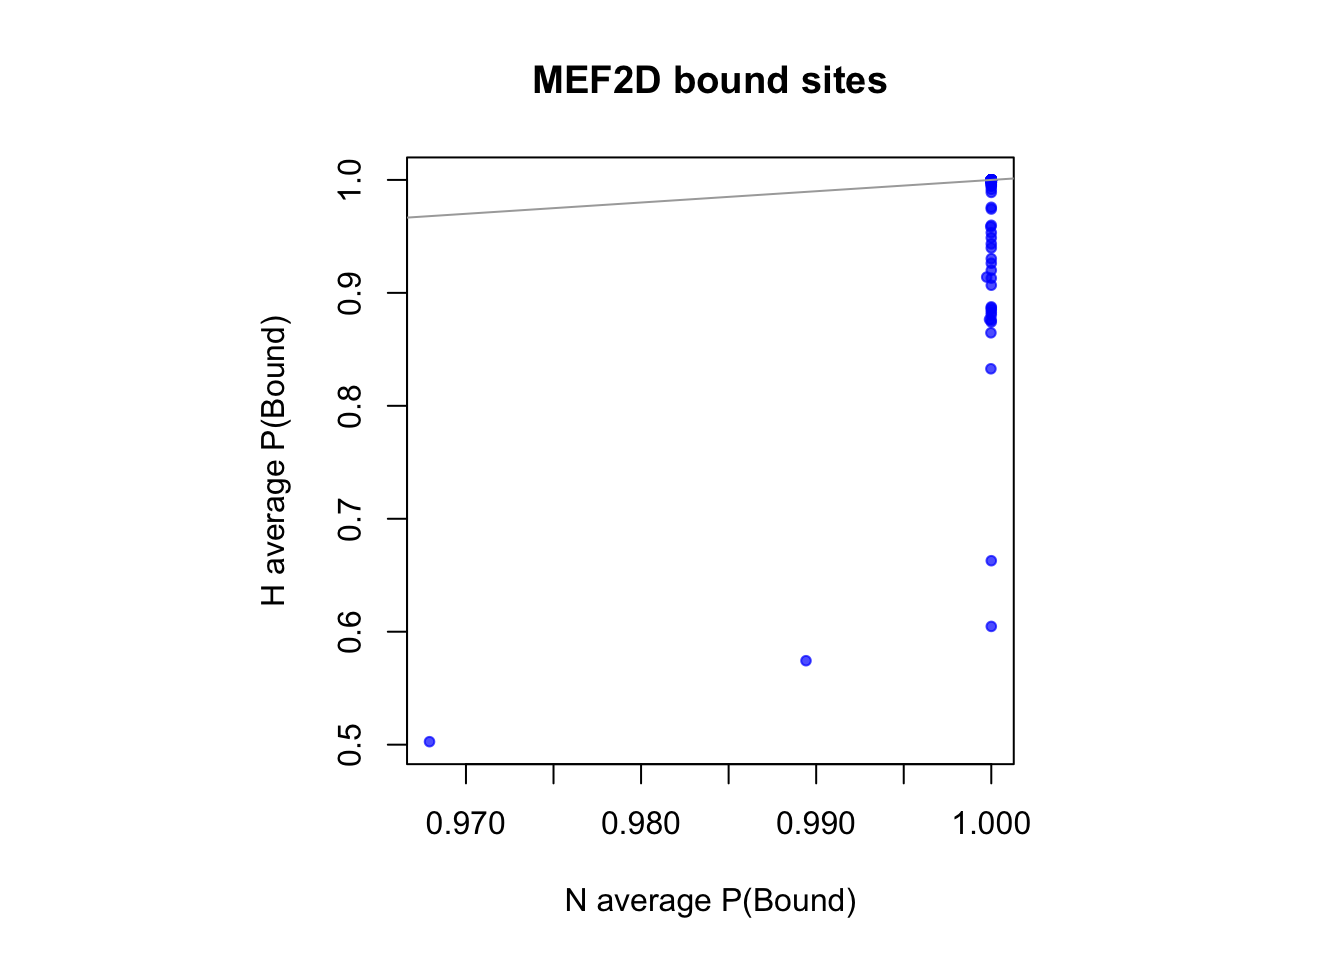
Expand here to see past versions of unnamed-chunk-10-1.png:</em></summary> <table style="border-collapse:separate; border-spacing:5px;"> <thead> <tr> <th style="text-align:left;"> Version </th> <th style="text-align:left;"> Author </th> <th style="text-align:left;"> Date </th> </tr> </thead> <tbody> <tr> <td style="text-align:left;"> <a href="https://github.com/kevinlkx/ATAC-seq_footprint_analysis/blob/84c08c3f01cee2e3c199d98e31f053501908bdcf/docs/figure/compare_centipede_predictions_DiffACregions_MEF2D.Rmd/unnamed-chunk-10-1.png" target="_blank">84c08c3</a> </td> <td style="text-align:left;"> kevinlkx </td> <td style="text-align:left;"> 2018-07-26 </td> </tr> </tbody> </table> <p></details></p> <pre class="r"><code># logRatios par(mfrow = c(1,2)) par(pty="s") plot(rowMeans(CentLogRatios_N.df[idx_sites_sigN,]), rowMeans(CentLogRatios_H.df[idx_sites_sigN,]), xlab = "N average logRatios", ylab = "H average logRatios", main = tf_name, pch = 20, col = rgb(0,0,1,0.7)) abline(a=0,b=1,col = "darkgray") plot(x = (rowMeans(CentLogRatios_H.df[idx_sites_sigN,])+rowMeans(CentLogRatios_N.df[idx_sites_sigN,]))/2, y = rowMeans(CentLogRatios_H.df[idx_sites_sigN,]) - rowMeans(CentLogRatios_N.df[idx_sites_sigN,]), xlab = "average logRatios", ylab = "Difference in logRatios (H - N)", main = tf_name, pch = 20, col = rgb(0,0,1,0.7)) abline(v=0, h=0, col = "darkgray")</code></pre> <p><img src="figure/compare_centipede_predictions_DiffACregions_MEF2D.Rmd/unnamed-chunk-10-2.png" width="672" style="display: block; margin: auto;" /></p> <details> <summary><em>
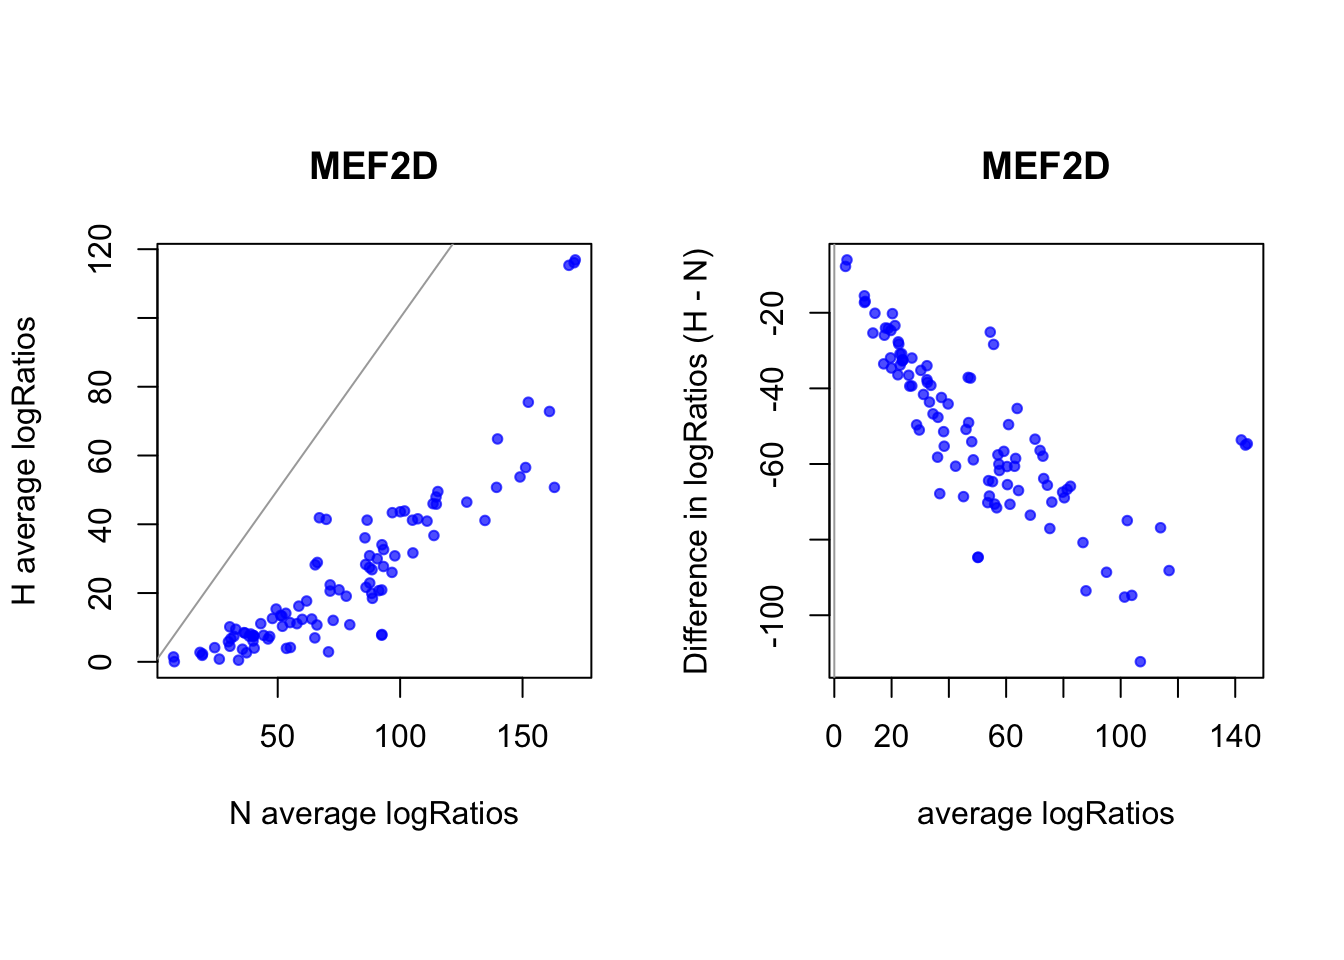
Expand here to see past versions of unnamed-chunk-10-2.png:</em></summary> <table style="border-collapse:separate; border-spacing:5px;"> <thead> <tr> <th style="text-align:left;"> Version </th> <th style="text-align:left;"> Author </th> <th style="text-align:left;"> Date </th> </tr> </thead> <tbody> <tr> <td style="text-align:left;"> <a href="https://github.com/kevinlkx/ATAC-seq_footprint_analysis/blob/84c08c3f01cee2e3c199d98e31f053501908bdcf/docs/figure/compare_centipede_predictions_DiffACregions_MEF2D.Rmd/unnamed-chunk-10-2.png" target="_blank">84c08c3</a> </td> <td style="text-align:left;"> kevinlkx </td> <td style="text-align:left;"> 2018-07-26 </td> </tr> </tbody> </table> <p></details></p> </div> </div> <div id="compare-logratios-for-differentially-accessible-sites-using-limma" class="section level2"> <h2>Compare logRatios for differentially accessible sites using limma</h2> <pre class="r"><code>targets <- data.frame(bam = c(bam_namelist_N, bam_namelist_H), label = colnames(CentLogRatios.df), condition = rep(c("N", "H"), each = 3)) print(targets)</code></pre> <pre><code> bam label condition 1 N1_nomito_rdup.bam N1 N 2 N2_nomito_rdup.bam N2 N 3 N3_nomito_rdup.bam N3 N 4 H1_nomito_rdup.bam H1 H 5 H2_nomito_rdup.bam H2 H 6 H3_nomito_rdup.bam H3 H</code></pre> <pre class="r"><code>condition <- factor(targets$condition, levels = c("N", "H")) design <- model.matrix(~0+condition) colnames(design) <- levels(condition) print(design)</code></pre> <pre><code> N H 1 1 0 2 1 0 3 1 0 4 0 1 5 0 1 6 0 1 attr(,"assign") [1] 1 1 attr(,"contrasts") attr(,"contrasts")$condition [1] "contr.treatment"</code></pre> <pre class="r"><code>CentLogRatios_diffAC.df <- CentLogRatios.df[idx_sites_diffAC, ] fit <- lmFit(CentLogRatios_diffAC.df, design) contrasts <- makeContrasts(H-N, levels=design) fit2 <- contrasts.fit(fit, contrasts) fit2 <- eBayes(fit2, trend=TRUE) num_diffbind <- summary(decideTests(fit2)) percent_diffbind <- round(num_diffbind / sum(num_diffbind) * 100, 2) cat(num_diffbind[1], "sites differentially open in normoxia (", percent_diffbind[1], "%) \n", num_diffbind[3], "sites differentially open in hypoxia (", percent_diffbind[3], "%) \n", num_diffbind[2], "sites not significantly different (", percent_diffbind[2], "%) \n")</code></pre> <pre><code>0 sites differentially open in normoxia ( 0 %) 0 sites differentially open in hypoxia ( 0 %) 123 sites not significantly different ( 100 %) </code></pre> <pre class="r"><code># volcanoplot(fit2, main="H vs. N", xlab = "Difference in logRatios (H - N)") plot(x = fit2$coef, y = -log10(fit2$p.value), xlab = "Difference in logRatios (H - N)", ylab = "-log10(P-value)", main= paste(tf_name, "H vs. N"), pch = 16, cex = 0.35)</code></pre> <p><img src="figure/compare_centipede_predictions_DiffACregions_MEF2D.Rmd/unnamed-chunk-11-1.png" width="672" style="display: block; margin: auto;" /></p> <details> <summary><em>
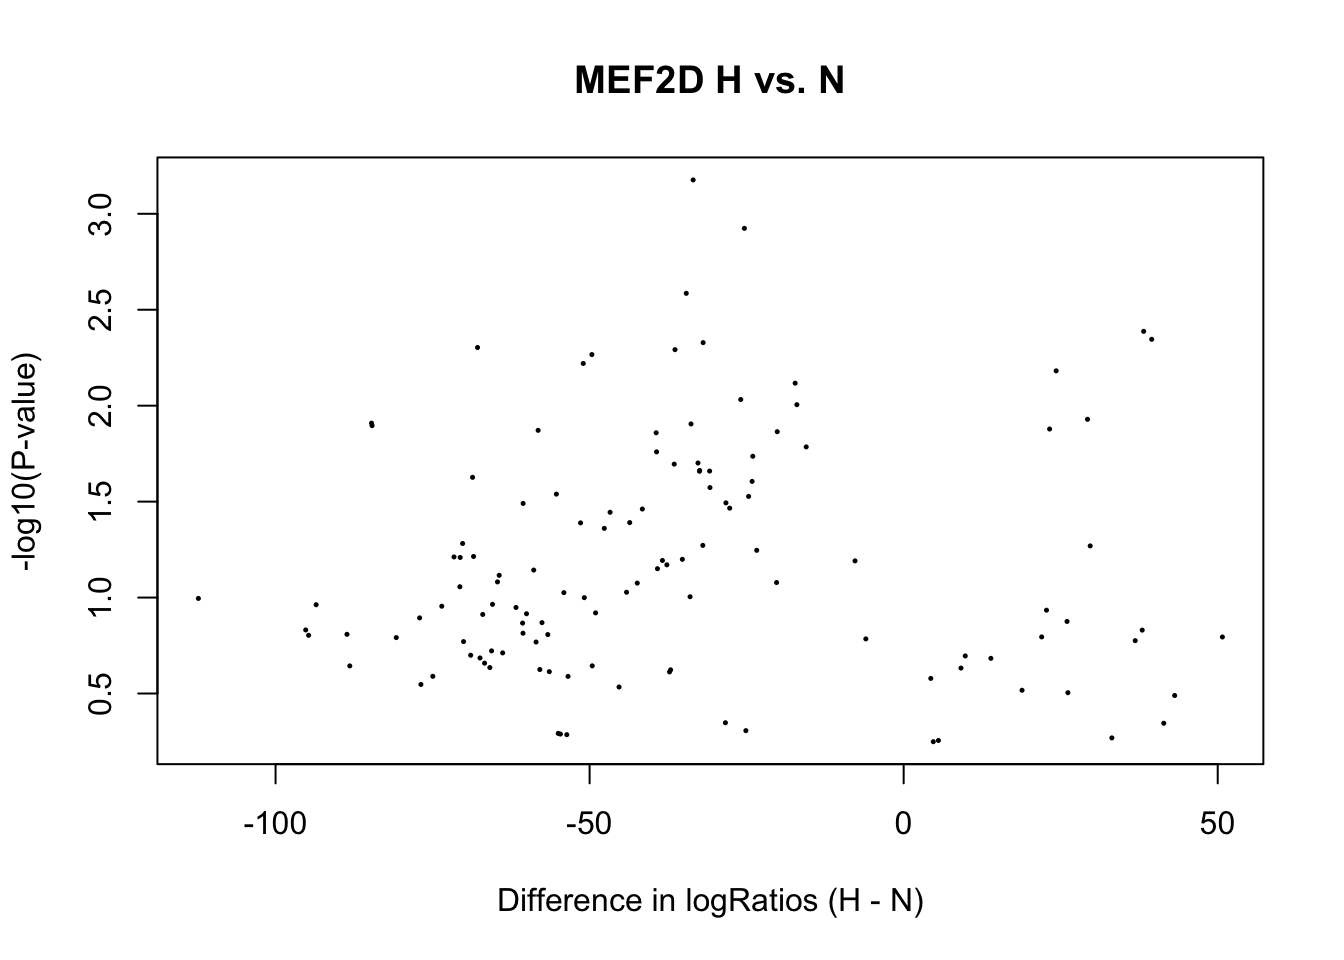
Expand here to see past versions of unnamed-chunk-11-1.png:</em></summary> <table style="border-collapse:separate; border-spacing:5px;"> <thead> <tr> <th style="text-align:left;"> Version </th> <th style="text-align:left;"> Author </th> <th style="text-align:left;"> Date </th> </tr> </thead> <tbody> <tr> <td style="text-align:left;"> <a href="https://github.com/kevinlkx/ATAC-seq_footprint_analysis/blob/84c08c3f01cee2e3c199d98e31f053501908bdcf/docs/figure/compare_centipede_predictions_DiffACregions_MEF2D.Rmd/unnamed-chunk-11-1.png" target="_blank">84c08c3</a> </td> <td style="text-align:left;"> kevinlkx </td> <td style="text-align:left;"> 2018-07-26 </td> </tr> </tbody> </table> <p></details></p> </div> <div id="session-information" class="section level2"> <h2>Session information</h2> <pre class="r"><code>sessionInfo()</code></pre> <pre><code>R version 3.4.3 (2017-11-30) Platform: x86_64-apple-darwin15.6.0 (64-bit) Running under: macOS High Sierra 10.13.6 Matrix products: default BLAS: /Library/Frameworks/R.framework/Versions/3.4/Resources/lib/libRblas.0.dylib LAPACK: /Library/Frameworks/R.framework/Versions/3.4/Resources/lib/libRlapack.dylib locale: [1] en_US.UTF-8/en_US.UTF-8/en_US.UTF-8/C/en_US.UTF-8/en_US.UTF-8 attached base packages: [1] parallel stats4 grid stats graphics grDevices utils [8] datasets methods base other attached packages: [1] VennDiagram_1.6.20 futile.logger_1.4.3 edgeR_3.20.9 [4] limma_3.34.9 GenomicRanges_1.30.3 GenomeInfoDb_1.14.0 [7] IRanges_2.12.0 S4Vectors_0.16.0 BiocGenerics_0.24.0 [10] gridExtra_2.3 ggplot2_2.2.1 loaded via a namespace (and not attached): [1] Rcpp_0.12.16 formatR_1.5 XVector_0.18.0 [4] compiler_3.4.3 pillar_1.2.2 git2r_0.21.0 [7] plyr_1.8.4 workflowr_1.1.1 futile.options_1.0.1 [10] zlibbioc_1.24.0 R.methodsS3_1.7.1 R.utils_2.6.0 [13] bitops_1.0-6 tools_3.4.3 digest_0.6.15 [16] lattice_0.20-35 evaluate_0.10.1 tibble_1.4.2 [19] gtable_0.2.0 rlang_0.2.0 yaml_2.1.18 [22] GenomeInfoDbData_1.0.0 stringr_1.3.0 knitr_1.20 [25] locfit_1.5-9.1 rprojroot_1.3-2 rmarkdown_1.9 [28] lambda.r_1.2.2 magrittr_1.5 whisker_0.3-2 [31] splines_3.4.3 backports_1.1.2 scales_0.5.0 [34] htmltools_0.3.6 colorspace_1.3-2 stringi_1.1.7 [37] RCurl_1.95-4.10 lazyeval_0.2.1 munsell_0.4.3 [40] R.oo_1.22.0 </code></pre> </div> <!-- Adjust MathJax settings so that all math formulae are shown using TeX fonts only; see http://docs.mathjax.org/en/latest/configuration.html. This will make the presentation more consistent at the cost of the webpage sometimes taking slightly longer to load. Note that this only works because the footer is added to webpages before the MathJax javascript. --> <script type="text/x-mathjax-config"> MathJax.Hub.Config({ "HTML-CSS": { availableFonts: ["TeX"] } }); </script> <hr> <p> This reproducible <a href="http://rmarkdown.rstudio.com">R Markdown</a> analysis was created with <a href="https://github.com/jdblischak/workflowr">workflowr</a> 1.1.1 </p> <hr> </div> </div> </div> <script> // add bootstrap table styles to pandoc tables function bootstrapStylePandocTables() { $('tr.header').parent('thead').parent('table').addClass('table table-condensed'); } $(document).ready(function () { bootstrapStylePandocTables(); }); </script> <!-- dynamically load mathjax for compatibility with self-contained --> <script> (function () { var script = document.createElement("script"); script.type = "text/javascript"; script.src = "https://mathjax.rstudio.com/latest/MathJax.js?config=TeX-AMS-MML_HTMLorMML"; document.getElementsByTagName("head")[0].appendChild(script); })(); </script> </body> </html>