<!DOCTYPE html>

<html xmlns="http://www.w3.org/1999/xhtml">

<head>

<meta charset="utf-8" />
<meta http-equiv="Content-Type" content="text/html; charset=utf-8" />
<meta name="generator" content="pandoc" />


<meta name="author" content="jhmarcus" />

<meta name="date" content="2019-02-15" />

<title>Human Origins Array Global Results</title>

<script src="site_libs/jquery-1.11.3/jquery.min.js"></script>
<meta name="viewport" content="width=device-width, initial-scale=1" />
<link href="site_libs/bootstrap-3.3.5/css/cosmo.min.css" rel="stylesheet" />
<script src="site_libs/bootstrap-3.3.5/js/bootstrap.min.js"></script>
<script src="site_libs/bootstrap-3.3.5/shim/html5shiv.min.js"></script>
<script src="site_libs/bootstrap-3.3.5/shim/respond.min.js"></script>
<script src="site_libs/jqueryui-1.11.4/jquery-ui.min.js"></script>
<link href="site_libs/tocify-1.9.1/jquery.tocify.css" rel="stylesheet" />
<script src="site_libs/tocify-1.9.1/jquery.tocify.js"></script>
<script src="site_libs/navigation-1.1/tabsets.js"></script>
<link href="site_libs/highlightjs-9.12.0/textmate.css" rel="stylesheet" />
<script src="site_libs/highlightjs-9.12.0/highlight.js"></script>
<link href="site_libs/font-awesome-5.1.0/css/all.css" rel="stylesheet" />
<link href="site_libs/font-awesome-5.1.0/css/v4-shims.css" rel="stylesheet" />

<style type="text/css">code{white-space: pre;}</style>
<style type="text/css">
  pre:not([class]) {
    background-color: white;
  }
</style>
<script type="text/javascript">
if (window.hljs) {
  hljs.configure({languages: []});
  hljs.initHighlightingOnLoad();
  if (document.readyState && document.readyState === "complete") {
    window.setTimeout(function() { hljs.initHighlighting(); }, 0);
  }
}
</script>


<style type="text/css">
h1 {
  font-size: 34px;
}
h1.title {
  font-size: 38px;
}
h2 {
  font-size: 30px;
}
h3 {
  font-size: 24px;
}
h4 {
  font-size: 18px;
}
h5 {
  font-size: 16px;
}
h6 {
  font-size: 12px;
}
.table th:not([align]) {
  text-align: left;
}
</style>


</head>

<body>

<style type = "text/css">
.main-container {
  max-width: 940px;
  margin-left: auto;
  margin-right: auto;
}
code {
  color: inherit;
  background-color: rgba(0, 0, 0, 0.04);
}
img {
  max-width:100%;
  height: auto;
}
.tabbed-pane {
  padding-top: 12px;
}
.html-widget {
  margin-bottom: 20px;
}
button.code-folding-btn:focus {
  outline: none;
}
summary {
  display: list-item;
}
</style>


<style type="text/css">
/* padding for bootstrap navbar */
body {
  padding-top: 51px;
  padding-bottom: 40px;
}
/* offset scroll position for anchor links (for fixed navbar)  */
.section h1 {
  padding-top: 56px;
  margin-top: -56px;
}
.section h2 {
  padding-top: 56px;
  margin-top: -56px;
}
.section h3 {
  padding-top: 56px;
  margin-top: -56px;
}
.section h4 {
  padding-top: 56px;
  margin-top: -56px;
}
.section h5 {
  padding-top: 56px;
  margin-top: -56px;
}
.section h6 {
  padding-top: 56px;
  margin-top: -56px;
}
.dropdown-submenu {
  position: relative;
}
.dropdown-submenu>.dropdown-menu {
  top: 0;
  left: 100%;
  margin-top: -6px;
  margin-left: -1px;
  border-radius: 0 6px 6px 6px;
}
.dropdown-submenu:hover>.dropdown-menu {
  display: block;
}
.dropdown-submenu>a:after {
  display: block;
  content: " ";
  float: right;
  width: 0;
  height: 0;
  border-color: transparent;
  border-style: solid;
  border-width: 5px 0 5px 5px;
  border-left-color: #cccccc;
  margin-top: 5px;
  margin-right: -10px;
}
.dropdown-submenu:hover>a:after {
  border-left-color: #ffffff;
}
.dropdown-submenu.pull-left {
  float: none;
}
.dropdown-submenu.pull-left>.dropdown-menu {
  left: -100%;
  margin-left: 10px;
  border-radius: 6px 0 6px 6px;
}
</style>

<script>
// manage active state of menu based on current page
$(document).ready(function () {
  // active menu anchor
  href = window.location.pathname
  href = href.substr(href.lastIndexOf('/') + 1)
  if (href === "")
    href = "index.html";
  var menuAnchor = $('a[href="' + href + '"]');

  // mark it active
  menuAnchor.parent().addClass('active');

  // if it's got a parent navbar menu mark it active as well
  menuAnchor.closest('li.dropdown').addClass('active');
});
</script>

<div class="container-fluid main-container">

<!-- tabsets -->

<style type="text/css">
.tabset-dropdown > .nav-tabs {
  display: inline-table;
  max-height: 500px;
  min-height: 44px;
  overflow-y: auto;
  background: white;
  border: 1px solid #ddd;
  border-radius: 4px;
}

.tabset-dropdown > .nav-tabs > li.active:before {
  content: "";
  font-family: 'Glyphicons Halflings';
  display: inline-block;
  padding: 10px;
  border-right: 1px solid #ddd;
}

.tabset-dropdown > .nav-tabs.nav-tabs-open > li.active:before {
  content: "&#xe258;";
  border: none;
}

.tabset-dropdown > .nav-tabs.nav-tabs-open:before {
  content: "";
  font-family: 'Glyphicons Halflings';
  display: inline-block;
  padding: 10px;
  border-right: 1px solid #ddd;
}

.tabset-dropdown > .nav-tabs > li.active {
  display: block;
}

.tabset-dropdown > .nav-tabs > li > a,
.tabset-dropdown > .nav-tabs > li > a:focus,
.tabset-dropdown > .nav-tabs > li > a:hover {
  border: none;
  display: inline-block;
  border-radius: 4px;
}

.tabset-dropdown > .nav-tabs.nav-tabs-open > li {
  display: block;
  float: none;
}

.tabset-dropdown > .nav-tabs > li {
  display: none;
}
</style>

<script>
$(document).ready(function () {
  window.buildTabsets("TOC");
});

$(document).ready(function () {
  $('.tabset-dropdown > .nav-tabs > li').click(function () {
    $(this).parent().toggleClass('nav-tabs-open')
  });
});
</script>

<!-- code folding -->


<script>
$(document).ready(function ()  {

    // move toc-ignore selectors from section div to header
    $('div.section.toc-ignore')
        .removeClass('toc-ignore')
        .children('h1,h2,h3,h4,h5').addClass('toc-ignore');

    // establish options
    var options = {
      selectors: "h1,h2,h3",
      theme: "bootstrap3",
      context: '.toc-content',
      hashGenerator: function (text) {
        return text.replace(/[.\\/?&!#<>]/g, '').replace(/\s/g, '_').toLowerCase();
      },
      ignoreSelector: ".toc-ignore",
      scrollTo: 0
    };
    options.showAndHide = true;
    options.smoothScroll = true;

    // tocify
    var toc = $("#TOC").tocify(options).data("toc-tocify");
});
</script>

<style type="text/css">

#TOC {
  margin: 25px 0px 20px 0px;
}
@media (max-width: 768px) {
#TOC {
  position: relative;
  width: 100%;
}
}


.toc-content {
  padding-left: 30px;
  padding-right: 40px;
}

div.main-container {
  max-width: 1200px;
}

div.tocify {
  width: 20%;
  max-width: 260px;
  max-height: 85%;
}

@media (min-width: 768px) and (max-width: 991px) {
  div.tocify {
    width: 25%;
  }
}

@media (max-width: 767px) {
  div.tocify {
    width: 100%;
    max-width: none;
  }
}

.tocify ul, .tocify li {
  line-height: 20px;
}

.tocify-subheader .tocify-item {
  font-size: 0.90em;
  padding-left: 25px;
  text-indent: 0;
}

.tocify .list-group-item {
  border-radius: 0px;
}


</style>

<!-- setup 3col/9col grid for toc_float and main content  -->
<div class="row-fluid">
<div class="col-xs-12 col-sm-4 col-md-3">
<div id="TOC" class="tocify">
</div>
</div>

<div class="toc-content col-xs-12 col-sm-8 col-md-9">


<div class="navbar navbar-default  navbar-fixed-top" role="navigation">
  <div class="container">
    <div class="navbar-header">
      <button type="button" class="navbar-toggle collapsed" data-toggle="collapse" data-target="#navbar">
        <span class="icon-bar"></span>
        <span class="icon-bar"></span>
        <span class="icon-bar"></span>
      </button>
      <a class="navbar-brand" href="index.html">drift-workflow</a>
    </div>
    <div id="navbar" class="navbar-collapse collapse">
      <ul class="nav navbar-nav">
        <li>
  <a href="index.html">Home</a>
</li>
<li>
  <a href="about.html">About</a>
</li>
<li>
  <a href="license.html">License</a>
</li>
      </ul>
      <ul class="nav navbar-nav navbar-right">
        <li>
  <a href="https://github.com/jdblischak/workflowr">
    <span class="fa fa-github"></span>
     
  </a>
</li>
      </ul>
    </div><!--/.nav-collapse -->
  </div><!--/.container -->
</div><!--/.navbar -->

<!-- Add a small amount of space between sections. -->
<style type="text/css">
div.section {
  padding-top: 12px;
}
</style>

<div class="fluid-row" id="header">


<h1 class="title toc-ignore">Human Origins Array Global Results</h1>
<h4 class="author"><em>jhmarcus</em></h4>
<h4 class="date"><em>2019-02-15</em></h4>

</div>


<p><strong>Last updated:</strong> 2019-02-15</p>
<strong>workflowr checks:</strong> <small>(Click a bullet for more information)</small>
<ul>
<li>
<details>
<p><summary> <strong style="color:red;">✖</strong> <strong>R Markdown file:</strong> uncommitted changes </summary> The R Markdown file has unstaged changes. To know which version of the R Markdown file created these results, you’ll want to first commit it to the Git repo. If you’re still working on the analysis, you can ignore this warning. When you’re finished, you can run <code>wflow_publish</code> to commit the R Markdown file and build the HTML.</p>
</details>
</li>
<li>
<details>
<p><summary> <strong style="color:blue;">✔</strong> <strong>Environment:</strong> empty </summary></p>
<p>Great job! The global environment was empty. Objects defined in the global environment can affect the analysis in your R Markdown file in unknown ways. For reproduciblity it’s best to always run the code in an empty environment.</p>
</details>
</li>
<li>
<details>
<p><summary> <strong style="color:blue;">✔</strong> <strong>Seed:</strong> <code>set.seed(20190211)</code> </summary></p>
<p>The command <code>set.seed(20190211)</code> was run prior to running the code in the R Markdown file. Setting a seed ensures that any results that rely on randomness, e.g. subsampling or permutations, are reproducible.</p>
</details>
</li>
<li>
<details>
<p><summary> <strong style="color:blue;">✔</strong> <strong>Session information:</strong> recorded </summary></p>
<p>Great job! Recording the operating system, R version, and package versions is critical for reproducibility.</p>
</details>
</li>
<li>
<details>
<p><summary> <strong style="color:blue;">✔</strong> <strong>Repository version:</strong> <a href="https://github.com/jhmarcus/drift-workflow/tree/7a2b6c7d6a6827a391b617d74eb09098b1873a9a" target="_blank">7a2b6c7</a> </summary></p>
Great! You are using Git for version control. Tracking code development and connecting the code version to the results is critical for reproducibility. The version displayed above was the version of the Git repository at the time these results were generated. <br><br> Note that you need to be careful to ensure that all relevant files for the analysis have been committed to Git prior to generating the results (you can use <code>wflow_publish</code> or <code>wflow_git_commit</code>). workflowr only checks the R Markdown file, but you know if there are other scripts or data files that it depends on. Below is the status of the Git repository when the results were generated:
<pre><code>
Ignored files:
    Ignored:    .Rhistory
    Ignored:    Makefile
    Ignored:    analysis/flash_cache/
    Ignored:    data/.DS_Store
    Ignored:    data/raw/
    Ignored:    output/admixture/
    Ignored:    output/flash_backfit/
    Ignored:    output/flash_greedy/
    Ignored:    output/softImpute/

Unstaged changes:
    Modified:   analysis/hoa_global.Rmd

</code></pre>
Note that any generated files, e.g. HTML, png, CSS, etc., are not included in this status report because it is ok for generated content to have uncommitted changes.
</details>
</li>
</ul>
<details>
<summary> <small><strong>Expand here to see past versions:</strong></small> </summary>
<ul>
<table style="border-collapse:separate; border-spacing:5px;">
<thead>
<tr>
<th style="text-align:left;">
File
</th>
<th style="text-align:left;">
Version
</th>
<th style="text-align:left;">
Author
</th>
<th style="text-align:left;">
Date
</th>
<th style="text-align:left;">
Message
</th>
</tr>
</thead>
<tbody>
<tr>
<td style="text-align:left;">
Rmd
</td>
<td style="text-align:left;">
<a href="https://github.com/jhmarcus/drift-workflow/blob/7a2b6c7d6a6827a391b617d74eb09098b1873a9a/analysis/hoa_global.Rmd" target="_blank">7a2b6c7</a>
</td>
<td style="text-align:left;">
jhmarcus
</td>
<td style="text-align:left;">
2019-02-15
</td>
<td style="text-align:left;">
added backfit
</td>
</tr>
<tr>
<td style="text-align:left;">
html
</td>
<td style="text-align:left;">
<a href="https://cdn.rawgit.com/jhmarcus/drift-workflow/7a2b6c7d6a6827a391b617d74eb09098b1873a9a/docs/hoa_global.html" target="_blank">7a2b6c7</a>
</td>
<td style="text-align:left;">
jhmarcus
</td>
<td style="text-align:left;">
2019-02-15
</td>
<td style="text-align:left;">
added backfit
</td>
</tr>
<tr>
<td style="text-align:left;">
Rmd
</td>
<td style="text-align:left;">
<a href="https://github.com/jhmarcus/drift-workflow/blob/f5ef1af4d17d9469ed52811c88166186d0c3c993/analysis/hoa_global.Rmd" target="_blank">f5ef1af</a>
</td>
<td style="text-align:left;">
jhmarcus
</td>
<td style="text-align:left;">
2019-02-15
</td>
<td style="text-align:left;">
added workflows for human origins datasets
</td>
</tr>
<tr>
<td style="text-align:left;">
html
</td>
<td style="text-align:left;">
<a href="https://cdn.rawgit.com/jhmarcus/drift-workflow/f5ef1af4d17d9469ed52811c88166186d0c3c993/docs/hoa_global.html" target="_blank">f5ef1af</a>
</td>
<td style="text-align:left;">
jhmarcus
</td>
<td style="text-align:left;">
2019-02-15
</td>
<td style="text-align:left;">
added workflows for human origins datasets
</td>
</tr>
<tr>
<td style="text-align:left;">
Rmd
</td>
<td style="text-align:left;">
<a href="https://github.com/jhmarcus/drift-workflow/blob/4afc77e7c21b668a5b240c920c563dab67acc0e5/analysis/hoa_global.Rmd" target="_blank">4afc77e</a>
</td>
<td style="text-align:left;">
jhmarcus
</td>
<td style="text-align:left;">
2019-02-15
</td>
<td style="text-align:left;">
init hoa global analysis
</td>
</tr>
</tbody>
</table>
</ul>
</details>
<hr />
<div id="imports" class="section level2">
<h2>Imports</h2>
<p>Lets import some needed packages:</p>
<pre class="r"><code>library(ggplot2)
library(tidyr)
library(dplyr)
library(RColorBrewer)
source(&quot;../code/viz.R&quot;)

# this is the color palette we will use over and over 
getPalette = colorRampPalette(brewer.pal(12, &quot;Set3&quot;))</code></pre>
</div>
<div id="human-origins-global-ld-pruned" class="section level2">
<h2>Human Origins Global (LD Pruned)</h2>
<p>This is the full Human Origins dataset 2068 sampled from around the world. I filtered out rare variants with global minor allele frequency less than 5%, and remove any variants with a missingness level greater than 1%. I then LD pruned the SNPs using standard parameters in <code>plink</code>, resulting in 167178 SNPs.</p>
<div id="greedy" class="section level3">
<h3>Greedy</h3>
<p>Lets first read the greedy <code>flashier</code> fit</p>
<pre class="r"><code>flash_fit = readRDS(&quot;../output/flash_greedy/hoa_global_ld/HumanOriginsPublic2068_maf_geno_ldprune.rds&quot;)
K = ncol(flash_fit$loadings$normalized.loadings[[1]]) 
n = nrow(flash_fit$loadings$normalized.loadings[[1]])
p = nrow(flash_fit$loadings$normalized.loadings[[2]])
print(K)</code></pre>
<pre><code>[1] 31</code></pre>
<pre class="r"><code>print(n)</code></pre>
<pre><code>[1] 2068</code></pre>
<pre class="r"><code>print(p)</code></pre>
<pre><code>[1] 167178</code></pre>
<p>Lets now plot the distribution of factors for each drift event</p>
<pre class="r"><code># read factors
delta_df = as.data.frame(flash_fit$loadings$normalized.loadings[[2]])
colnames(delta_df)[1:K] = 1:K 

# gather the data.frame for plotting
delta_gath_df = delta_df %&gt;% 
                gather(K, value) %&gt;%
                filter(K!=1)

# plot the factors
K_ = K
p_fct = ggplot(delta_gath_df, aes(x=value, fill=factor(K, 2:K_))) + 
        scale_fill_manual(values = getPalette(K_)) +
        geom_histogram() + 
        facet_wrap(~factor(K, levels=2:K_), scales = &quot;free&quot;) + 
        labs(fill=&quot;K&quot;) + 
        scale_x_continuous(breaks = scales::pretty_breaks(n = 3)) +
        scale_y_continuous(breaks = scales::pretty_breaks(n = 3)) + 
        theme_bw()
p_fct</code></pre>
<p><img src="figure/hoa_global.Rmd/flash-greedy-ld-viz-factors-1.png" width="768" style="display: block; margin: auto;" /></p>
<details>
<summary><em>
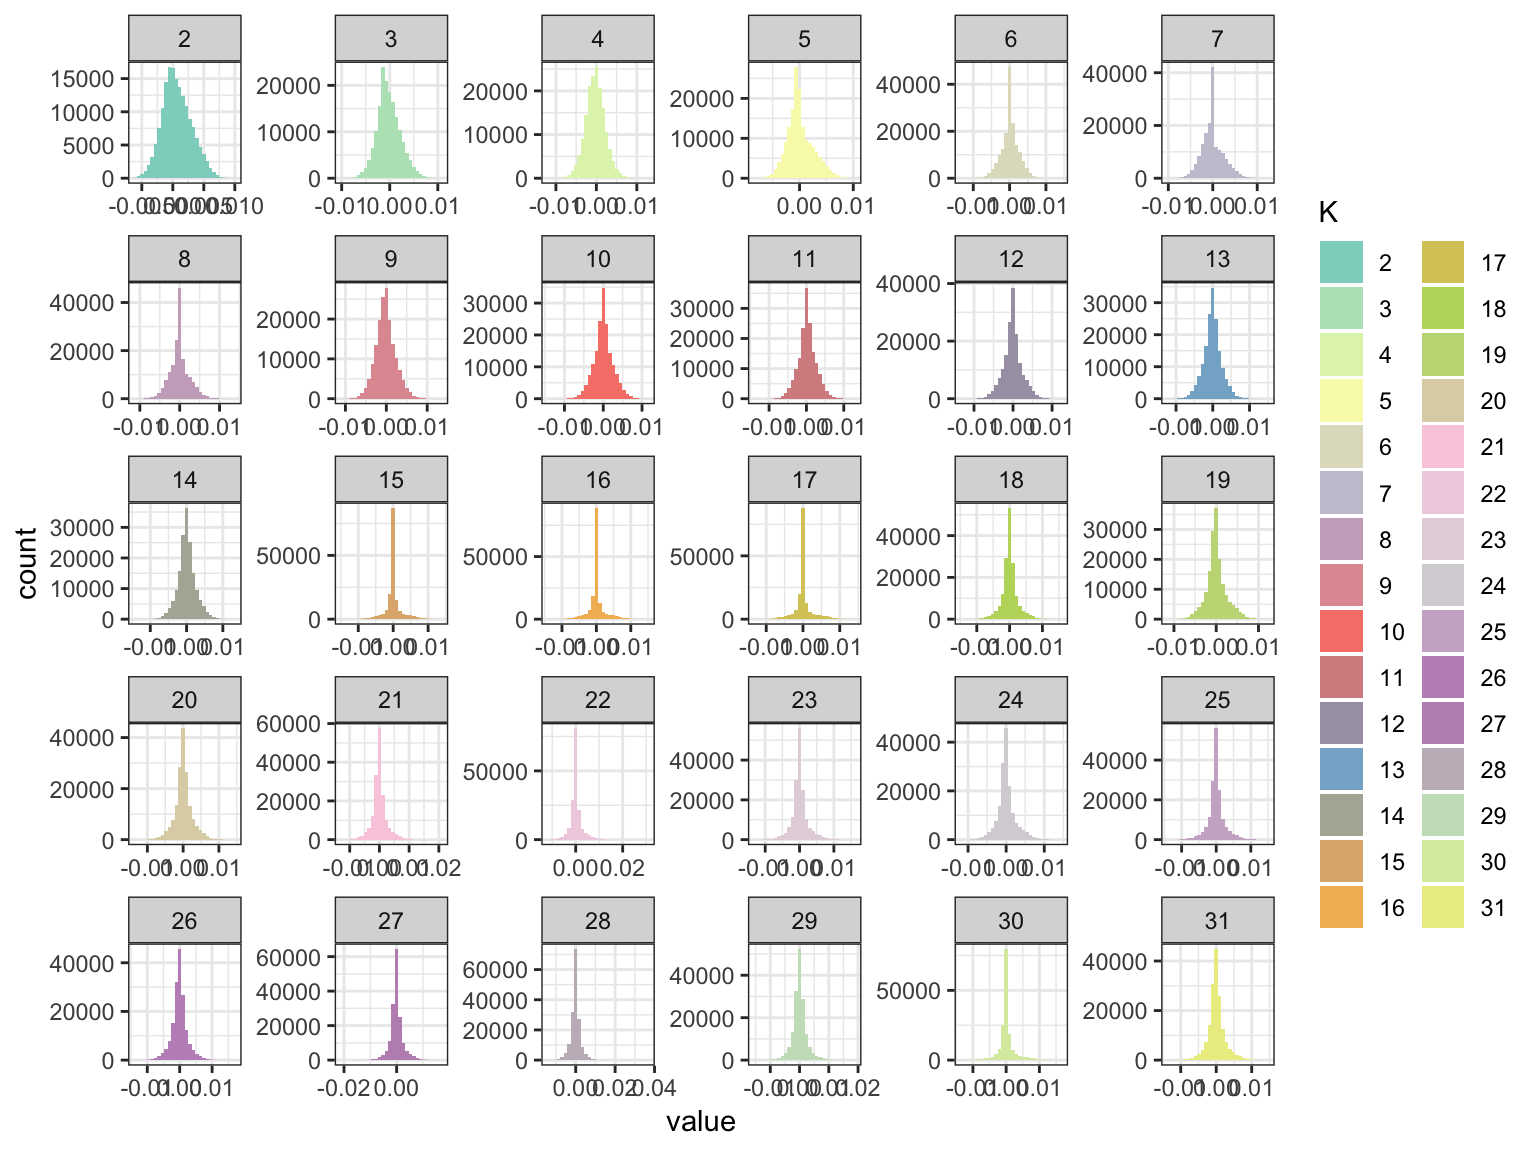
Expand here to see past versions of flash-greedy-ld-viz-factors-1.png:</em></summary>
<table style = "border-collapse:separate; border-spacing:5px;">
<thead>
<tr>
<th style="text-align:left;">
Version
</th>
<th style="text-align:left;">
Author
</th>
<th style="text-align:left;">
Date
</th>
</tr>
</thead>
<tbody>
<tr>
<td style="text-align:left;">
<a href="https://github.com/jhmarcus/drift-workflow/blob/f5ef1af4d17d9469ed52811c88166186d0c3c993/docs/figure/hoa_global.Rmd/flash-greedy-ld-viz-factors-1.png" target="_blank">f5ef1af</a>
</td>
<td style="text-align:left;">
jhmarcus
</td>
<td style="text-align:left;">
2019-02-15
</td>
</tr>
</tbody>
</table>
</details>
<p>We can see the later factors tend to get sparser but they still seem to contribute! Lets now take a look at the loadings:</p>
<pre class="r"><code>############### data ############### 

# read the meta data
meta_df = read.table(&quot;../data/meta/HumanOriginsPublic2068_maf_geno_ldprune.meta&quot;, sep=&quot; &quot;, header=T)

# setup loadings data.frame
l_df = as.data.frame(flash_fit$loadings$normalized.loadings[[1]])
l_df$iid = as.vector(meta_df$iid) # individual ids
l_df$clst = meta_df$clst # population labels

# join with the meta data
l_df = l_df %&gt;% inner_join(meta_df, on=&quot;clst&quot;)
l_df = l_df %&gt;% arrange(region, clst) # sort by region then by population
l_df$iid = factor(l_df$iid, levels = l_df$iid) # make sure the ids are sorted
colnames(l_df)[1:K] = 1:K

# gather the data.frame for plotting
l_gath_df = l_df %&gt;% 
            gather(K, value, -iid, -clst, -region, -country, -lat, -lon, -clst2) %&gt;% 
            filter(K!=1)

############### viz ############### 
pops = unique(l_df$clst)

# Africa
africa_pops = get_pops(meta_df, &quot;Africa&quot;)
p_africa = positive_structure_plot(l_gath_df %&gt;% filter(region == &quot;Africa&quot;), africa_pops, K, label_size=5)

# America
america_pops = get_pops(meta_df, &quot;America&quot;)
p_america = positive_structure_plot(l_gath_df %&gt;% filter(region == &quot;America&quot;), america_pops, K, label_size=5) 

# Central Asia Siberia
central_asia_siberia_pops = get_pops(meta_df, &quot;CentralAsiaSiberia&quot;)
p_central_asia_siberia = positive_structure_plot(l_gath_df %&gt;% filter(region == &quot;CentralAsiaSiberia&quot;), central_asia_siberia_pops, K, label_size=5)

# East Asia
east_asia_pops = get_pops(meta_df, &quot;EastAsia&quot;)
p_east_asia = positive_structure_plot(l_gath_df %&gt;% filter(region == &quot;EastAsia&quot;), east_asia_pops, K, label_size=5)

# South Asia
south_asia_pops = get_pops(meta_df, &quot;SouthAsia&quot;)
p_south_asia= positive_structure_plot(l_gath_df %&gt;% filter(region == &quot;SouthAsia&quot;), south_asia_pops, K, label_size=5)

# West Eurasia
west_eurasia_pops = get_pops(meta_df, &quot;WestEurasia&quot;)
p_west_eurasia = positive_structure_plot(l_gath_df %&gt;% filter(region == &quot;WestEurasia&quot;), west_eurasia_pops, K, label_size=5)

# Oceania
oceania_pops = get_pops(meta_df, &quot;Oceania&quot;)
p_oceania = positive_structure_plot(l_gath_df %&gt;% filter(region == &quot;Oceania&quot;), oceania_pops, K, label_size=5) 

p = cowplot::plot_grid(p_africa, p_west_eurasia, p_central_asia_siberia, p_america, p_east_asia, p_south_asia, p_oceania, 
                       rel_heights = c(1.2, 1.3, 1, 1, 1, 1, 1.1),
                       nrow = 7, align = &quot;v&quot;) 
p</code></pre>
<p><img src="figure/hoa_global.Rmd/flash-greedy-ld-viz-loadings-1.png" width="816" style="display: block; margin: auto;" /></p>
<details>
<summary><em>
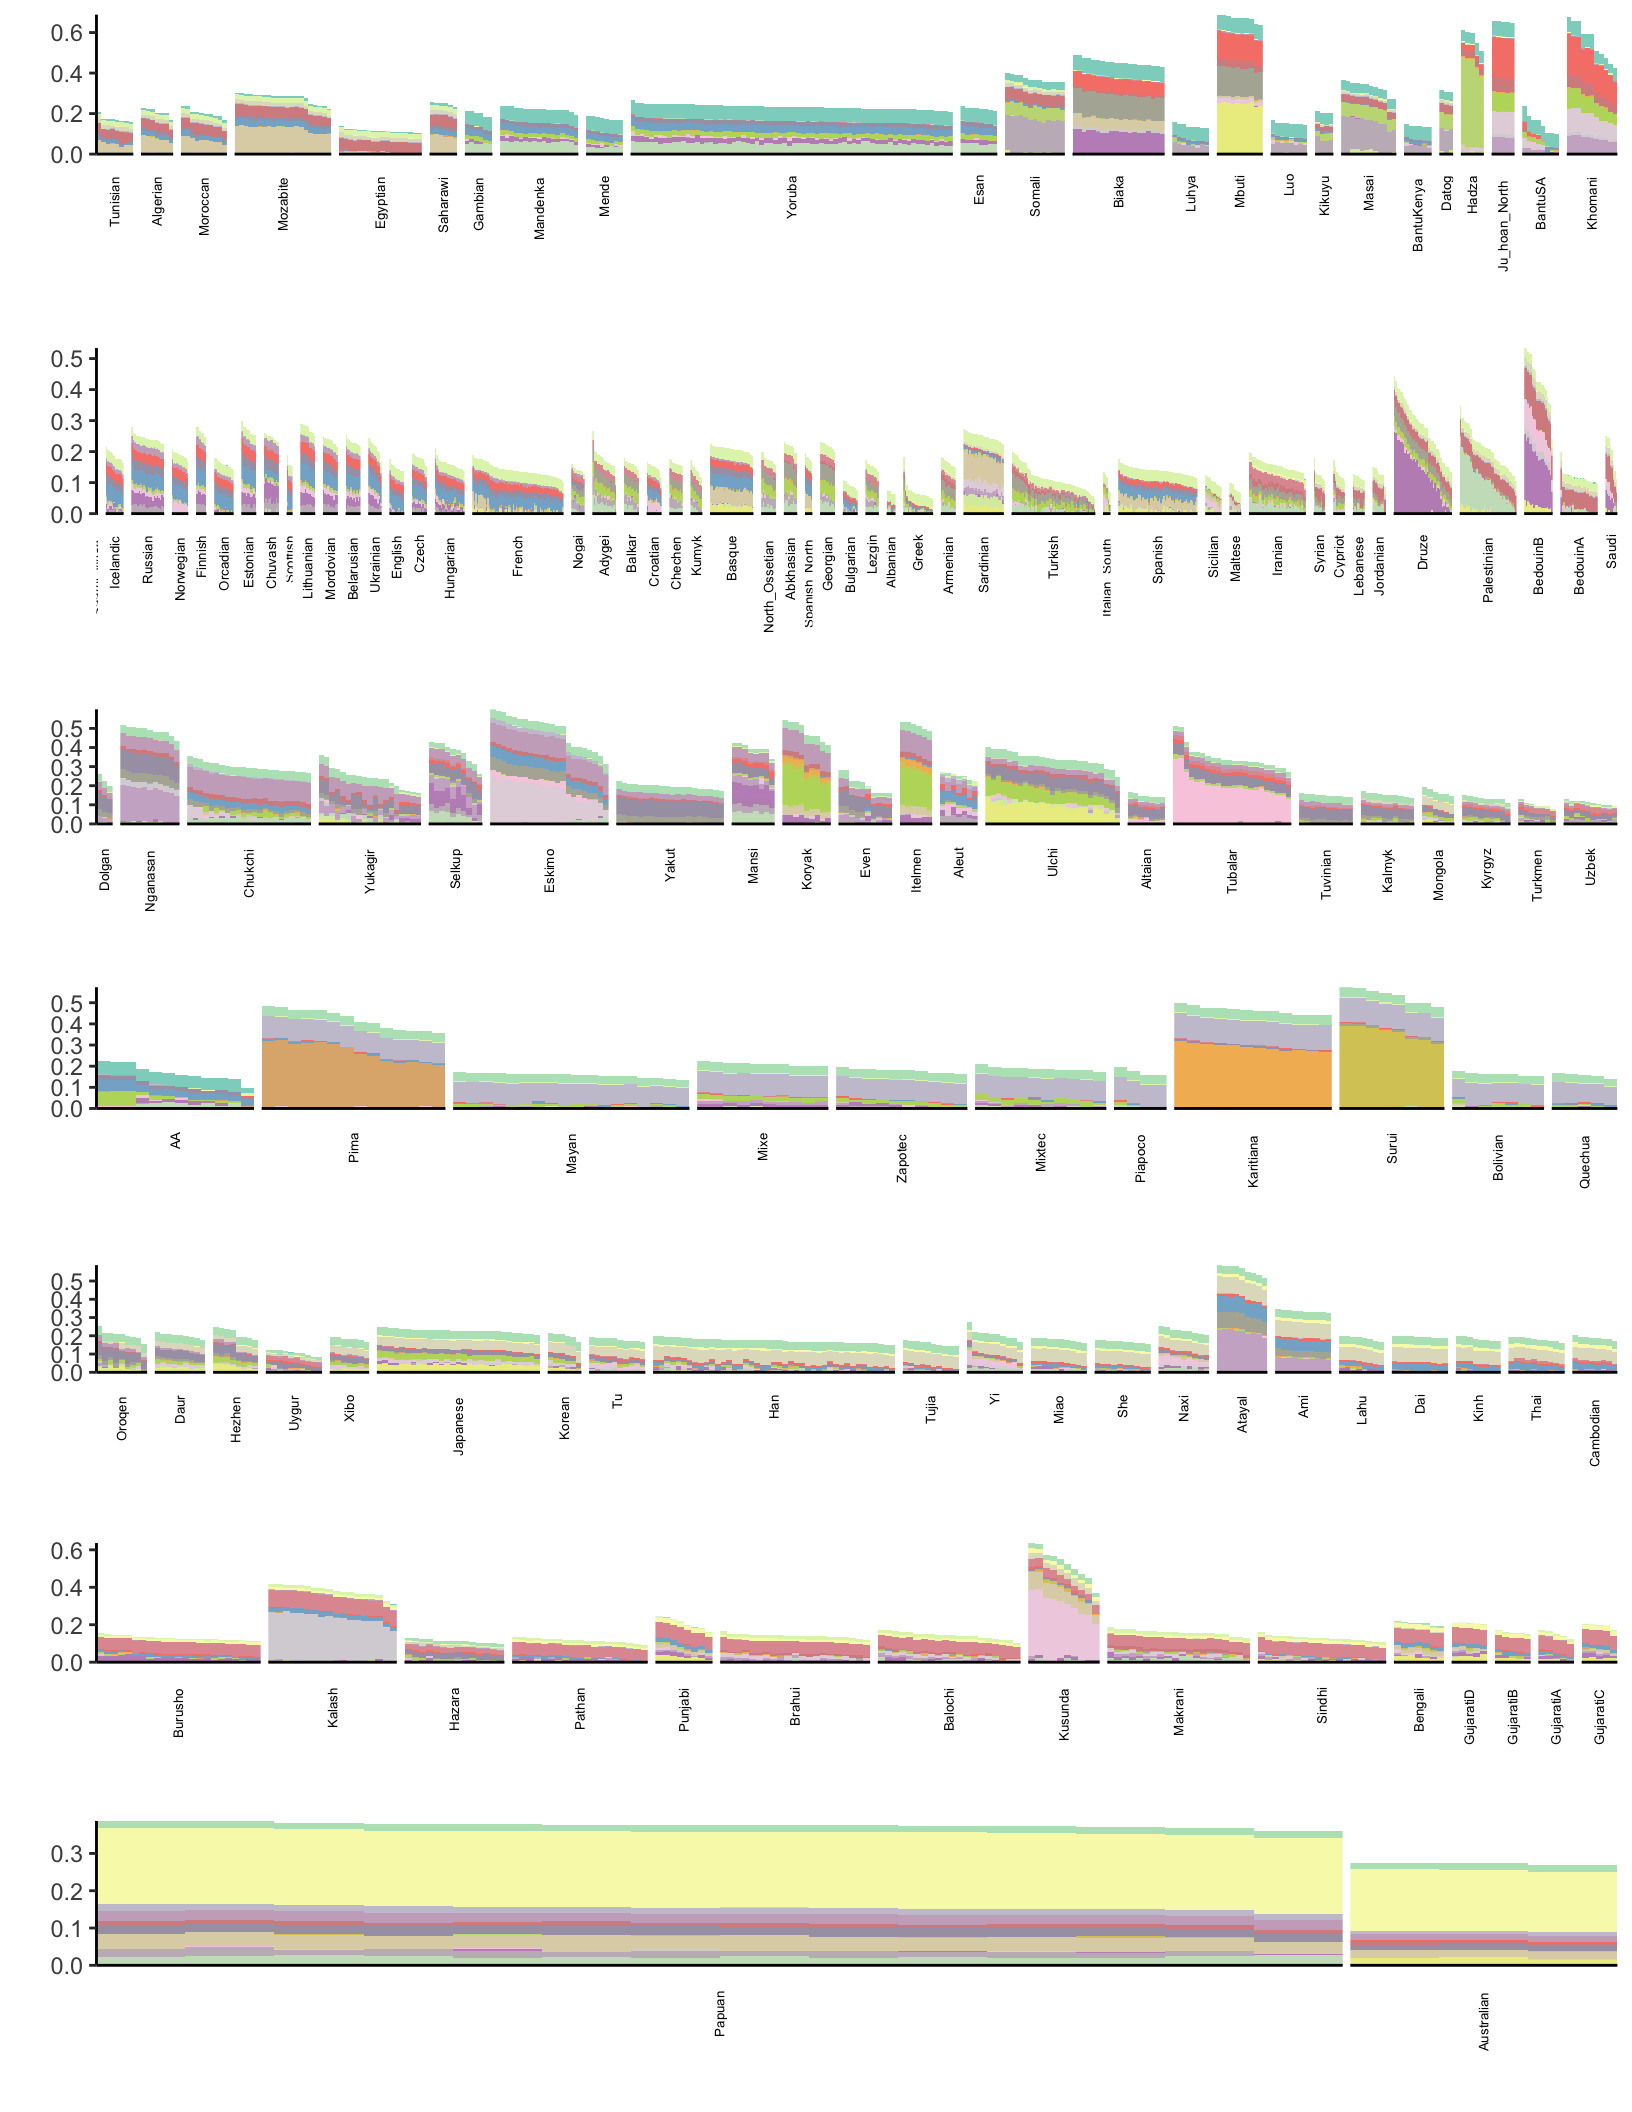
Expand here to see past versions of flash-greedy-ld-viz-loadings-1.png:</em></summary>
<table style = "border-collapse:separate; border-spacing:5px;">
<thead>
<tr>
<th style="text-align:left;">
Version
</th>
<th style="text-align:left;">
Author
</th>
<th style="text-align:left;">
Date
</th>
</tr>
</thead>
<tbody>
<tr>
<td style="text-align:left;">
<a href="https://github.com/jhmarcus/drift-workflow/blob/f5ef1af4d17d9469ed52811c88166186d0c3c993/docs/figure/hoa_global.Rmd/flash-greedy-ld-viz-loadings-1.png" target="_blank">f5ef1af</a>
</td>
<td style="text-align:left;">
jhmarcus
</td>
<td style="text-align:left;">
2019-02-15
</td>
</tr>
</tbody>
</table>
</details>
</div>
<div id="backfitting" class="section level3">
<h3>Backfitting</h3>
<p>Lets first read the backfit <code>flashier</code> fit</p>
<pre class="r"><code>flash_fit = readRDS(&quot;../output/flash_backfit/hoa_global_ld/HumanOriginsPublic2068_maf_geno_ldprune.rds&quot;)
K = ncol(flash_fit$loadings$normalized.loadings[[1]]) 
n = nrow(flash_fit$loadings$normalized.loadings[[1]])
p = nrow(flash_fit$loadings$normalized.loadings[[2]])
print(K)</code></pre>
<pre><code>[1] 31</code></pre>
<pre class="r"><code>print(n)</code></pre>
<pre><code>[1] 2068</code></pre>
<pre class="r"><code>print(p)</code></pre>
<pre><code>[1] 167178</code></pre>
<p>Lets now plot the distribution of factors for each drift event</p>
<pre class="r"><code># read factors
delta_df = as.data.frame(flash_fit$loadings$normalized.loadings[[2]])
colnames(delta_df)[1:K] = 1:K 

# gather the data.frame for plotting
delta_gath_df = delta_df %&gt;% 
                gather(K, value) %&gt;%
                filter(K!=1)

# plot the factors
K_ = K
p_fct = ggplot(delta_gath_df, aes(x=value, fill=factor(K, 2:K_))) + 
        scale_fill_manual(values = getPalette(K_)) +
        geom_histogram() + 
        facet_wrap(~factor(K, levels=2:K_), scales = &quot;free&quot;) + 
        labs(fill=&quot;K&quot;) + 
        scale_x_continuous(breaks = scales::pretty_breaks(n = 3)) +
        scale_y_continuous(breaks = scales::pretty_breaks(n = 3)) + 
        theme_bw()
p_fct</code></pre>
<p><img src="figure/hoa_global.Rmd/flash-backfit-ld-viz-factors-1.png" width="768" style="display: block; margin: auto;" /></p>
<details>
<summary><em>
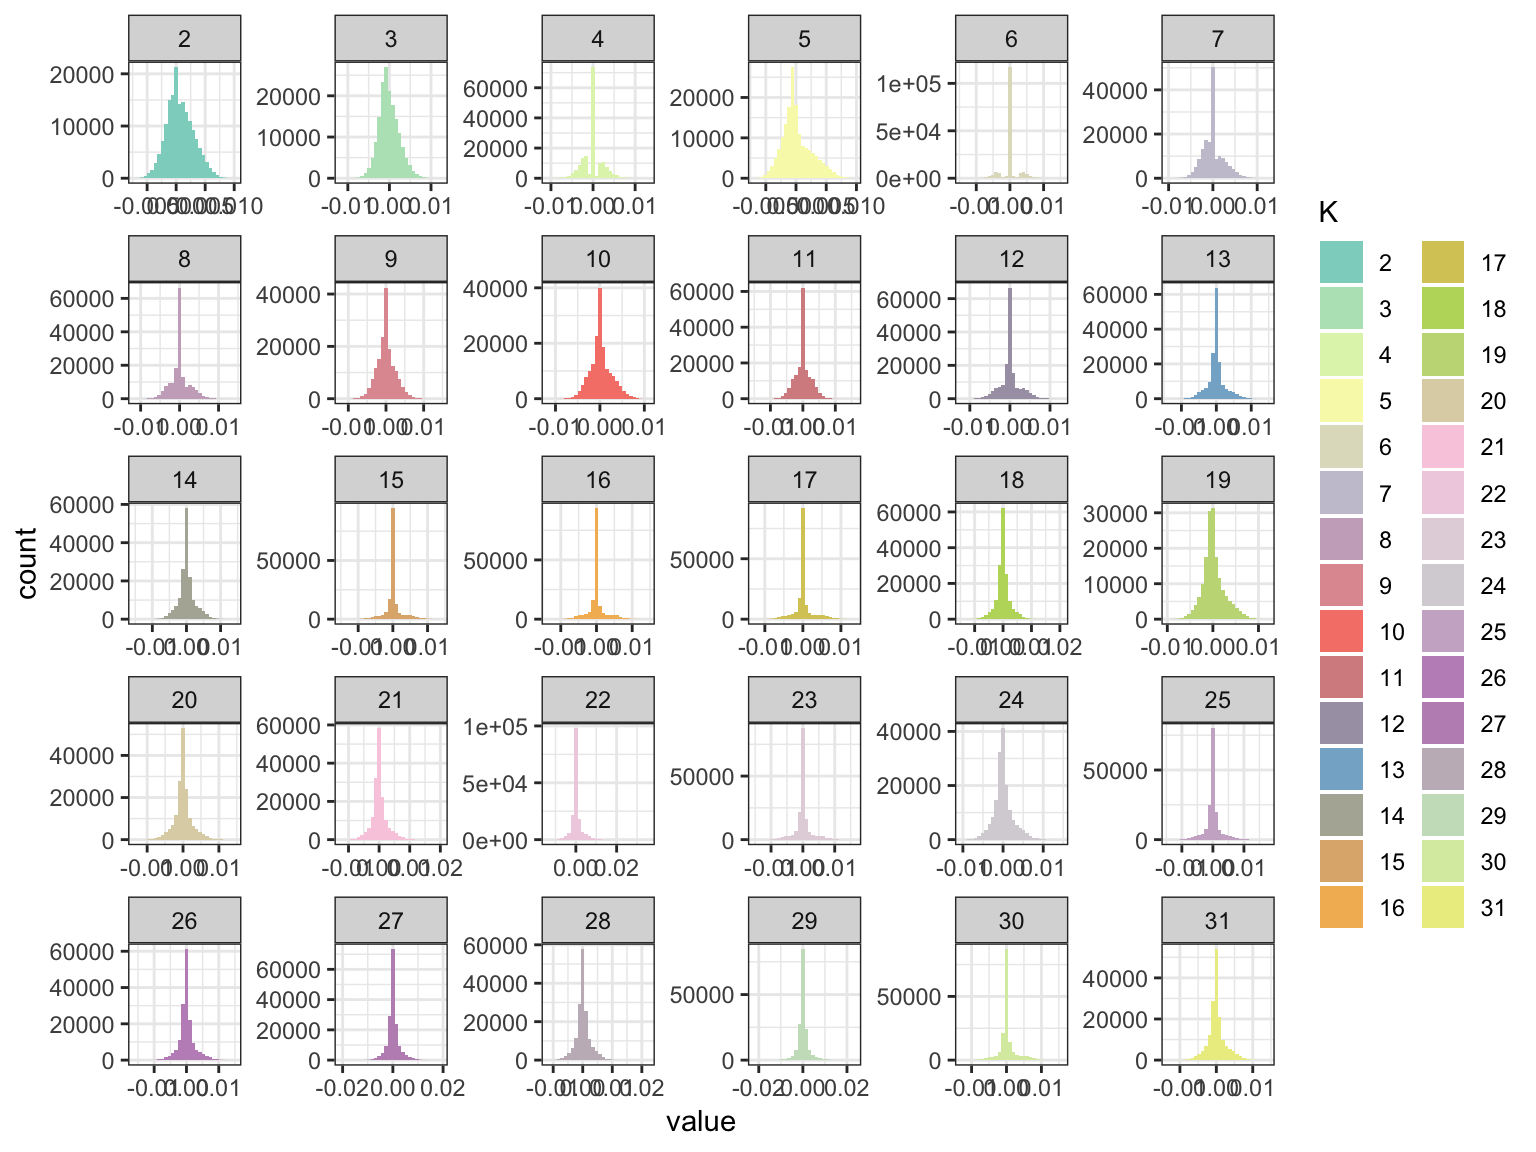
Expand here to see past versions of flash-backfit-ld-viz-factors-1.png:</em></summary>
<table style = "border-collapse:separate; border-spacing:5px;">
<thead>
<tr>
<th style="text-align:left;">
Version
</th>
<th style="text-align:left;">
Author
</th>
<th style="text-align:left;">
Date
</th>
</tr>
</thead>
<tbody>
<tr>
<td style="text-align:left;">
<a href="https://github.com/jhmarcus/drift-workflow/blob/7a2b6c7d6a6827a391b617d74eb09098b1873a9a/docs/figure/hoa_global.Rmd/flash-backfit-ld-viz-factors-1.png" target="_blank">7a2b6c7</a>
</td>
<td style="text-align:left;">
jhmarcus
</td>
<td style="text-align:left;">
2019-02-15
</td>
</tr>
</tbody>
</table>
</details>
<p>Some of the drift event histograms look quite odd i.e. see 4 and 6. Lets now take a look at the loadings:</p>
<pre class="r"><code>############### data ############### 

# read the meta data
meta_df = read.table(&quot;../data/meta/HumanOriginsPublic2068_maf_geno_ldprune.meta&quot;, sep=&quot; &quot;, header=T)

# setup loadings data.frame
l_df = as.data.frame(flash_fit$loadings$normalized.loadings[[1]])
l_df$iid = as.vector(meta_df$iid) # individual ids
l_df$clst = meta_df$clst # population labels

# join with the meta data
l_df = l_df %&gt;% inner_join(meta_df, on=&quot;clst&quot;)
l_df = l_df %&gt;% arrange(region, clst) # sort by region then by population
l_df$iid = factor(l_df$iid, levels = l_df$iid) # make sure the ids are sorted
colnames(l_df)[1:K] = 1:K

# gather the data.frame for plotting
l_gath_df = l_df %&gt;% 
            gather(K, value, -iid, -clst, -region, -country, -lat, -lon, -clst2) %&gt;% 
            filter(K!=1)

############### viz ############### 
pops = unique(l_df$clst)

# Africa
africa_pops = get_pops(meta_df, &quot;Africa&quot;)
p_africa = positive_structure_plot(l_gath_df %&gt;% filter(region == &quot;Africa&quot;), africa_pops, K, label_size=5)

# America
america_pops = get_pops(meta_df, &quot;America&quot;)
p_america = positive_structure_plot(l_gath_df %&gt;% filter(region == &quot;America&quot;), america_pops, K, label_size=5) 

# Central Asia Siberia
central_asia_siberia_pops = get_pops(meta_df, &quot;CentralAsiaSiberia&quot;)
p_central_asia_siberia = positive_structure_plot(l_gath_df %&gt;% filter(region == &quot;CentralAsiaSiberia&quot;), central_asia_siberia_pops, K, label_size=5)

# East Asia
east_asia_pops = get_pops(meta_df, &quot;EastAsia&quot;)
p_east_asia = positive_structure_plot(l_gath_df %&gt;% filter(region == &quot;EastAsia&quot;), east_asia_pops, K, label_size=5)

# South Asia
south_asia_pops = get_pops(meta_df, &quot;SouthAsia&quot;)
p_south_asia= positive_structure_plot(l_gath_df %&gt;% filter(region == &quot;SouthAsia&quot;), south_asia_pops, K, label_size=5)

# West Eurasia
west_eurasia_pops = get_pops(meta_df, &quot;WestEurasia&quot;)
p_west_eurasia = positive_structure_plot(l_gath_df %&gt;% filter(region == &quot;WestEurasia&quot;), west_eurasia_pops, K, label_size=5)

# Oceania
oceania_pops = get_pops(meta_df, &quot;Oceania&quot;)
p_oceania = positive_structure_plot(l_gath_df %&gt;% filter(region == &quot;Oceania&quot;), oceania_pops, K, label_size=5) 

p = cowplot::plot_grid(p_africa, p_west_eurasia, p_central_asia_siberia, p_america, p_east_asia, p_south_asia, p_oceania, 
                       rel_heights = c(1.2, 1.3, 1, 1, 1, 1, 1.1),
                       nrow = 7, align = &quot;v&quot;) 
p</code></pre>
<p><img src="figure/hoa_global.Rmd/flash-backfit-ld-viz-loadings-1.png" width="816" style="display: block; margin: auto;" /></p>
<details>
<summary><em>
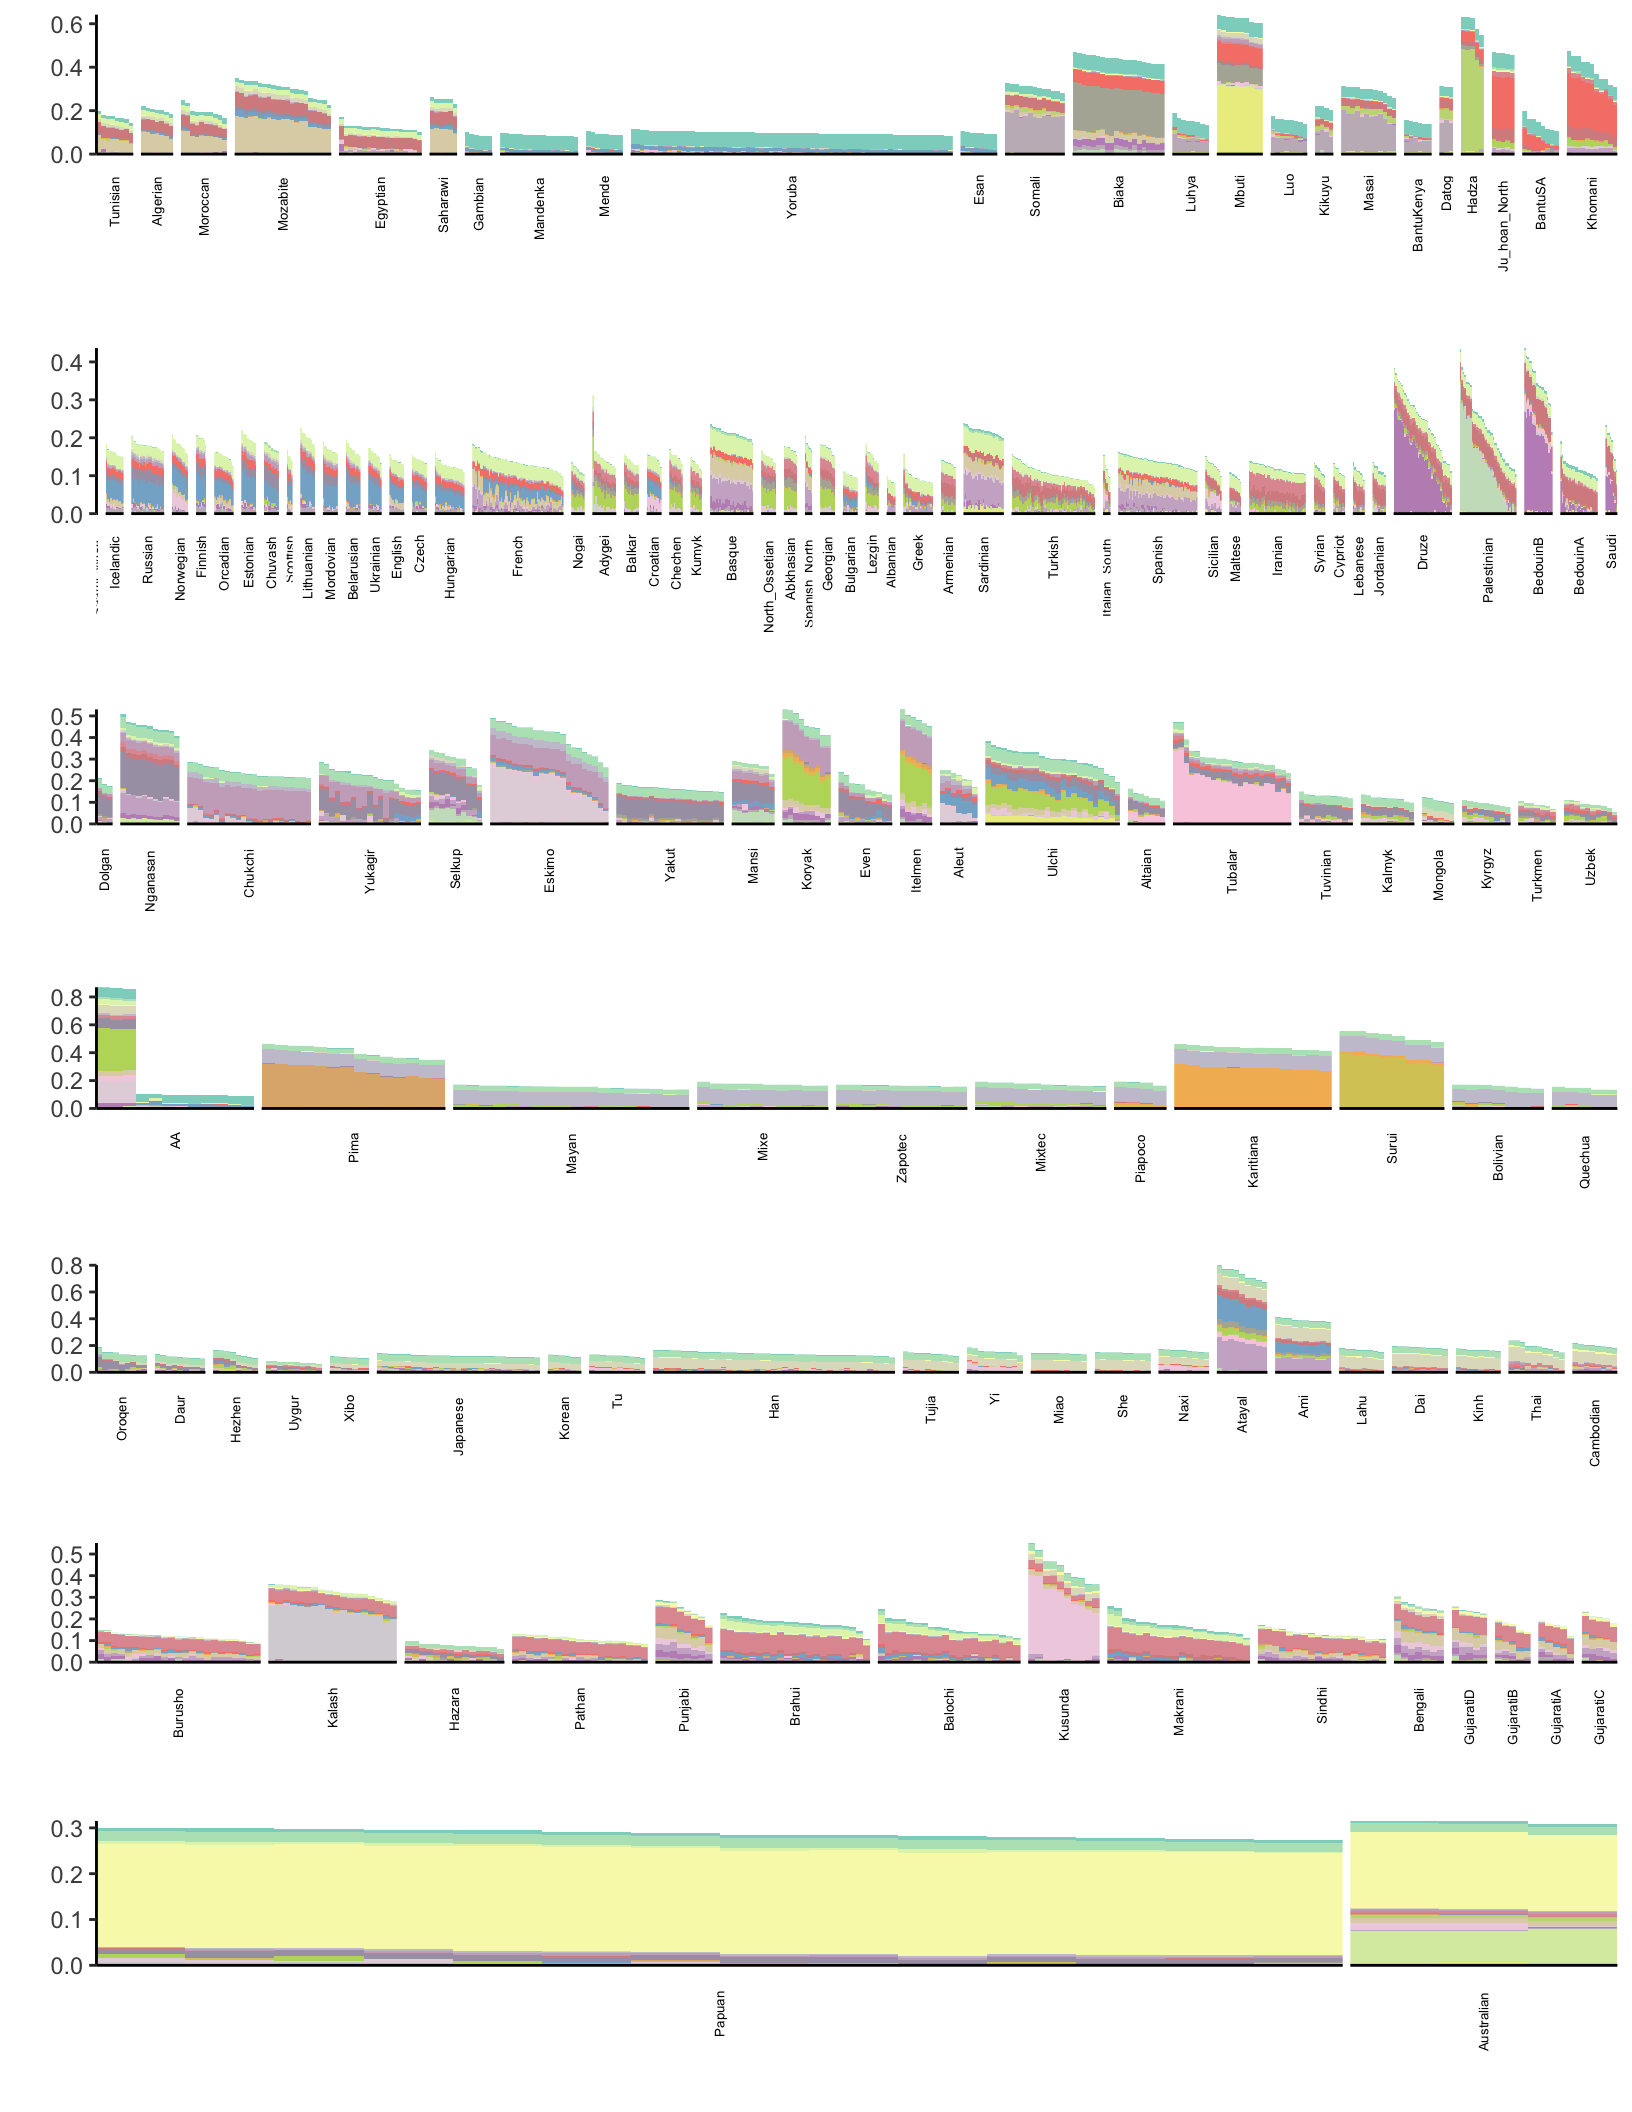
Expand here to see past versions of flash-backfit-ld-viz-loadings-1.png:</em></summary>
<table style = "border-collapse:separate; border-spacing:5px;">
<thead>
<tr>
<th style="text-align:left;">
Version
</th>
<th style="text-align:left;">
Author
</th>
<th style="text-align:left;">
Date
</th>
</tr>
</thead>
<tbody>
<tr>
<td style="text-align:left;">
<a href="https://github.com/jhmarcus/drift-workflow/blob/7a2b6c7d6a6827a391b617d74eb09098b1873a9a/docs/figure/hoa_global.Rmd/flash-backfit-ld-viz-loadings-1.png" target="_blank">7a2b6c7</a>
</td>
<td style="text-align:left;">
jhmarcus
</td>
<td style="text-align:left;">
2019-02-15
</td>
</tr>
</tbody>
</table>
</details>
<p>Its hard to visually tell the difference with so many events.</p>
</div>
</div>
<div id="session-information" class="section level2">
<h2>Session information</h2>
<pre class="r"><code>sessionInfo()</code></pre>
<pre><code>R version 3.5.1 (2018-07-02)
Platform: x86_64-apple-darwin13.4.0 (64-bit)
Running under: macOS  10.14.2

Matrix products: default
BLAS/LAPACK: /Users/jhmarcus/miniconda3/lib/R/lib/libRblas.dylib

locale:
[1] en_US.UTF-8/en_US.UTF-8/en_US.UTF-8/C/en_US.UTF-8/en_US.UTF-8

attached base packages:
[1] stats     graphics  grDevices utils     datasets  methods   base     

other attached packages:
[1] bindrcpp_0.2.2     RColorBrewer_1.1-2 dplyr_0.7.6       
[4] tidyr_0.8.1        ggplot2_3.0.0     

loaded via a namespace (and not attached):
 [1] Rcpp_1.0.0        compiler_3.5.1    pillar_1.3.0     
 [4] git2r_0.23.0      plyr_1.8.4        workflowr_1.1.1  
 [7] bindr_0.1.1       R.methodsS3_1.7.1 R.utils_2.7.0    
[10] tools_3.5.1       digest_0.6.18     evaluate_0.12    
[13] tibble_1.4.2      gtable_0.2.0      pkgconfig_2.0.1  
[16] rlang_0.3.1       yaml_2.2.0        xfun_0.4         
[19] flashier_0.1.0    withr_2.1.2       stringr_1.3.1    
[22] knitr_1.21        cowplot_0.9.4     rprojroot_1.3-2  
[25] grid_3.5.1        tidyselect_0.2.4  glue_1.3.0       
[28] R6_2.3.0          rmarkdown_1.11    reshape2_1.4.3   
[31] purrr_0.2.5       magrittr_1.5      whisker_0.3-2    
[34] backports_1.1.2   scales_0.5.0      htmltools_0.3.6  
[37] assertthat_0.2.0  colorspace_1.3-2  labeling_0.3     
[40] stringi_1.2.4     lazyeval_0.2.1    munsell_0.5.0    
[43] crayon_1.3.4      R.oo_1.22.0      </code></pre>
</div>

<!-- Adjust MathJax settings so that all math formulae are shown using
TeX fonts only; see
http://docs.mathjax.org/en/latest/configuration.html.  This will make
the presentation more consistent at the cost of the webpage sometimes
taking slightly longer to load. Note that this only works because the
footer is added to webpages before the MathJax javascript. -->
<script type="text/x-mathjax-config">
  MathJax.Hub.Config({
    "HTML-CSS": { availableFonts: ["TeX"] }
  });
</script>

<hr>
<p>
  This reproducible <a href="http://rmarkdown.rstudio.com">R Markdown</a>
  analysis was created with
  <a href="https://github.com/jdblischak/workflowr">workflowr</a> 1.1.1
</p>
<hr>


</div>
</div>

</div>

<script>

// add bootstrap table styles to pandoc tables
function bootstrapStylePandocTables() {
  $('tr.header').parent('thead').parent('table').addClass('table table-condensed');
}
$(document).ready(function () {
  bootstrapStylePandocTables();
});


</script>

<!-- dynamically load mathjax for compatibility with self-contained -->
<script>
  (function () {
    var script = document.createElement("script");
    script.type = "text/javascript";
    script.src  = "https://mathjax.rstudio.com/latest/MathJax.js?config=TeX-AMS-MML_HTMLorMML";
    document.getElementsByTagName("head")[0].appendChild(script);
  })();
</script>

</body>
</html>