Predicting cell times for individuals
Joyce Hsiao
Last updated: 2018-07-18
Code version: 91067ec
Pipeline
Split data to validation samples and training samples.
- The split samples are saved as
data/ind_XX_withheld.rdsanddata/ind_XX_training.rds.
- The code used to generated teh split samples is saved in
code/working/makedata_supervised.R.
- The split samples are saved as
In the training sample, repeat the following 5 times. Each time, take samples from 4 individuals, fit trendfilter and identified the top X cyclical genes, and the compute the error in predicting cell time of the held-out individual, as a function of the top X cyclical genes.
code/run_methods.R: runs all methods, including supervised, unsupervised trendfilter, unsupervised bspline, unsupervised lowess, seurat) and compute prediction error margin.
code/working/job_run_methods.train.ind.Rcallscode/run_methods.Rcode/working/job_run_methods.train.ind.sbatchsubmits jobs one fold at a time.
Based on the training sample results, select the top best X genes and fit to the validation sample. Compute and compare the methods’ performance on the validation sample.
Top X cyclical genes
time based on fucci only
# observed data
library(gplots)
inds <- c("NA19098", "NA18511", "NA18870", "NA19101", "NA18855", "NA19160")
ngenes <- c(5, seq(10, 11040, 10))
for (j in 1:length(inds)) {
  ind <- inds[j]
  gene_names <- rownames(readRDS(paste0("../data/results/ind_",ind,"_data_training_cyclical_genes.fold.",
                   1,".rds")))
  genes_list <- lapply(1:length(ngenes), function(i) {
    ngene <- ngenes[i]
    tmp <- do.call(cbind, lapply(1:5, function(fold) {
      fl_name <- paste0("../data/results/ind_",ind,"_data_training_cyclical_genes.fold.",
                   fold,".rds")
      df <- readRDS(fl_name)
      top_list <- rownames(df)[order(df$pve,decreasing = T)[1:ngene]]
      rownames(df) %in% top_list
    }) )
    rownames(tmp) <- gene_names
    return(rownames(tmp)[rowSums(tmp)>=4])
  })
  names(genes_list) <- ngenes
  saveRDS(genes_list,
          file = paste0("../data/results/ind_",ind,"_results_topgenes.rds"))
}


ind_NA19098_topgenes <- readRDS("../data/results/ind_NA19098_results_topgenes.rds")
ind_NA18511_topgenes <- readRDS("../data/results/ind_NA18511_results_topgenes.rds")
ind_NA18870_topgenes <- readRDS("../data/results/ind_NA18870_results_topgenes.rds")
ind_NA19101_topgenes <- readRDS("../data/results/ind_NA19101_results_topgenes.rds")
ind_NA18855_topgenes <- readRDS("../data/results/ind_NA18855_results_topgenes.rds")
ind_NA19160_topgenes <- readRDS("../data/results/ind_NA19160_results_topgenes.rds")

topgenes_list <- list(ind_NA19098_topgenes, ind_NA18511_topgenes, ind_NA18870_topgenes,
                      ind_NA19101_topgenes, ind_NA18855_topgenes, ind_NA19160_topgenes)
library(dplyr)
topgenes_combined <- lapply(1:length(ind_NA19160_topgenes), function(i) {
  ll <- lapply(topgenes_list, "[[", i)
  ll <- unlist(ll)
  tab <- table(ll)
  names(tab)[which(tab>=4)]
})
names(topgenes_combined) <- names(ind_NA19160_topgenes)

saveRDS(topgenes_combined, file="../data/results/ind_results_topgenes.rds")
time based on fucci and dapi only
# observed data
library(gplots)
inds <- c("NA19098", "NA18511", "NA18870", "NA19101", "NA18855", "NA19160")
ngenes <- c(5, seq(10, 11040, 10))
for (j in 1:length(inds)) {
  ind <- inds[j]
  gene_names <- rownames(readRDS(paste0("../data/results/triple_ind_",ind,
                                        "_data_training_cyclical_genes.fold.",
                   1,".rds")))
  genes_list <- lapply(1:length(ngenes), function(i) {
    ngene <- ngenes[i]
    tmp <- do.call(cbind, lapply(1:5, function(fold) {
      fl_name <- paste0("../data/results/triple_ind_",ind,
                        "_data_training_cyclical_genes.fold.",
                   fold,".rds")
      df <- readRDS(fl_name)
      top_list <- rownames(df)[order(df$pve,decreasing = T)[1:ngene]]
      rownames(df) %in% top_list
    }) )
    rownames(tmp) <- gene_names
    return(rownames(tmp)[rowSums(tmp)>=4])
  })
  names(genes_list) <- ngenes
  saveRDS(genes_list,
          file = paste0("../data/results/ind_",ind,"_results_topgenes_triple.rds"))
}


ind_NA19098_topgenes <- readRDS("../data/results/ind_NA19098_results_topgenes_triple.rds")
ind_NA18511_topgenes <- readRDS("../data/results/ind_NA18511_results_topgenes_triple.rds")
ind_NA18870_topgenes <- readRDS("../data/results/ind_NA18870_results_topgenes_triple.rds")
ind_NA19101_topgenes <- readRDS("../data/results/ind_NA19101_results_topgenes_triple.rds")
ind_NA18855_topgenes <- readRDS("../data/results/ind_NA18855_results_topgenes_triple.rds")
ind_NA19160_topgenes <- readRDS("../data/results/ind_NA19160_results_topgenes_triple.rds")

topgenes_list <- list(ind_NA19098_topgenes, ind_NA18511_topgenes, ind_NA18870_topgenes,
                      ind_NA19101_topgenes, ind_NA18855_topgenes, ind_NA19160_topgenes)
library(dplyr)
topgenes_combined <- lapply(1:length(ind_NA19160_topgenes), function(i) {
  ll <- lapply(topgenes_list, "[[", i)
  ll <- unlist(ll)
  tab <- table(ll)
  names(tab)[which(tab>=4)]
})
names(topgenes_combined) <- names(ind_NA19160_topgenes)

saveRDS(topgenes_combined, file="../data/results/ind_results_topgenes_triple.rds")
Compare number of genes selected at Top X cyclical genes.
topgenes_double <- readRDS(file="../data/results/ind_results_topgenes.rds")
topgenes_triple <- readRDS(file="../data/results/ind_results_topgenes_triple.rds")

topgenes_overlap <- sapply(1:length(topgenes_double), function(i) {
 intersect(topgenes_double[[i]], topgenes_triple[[i]])
})
names(topgenes_overlap) <- names(topgenes_double)

plot(names(topgenes_double)[1:21],
     sapply(topgenes_double, length)[1:21],
     xlab="Top X cyclical genes", pch=16, col=1, cex=.7,
     ylim=c(0,60),
     ylab="Selected genes",
     main = "Number of selected genes")
points(names(topgenes_double)[1:21],
     sapply(topgenes_triple, length)[1:21], col="blue", pch=16, cex=.7)
points(names(topgenes_double)[1:21],
     sapply(topgenes_overlap, length)[1:21], col="1", pch=1, cex=.7)
legend("topleft", legend=c("double", "triple", "both"),
       col=c("black", "blue", "black"), pch=c(16, 16, 1))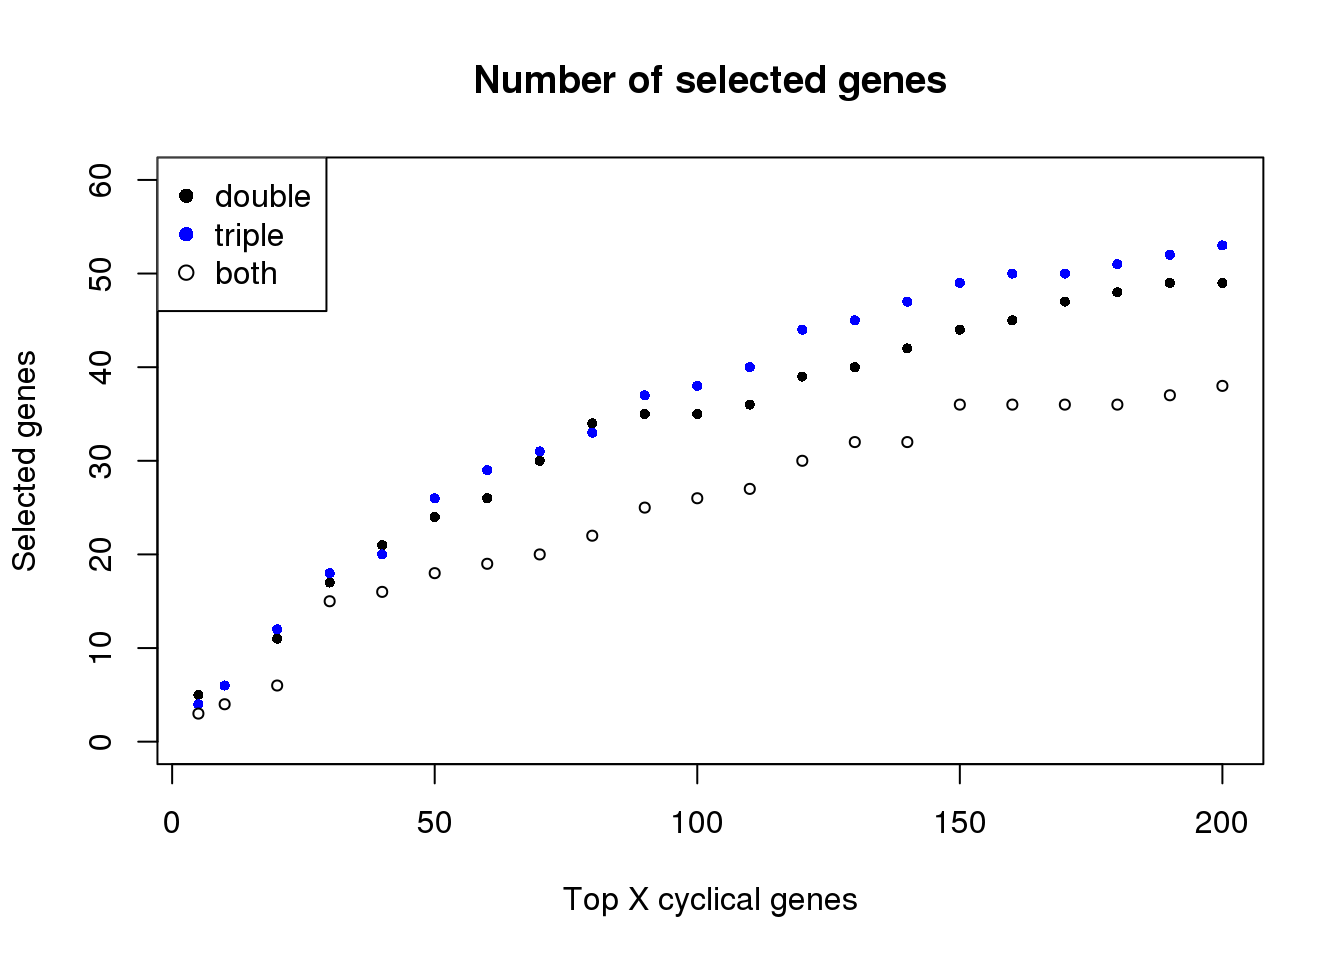
Prediction error
summarize results
diff_time_wrapper <- function(results_list) {

  methods_list <- sapply(names(results_list),
                         function(x) strsplit(x, split=".", fixed=TRUE)[[1]][2])

  diff_time_list <- do.call(rbind, lapply(1:length(results_list), function(i) {
    diff_time <- results_list[[i]]$diff_time
    diff_mean <- mean(diff_time/2/pi)
#    diff_se <- sd(diff_time/2/pi)/sqrt(ncol(results_list[[1]]$Y))

    return(data.frame(diff_mean=diff_mean,
#                      diff_se=diff_se,
                      methods=methods_list[i]))
  }) )
  return(diff_time_list)
}


library(gplots)
ngenes <- c(5, seq(10,200, by=10))
inds <- c("NA19098", "NA18511", "NA18870", "NA19101", "NA18855", "NA19160")
train_top <- lapply(1:length(inds), function(j) {
  ind <- inds[j]
  out <- do.call(rbind, lapply(1:length(ngenes), function(i) {
    ngene <- ngenes[i]
    train_topX <- do.call(rbind, lapply(1:5, function(fold) {
      # print(ind)
      # print(ngene)
      # print(fold)
      fl_name <- paste0("../data/results/ind_",ind,"_results_train.fold.",fold,
                        ".top",ngene,".rds")
      df <- readRDS(fl_name)
      out <- diff_time_wrapper(df$fit.test)
      out$fold <- fold
      return(out)
    }) )
    train_topX$ngenes <- ngene
    #return(train_topX)
    agg_mn <- aggregate(diff_mean ~ methods,
                      data=train_topX, FUN=mean)
    agg_sd <- aggregate(diff_mean ~ methods,
                      data=train_topX, FUN=sd)

    obj <- data.frame(methods=agg_mn$methods,
                      diff_mean=agg_mn$diff_mean,
                      diff_se=agg_sd$diff_mean/sqrt(5))
    obj$ngenes <- ngene
    return(obj)
  }) )
  out$ind <- ind
  return(out)
})
names(train_top) <- inds
saveRDS(train_top, file = "../output/method-train-ind.Rmd/diff_time_all.rds")


ngenes <- c(5, seq(10,200, by=10))
inds <- c("NA19098", "NA18511", "NA18870", "NA19101", "NA18855", "NA19160")
train_triple <- lapply(1:length(inds), function(j) {
  ind <- inds[j]
  out <- do.call(rbind, lapply(1:length(ngenes), function(i) {
    ngene <- ngenes[i]
    train_topX <- do.call(rbind, lapply(1:5, function(fold) {
      # print(ind)
      # print(ngene)
      # print(fold)
      fl_name <- paste0("../data/results/triple_ind_",ind,"_results_train.fold.",fold,
                        ".top",ngene,".rds")
      df <- readRDS(fl_name)
      out <- diff_time_wrapper(df$fit.test)
      out$fold <- fold
      return(out)
    }) )
    train_topX$ngenes <- ngene
    #return(train_topX)
    agg_mn <- aggregate(diff_mean ~ methods,
                      data=train_topX, FUN=mean)
    agg_sd <- aggregate(diff_mean ~ methods,
                      data=train_topX, FUN=sd)

    obj <- data.frame(methods=agg_mn$methods,
                      diff_mean=agg_mn$diff_mean,
                      diff_se=agg_sd$diff_mean/sqrt(5))
    obj$ngenes <- ngene
    return(obj)
  }) )
  out$ind <- ind
  return(out)
})
names(train_triple) <- inds
saveRDS(train_triple, file = "../output/method-train-ind.Rmd/diff_time_all_triple.rds")


# ngenes <- c(5, seq(10,200, by=10))
# train_top_permute <- do.call(rbind, lapply(1:length(ngenes), function(i) {
#   ngene <- ngenes[i]
#   train_topX <- do.call(rbind, lapply(1:5, function(fold) {
#     fl_name <- paste0("../data/results/results_train_permute_oncyclical.fold.",
#                       fold,".top",ngene,".rds")
#     df <- readRDS(fl_name)
#     out <- diff_time_wrapper(df$fit.test)
#     out$fold <- fold
#     return(out)
#   }) )
#   train_topX$ngenes <- ngene
#   #return(train_topX)
#   agg_mn <- aggregate(diff_mean ~ methods,
#                     data=train_topX, FUN=mean)
#   agg_sd <- aggregate(diff_mean ~ methods,
#                     data=train_topX, FUN=sd)
#
#   obj <- data.frame(methods=agg_mn$methods,
#                     diff_mean=agg_mn$diff_mean,
#                     diff_se=agg_sd$diff_mean/sqrt(5))
#   obj$ngenes <- ngene
#   return(obj)
# }) )
#
# saveRDS(train_top_permute,
#         file = "../output/method-train-classifiers-all.Rmd/diff_time_fucci_on_rando.rds")
Results
train_double <- readRDS("../output/method-train-ind.Rmd/diff_time_all.rds")
train_double <- do.call(rbind, train_double)
train_double <- subset(train_double, methods=="supervised")
train_double$ind <- as.factor(train_double$ind)

train_triple <- readRDS("../output/method-train-ind.Rmd/diff_time_all_triple.rds")
train_triple <- do.call(rbind, train_triple)
train_triple <- subset(train_triple, methods=="supervised")
train_triple$ind <- as.factor(train_triple$ind)
time based on fucci
library(ggplot2)
ggplot(train_double,
       aes(x=ngenes, y=diff_mean, col=ind)) +
  # geom_errorbar(train_top,
  #               mapping=aes(ymin=diff_mean-diff_se, ymax=diff_mean+diff_se,
  #                           col=ind)) +
  geom_point() + geom_line(lty=3) +
  ylab("Error margin (% arc length)") + xlab("Top X cyclical genes") +
  ggtitle("Prediction error in the training set") +
  ylim(0,.25)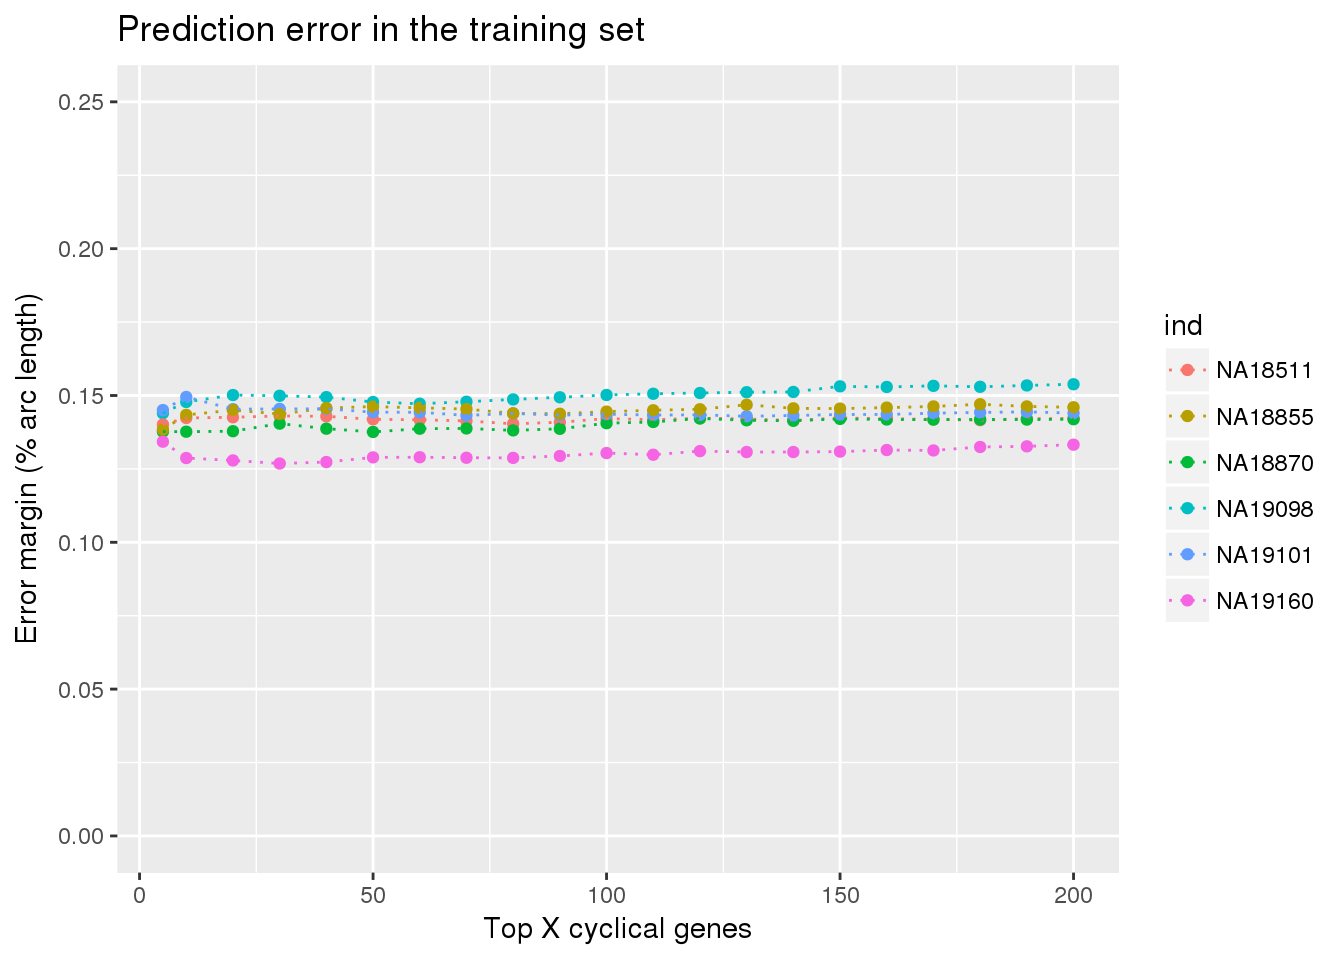
ggplot(train_double,
       aes(x=ngenes, y=diff_mean, col=ind)) +
  # geom_errorbar(train_top,
  #               mapping=aes(ymin=diff_mean-diff_se, ymax=diff_mean+diff_se,
  #                           col=ind)) +
  geom_point() + geom_line(lty=3) +
  ylab("Error margin (% arc length)") + xlab("Top X cyclical genes") +
ggtitle("Prediction error in the training set") 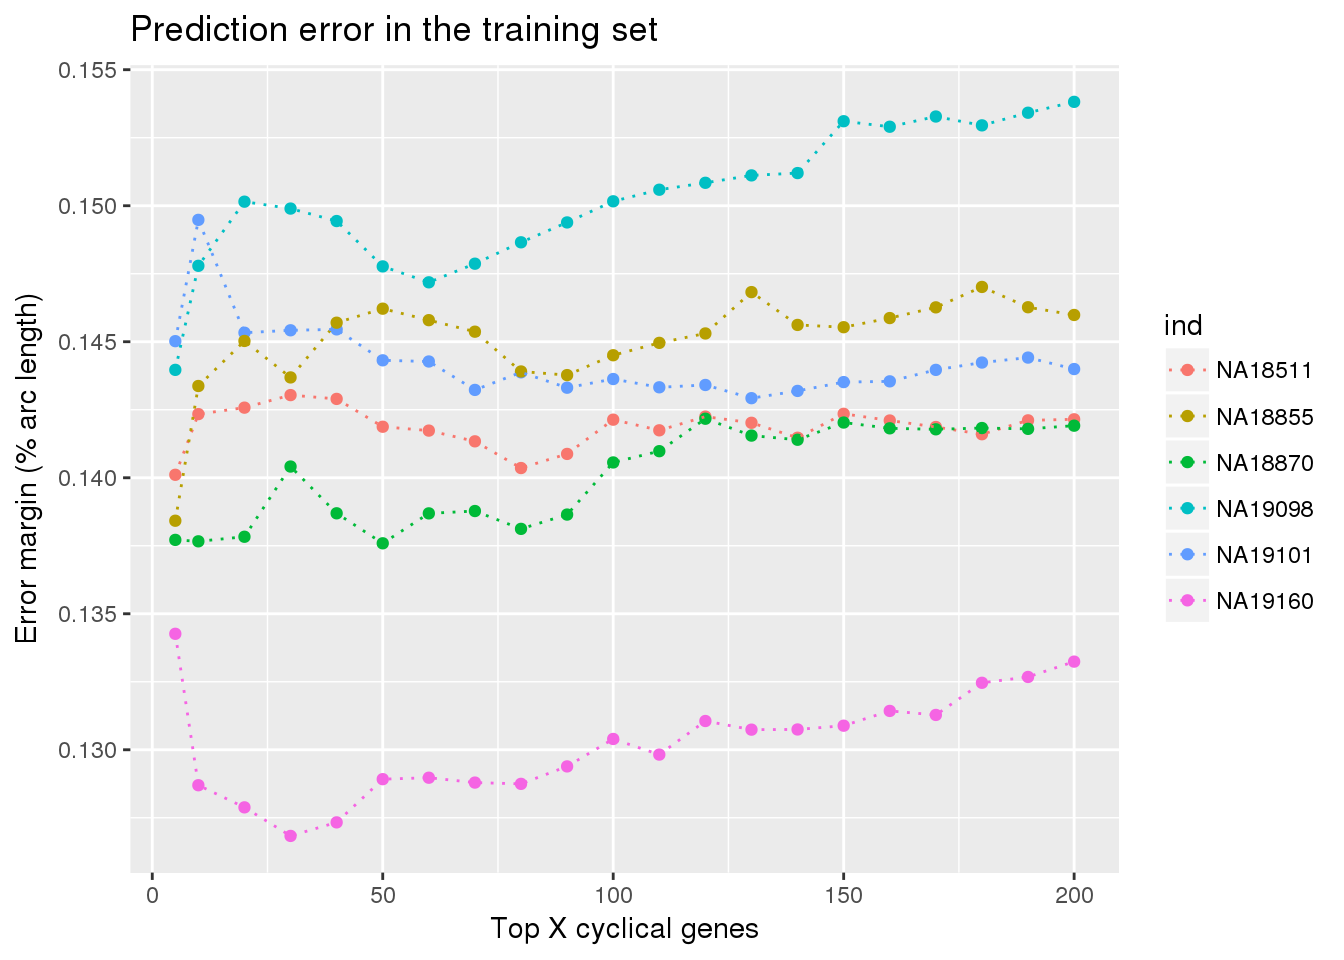
ggplot(train_double,
       aes(x=ngenes, y=diff_mean, col=ind)) +
  geom_errorbar(train_double,
                mapping=aes(ymin=diff_mean-diff_se, ymax=diff_mean+diff_se,
                            col=ind)) +
  geom_point() + geom_line(lty=3) +
  ylab("Error margin (% arc length)") + xlab("Top X cyclical genes") +
ggtitle("Prediction error in the training set") 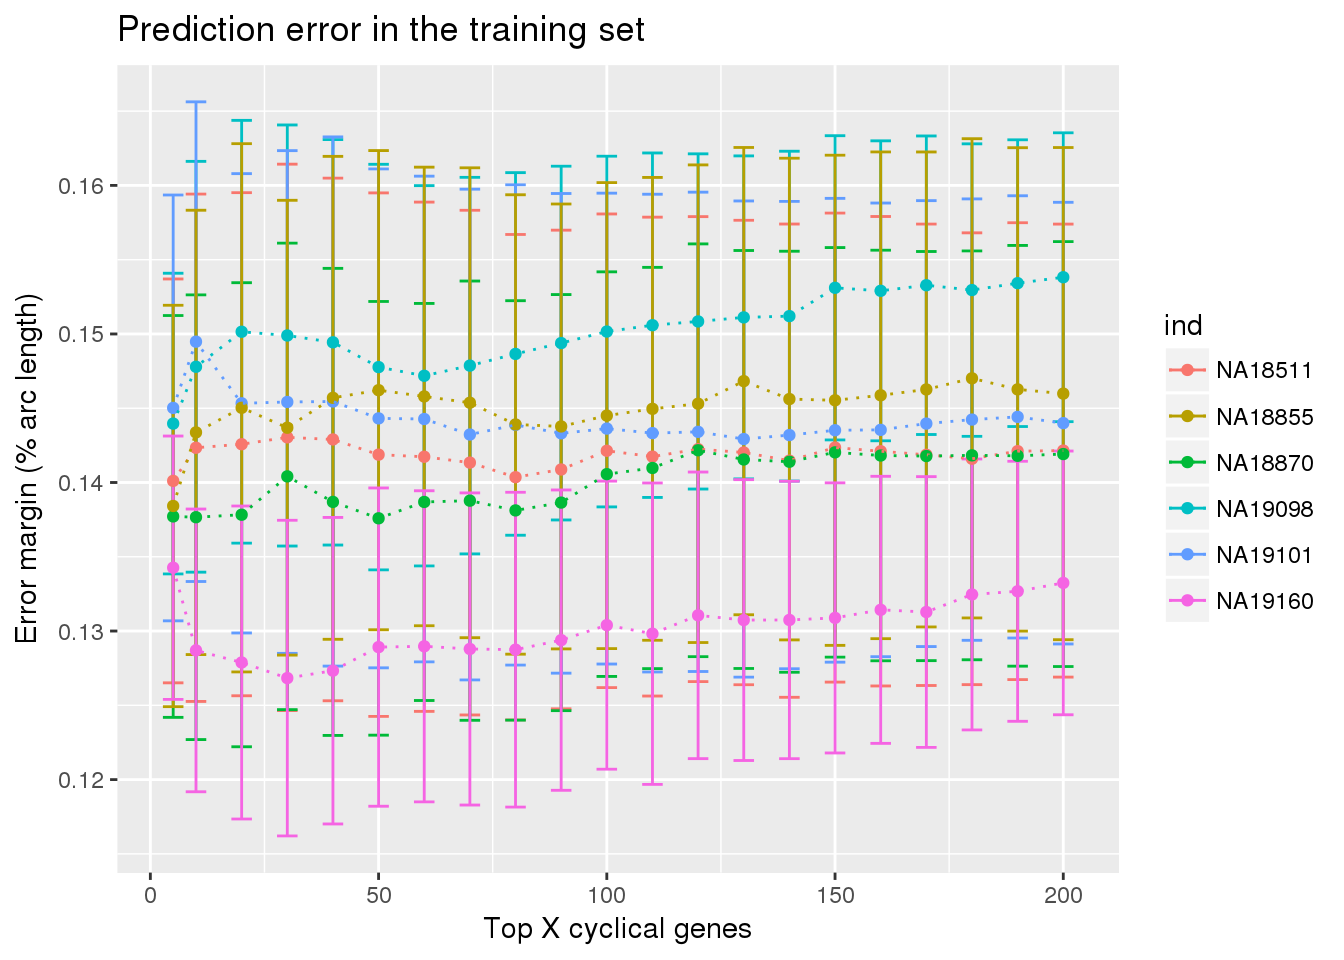
time based on fucci + dapi
library(ggplot2)
ggplot(train_triple,
       aes(x=ngenes, y=diff_mean, col=ind)) +
  # geom_errorbar(train_top,
  #               mapping=aes(ymin=diff_mean-diff_se, ymax=diff_mean+diff_se,
  #                           col=ind)) +
  geom_point() + geom_line(lty=3) +
  ylab("Error margin (% arc length)") + xlab("Top X cyclical genes") +
  ggtitle("Prediction error in the training set") +
  ylim(0,.25)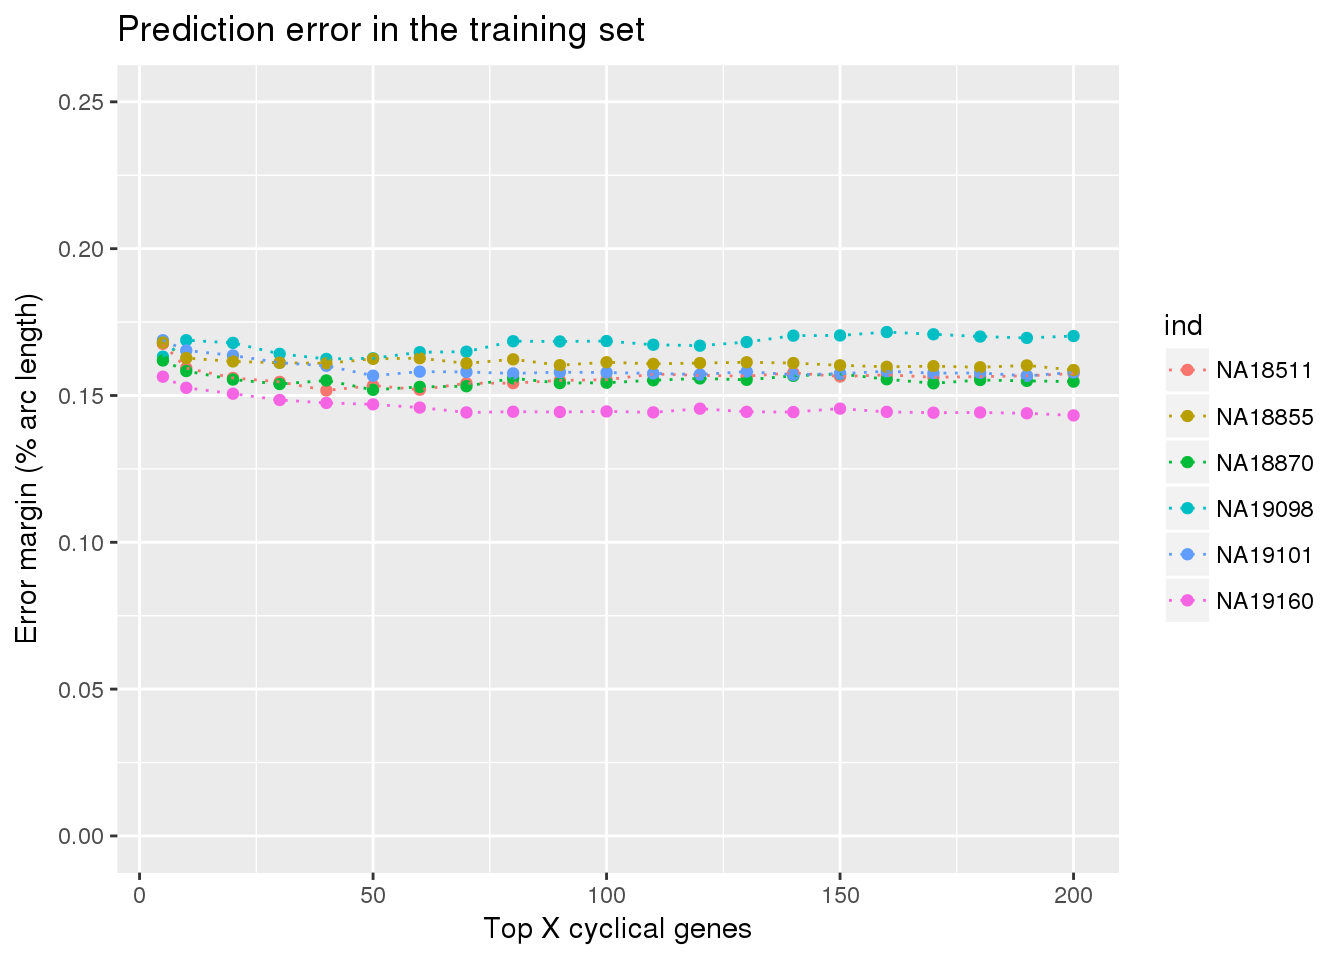
library(ggplot2)
ggplot(train_triple,
       aes(x=ngenes, y=diff_mean, col=ind)) +
  # geom_errorbar(train_top,
  #               mapping=aes(ymin=diff_mean-diff_se, ymax=diff_mean+diff_se,
  #                           col=ind)) +
  geom_point() + geom_line(lty=3) +
  ylab("Error margin (% arc length)") + xlab("Top X cyclical genes") +
ggtitle("Prediction error in the training set") 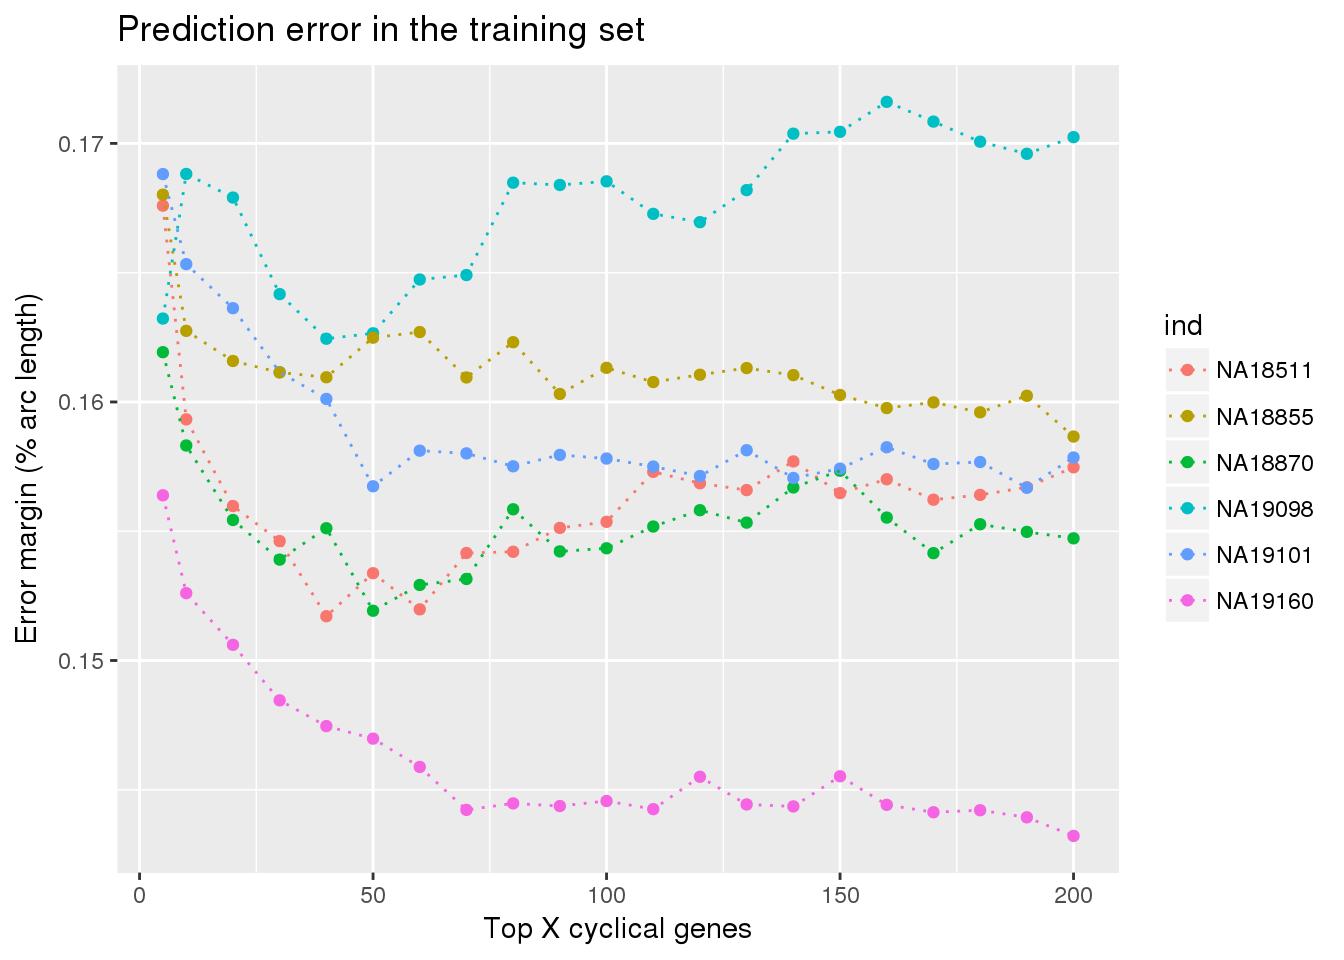
ggplot(train_triple,
       aes(x=ngenes, y=diff_mean, col=ind)) +
  geom_errorbar(train_double,
                mapping=aes(ymin=diff_mean-diff_se, ymax=diff_mean+diff_se,
                            col=ind)) +
  geom_point() + geom_line(lty=3) +
  ylab("Error margin (% arc length)") + xlab("Top X cyclical genes") +
ggtitle("Prediction error in the training set") 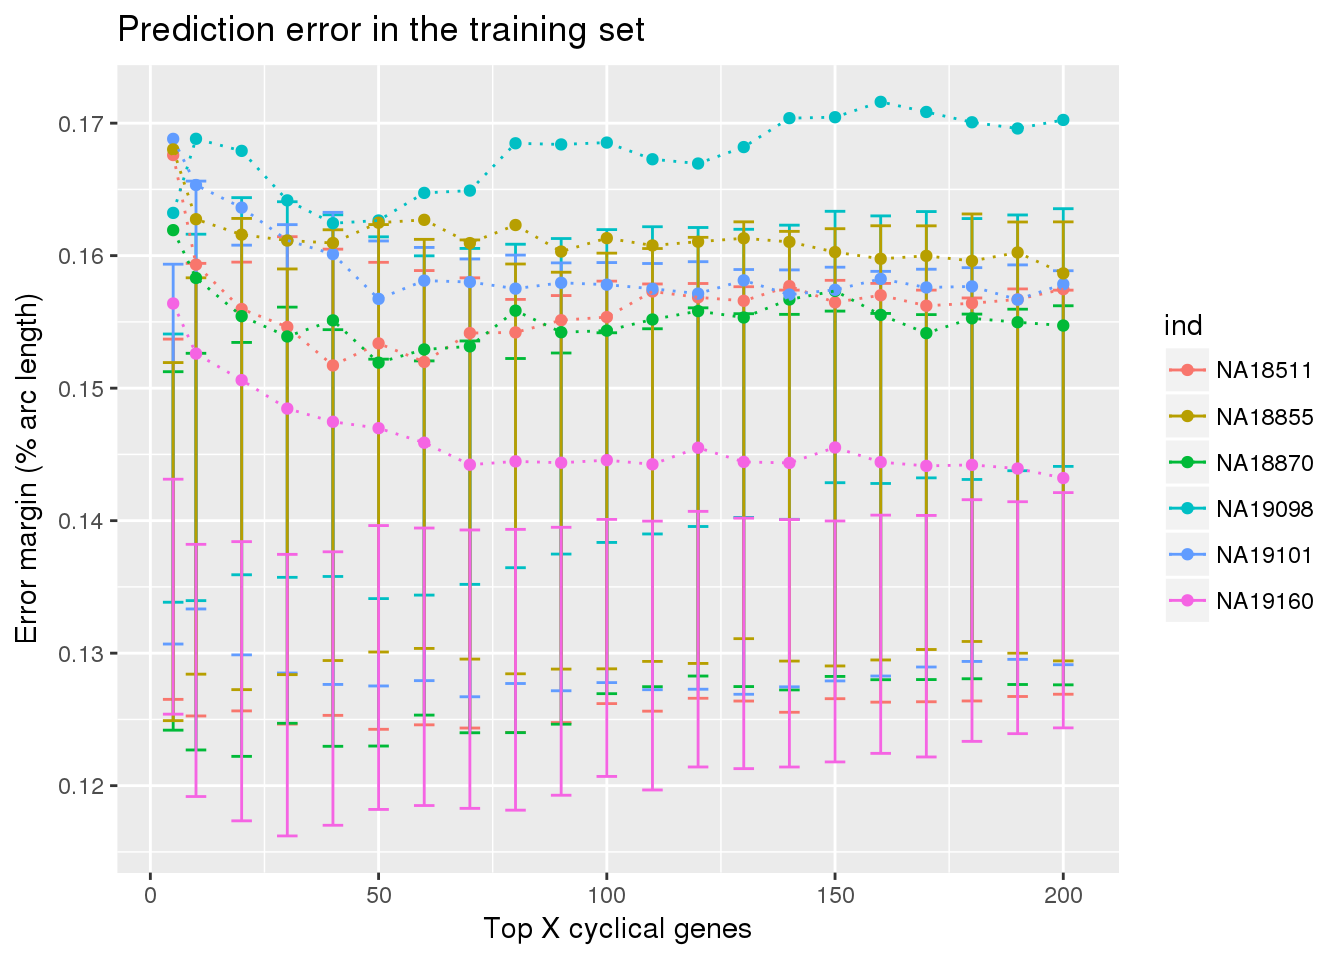
Session information
sessionInfo()R version 3.4.3 (2017-11-30)
Platform: x86_64-pc-linux-gnu (64-bit)
Running under: Scientific Linux 7.4 (Nitrogen)
Matrix products: default
BLAS/LAPACK: /software/openblas-0.2.19-el7-x86_64/lib/libopenblas_haswellp-r0.2.19.so
locale:
[1] LC_CTYPE=en_US.UTF-8 LC_NUMERIC=C
[3] LC_TIME=en_US.UTF-8 LC_COLLATE=en_US.UTF-8
[5] LC_MONETARY=en_US.UTF-8 LC_MESSAGES=en_US.UTF-8
[7] LC_PAPER=en_US.UTF-8 LC_NAME=C
[9] LC_ADDRESS=C LC_TELEPHONE=C
[11] LC_MEASUREMENT=en_US.UTF-8 LC_IDENTIFICATION=C
attached base packages:
[1] stats graphics grDevices utils datasets methods base
other attached packages:
[1] ggplot2_2.2.1 gplots_3.0.1
loaded via a namespace (and not attached):
[1] Rcpp_0.12.17 knitr_1.20 magrittr_1.5
[4] munsell_0.4.3 colorspace_1.3-2 rlang_0.1.6
[7] stringr_1.2.0 plyr_1.8.4 caTools_1.17.1
[10] tools_3.4.3 grid_3.4.3 gtable_0.2.0
[13] KernSmooth_2.23-15 git2r_0.21.0 htmltools_0.3.6
[16] gtools_3.5.0 lazyeval_0.2.1 yaml_2.1.16
[19] rprojroot_1.3-2 digest_0.6.15 tibble_1.4.2
[22] bitops_1.0-6 evaluate_0.10.1 rmarkdown_1.10
[25] labeling_0.3 gdata_2.18.0 stringi_1.1.6
[28] pillar_1.1.0 compiler_3.4.3 scales_0.5.0
[31] backports_1.1.2 This R Markdown site was created with workflowr