<!DOCTYPE html>

<html xmlns="http://www.w3.org/1999/xhtml">

<head>

<meta charset="utf-8" />
<meta http-equiv="Content-Type" content="text/html; charset=utf-8" />
<meta name="generator" content="pandoc" />


<meta name="author" content="Joyce Hsiao" />


<title>Images quality control follow-up analysis</title>

<script src="site_libs/jquery-1.11.3/jquery.min.js"></script>
<meta name="viewport" content="width=device-width, initial-scale=1" />
<link href="site_libs/bootstrap-3.3.5/css/cosmo.min.css" rel="stylesheet" />
<script src="site_libs/bootstrap-3.3.5/js/bootstrap.min.js"></script>
<script src="site_libs/bootstrap-3.3.5/shim/html5shiv.min.js"></script>
<script src="site_libs/bootstrap-3.3.5/shim/respond.min.js"></script>
<script src="site_libs/jqueryui-1.11.4/jquery-ui.min.js"></script>
<link href="site_libs/tocify-1.9.1/jquery.tocify.css" rel="stylesheet" />
<script src="site_libs/tocify-1.9.1/jquery.tocify.js"></script>
<script src="site_libs/navigation-1.1/tabsets.js"></script>
<link href="site_libs/highlightjs-1.1/textmate.css" rel="stylesheet" />
<script src="site_libs/highlightjs-1.1/highlight.js"></script>
<link href="site_libs/font-awesome-4.5.0/css/font-awesome.min.css" rel="stylesheet" />

<style type="text/css">code{white-space: pre;}</style>
<style type="text/css">
  pre:not([class]) {
    background-color: white;
  }
</style>
<script type="text/javascript">
if (window.hljs && document.readyState && document.readyState === "complete") {
   window.setTimeout(function() {
      hljs.initHighlighting();
   }, 0);
}
</script>


<style type="text/css">
h1 {
  font-size: 34px;
}
h1.title {
  font-size: 38px;
}
h2 {
  font-size: 30px;
}
h3 {
  font-size: 24px;
}
h4 {
  font-size: 18px;
}
h5 {
  font-size: 16px;
}
h6 {
  font-size: 12px;
}
.table th:not([align]) {
  text-align: left;
}
</style>


</head>

<body>

<style type = "text/css">
.main-container {
  max-width: 940px;
  margin-left: auto;
  margin-right: auto;
}
code {
  color: inherit;
  background-color: rgba(0, 0, 0, 0.04);
}
img {
  max-width:100%;
  height: auto;
}
.tabbed-pane {
  padding-top: 12px;
}
button.code-folding-btn:focus {
  outline: none;
}
</style>


<style type="text/css">
/* padding for bootstrap navbar */
body {
  padding-top: 51px;
  padding-bottom: 40px;
}
/* offset scroll position for anchor links (for fixed navbar)  */
.section h1 {
  padding-top: 56px;
  margin-top: -56px;
}

.section h2 {
  padding-top: 56px;
  margin-top: -56px;
}
.section h3 {
  padding-top: 56px;
  margin-top: -56px;
}
.section h4 {
  padding-top: 56px;
  margin-top: -56px;
}
.section h5 {
  padding-top: 56px;
  margin-top: -56px;
}
.section h6 {
  padding-top: 56px;
  margin-top: -56px;
}
</style>

<script>
// manage active state of menu based on current page
$(document).ready(function () {
  // active menu anchor
  href = window.location.pathname
  href = href.substr(href.lastIndexOf('/') + 1)
  if (href === "")
    href = "index.html";
  var menuAnchor = $('a[href="' + href + '"]');

  // mark it active
  menuAnchor.parent().addClass('active');

  // if it's got a parent navbar menu mark it active as well
  menuAnchor.closest('li.dropdown').addClass('active');
});
</script>


<div class="container-fluid main-container">

<!-- tabsets -->
<script>
$(document).ready(function () {
  window.buildTabsets("TOC");
});
</script>

<!-- code folding -->


<script>
$(document).ready(function ()  {

    // move toc-ignore selectors from section div to header
    $('div.section.toc-ignore')
        .removeClass('toc-ignore')
        .children('h1,h2,h3,h4,h5').addClass('toc-ignore');

    // establish options
    var options = {
      selectors: "h1,h2,h3",
      theme: "bootstrap3",
      context: '.toc-content',
      hashGenerator: function (text) {
        return text.replace(/[.\\/?&!#<>]/g, '').replace(/\s/g, '_').toLowerCase();
      },
      ignoreSelector: ".toc-ignore",
      scrollTo: 0
    };
    options.showAndHide = true;
    options.smoothScroll = true;

    // tocify
    var toc = $("#TOC").tocify(options).data("toc-tocify");
});
</script>

<style type="text/css">

#TOC {
  margin: 25px 0px 20px 0px;
}
@media (max-width: 768px) {
#TOC {
  position: relative;
  width: 100%;
}
}


.toc-content {
  padding-left: 30px;
  padding-right: 40px;
}

div.main-container {
  max-width: 1200px;
}

div.tocify {
  width: 20%;
  max-width: 260px;
  max-height: 85%;
}

@media (min-width: 768px) and (max-width: 991px) {
  div.tocify {
    width: 25%;
  }
}

@media (max-width: 767px) {
  div.tocify {
    width: 100%;
    max-width: none;
  }
}

.tocify ul, .tocify li {
  line-height: 20px;
}

.tocify-subheader .tocify-item {
  font-size: 0.90em;
  padding-left: 25px;
  text-indent: 0;
}

.tocify .list-group-item {
  border-radius: 0px;
}


</style>

<!-- setup 3col/9col grid for toc_float and main content  -->
<div class="row-fluid">
<div class="col-xs-12 col-sm-4 col-md-3">
<div id="TOC" class="tocify">
</div>
</div>

<div class="toc-content col-xs-12 col-sm-8 col-md-9">


<div class="navbar navbar-default  navbar-fixed-top" role="navigation">
  <div class="container">
    <div class="navbar-header">
      <button type="button" class="navbar-toggle collapsed" data-toggle="collapse" data-target="#navbar">
        <span class="icon-bar"></span>
        <span class="icon-bar"></span>
        <span class="icon-bar"></span>
      </button>
      <a class="navbar-brand" href="index.html">fucci-seq</a>
    </div>
    <div id="navbar" class="navbar-collapse collapse">
      <ul class="nav navbar-nav">
        <li>
  <a href="index.html">Home</a>
</li>
<li>
  <a href="about.html">About</a>
</li>
<li>
  <a href="license.html">License</a>
</li>
      </ul>
      <ul class="nav navbar-nav navbar-right">
        <li>
  <a href="https://github.com/jdblischak/workflowr">
    <span class="fa fa-github"></span>
     
  </a>
</li>
      </ul>
    </div><!--/.nav-collapse -->
  </div><!--/.container -->
</div><!--/.navbar -->
<!-- Add a small amount of space between sections. -->
<style type="text/css">
div.section {
  padding-top: 12px;
}
</style>

<div class="fluid-row" id="header">


<h1 class="title toc-ignore">Images quality control follow-up analysis</h1>
<h4 class="author"><em>Joyce Hsiao</em></h4>

</div>


<!-- The file analysis/chunks.R contains chunks that define default settings
shared across the workflowr files. -->
<!-- Update knitr chunk options -->
<!-- Insert the date the file was last updated -->
<p><strong>Last updated:</strong> 2017-12-11</p>
<!-- Insert the code version (Git commit SHA1) if Git repository exists and R
 package git2r is installed -->
<p><strong>Code version:</strong> ff5a8ce</p>
<hr />
<div id="background-and-summary" class="section level2">
<h2>Background and summary</h2>
<p>In the current analysis, we computed corrected signal for each channel as follows:</p>
<pre><code>(foreground mean intensity - background mean intenstiy)*mask size</code></pre>
<p>This is equivalent to computing the sum of pixel intensities after substracting background mean intensity from each pixel in the mask. The <code>mask size</code> is defined as: Denote the center of the nucleus as <code>(cx,cy)</code>, then the mask area is <code>(max(1,cx-50):min(cx+50,nrow), max(1,cy-50):min(cy+50,ncol))</code>. The maximum mask size is 10,000.</p>
<p>This metric for summarizing pixel intensity factors into the quantity of cell cycle protein (green and red), and indirectly, the cell size. While, previously our metric of mean pixel intensity does not account for the quantity of cell cycle protein (green and red).</p>
<p>Results:</p>
<ol style="list-style-type: decimal">
<li><p>In about 10 to 15 single cell samples, the background intensity is greater than the foreground intensity by a small amount (~.001) in the Red or the Green channel. we need to check to see if there are signals at all for these samples in any of channles. If there’s any signal, then we’ll set the channel with no signal to the lowest possible intensity value.</p></li>
<li><p>
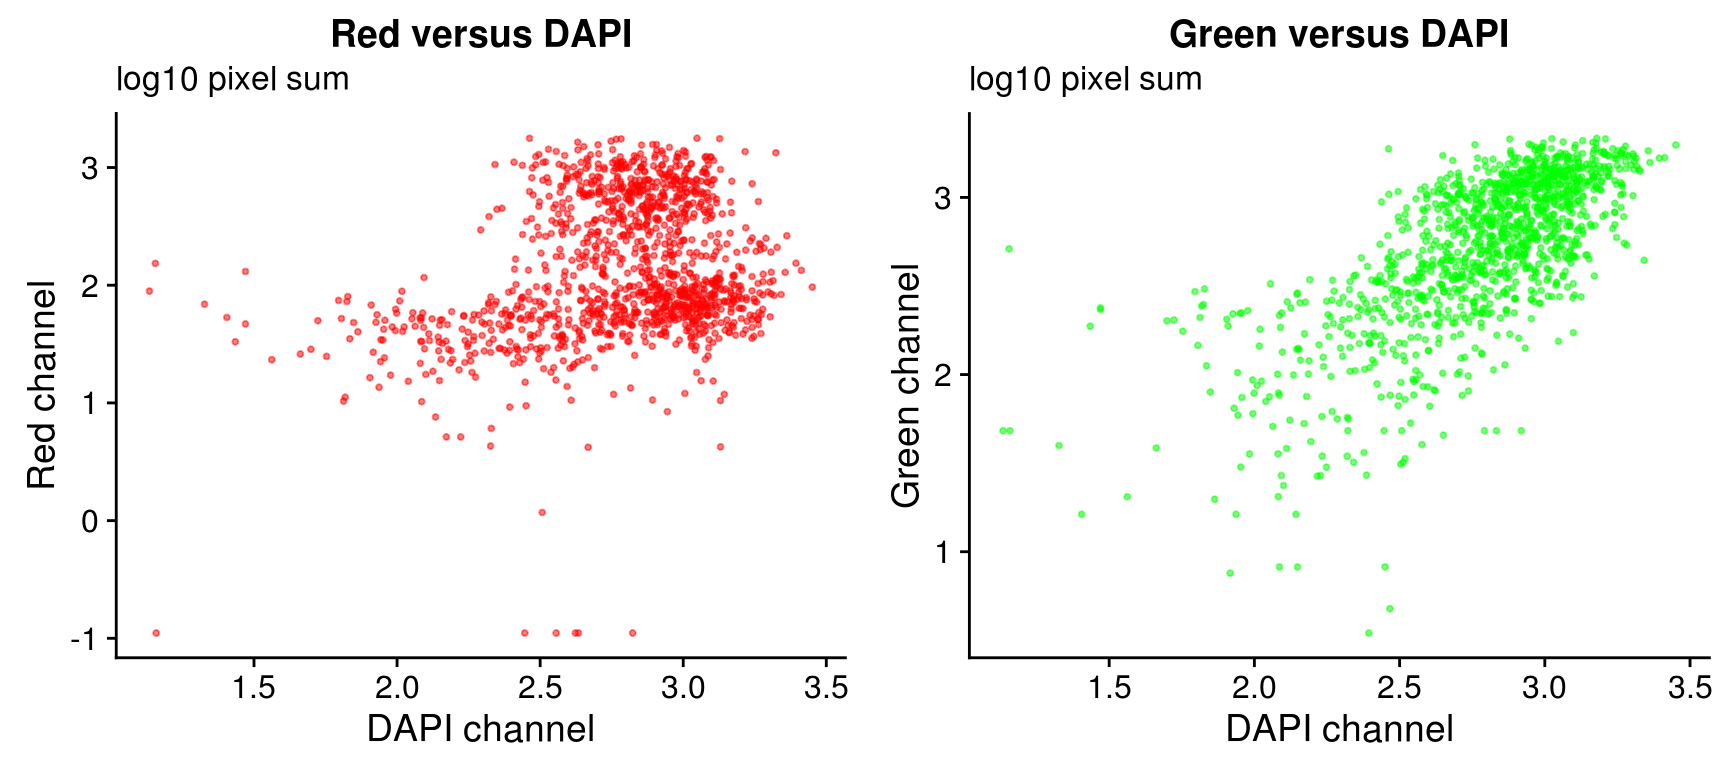
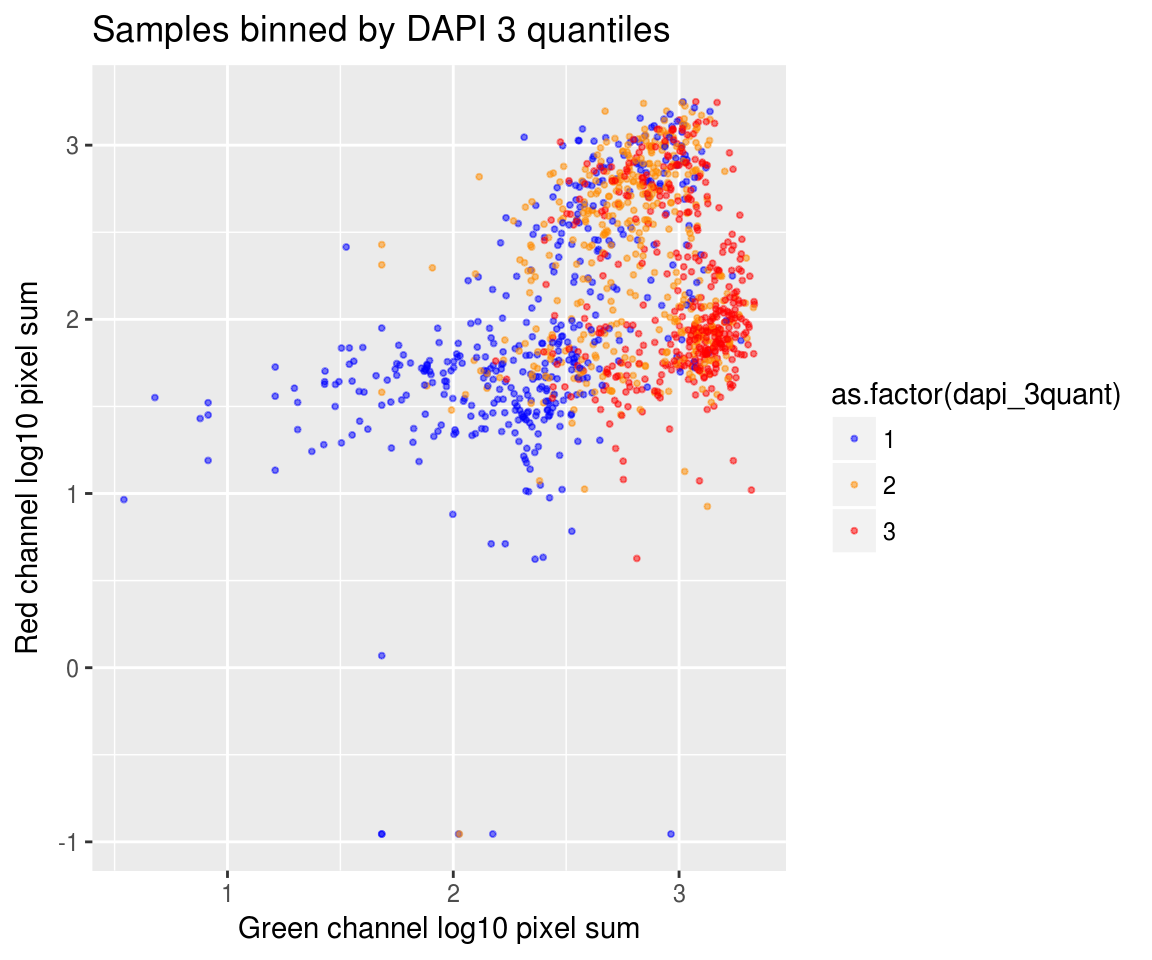
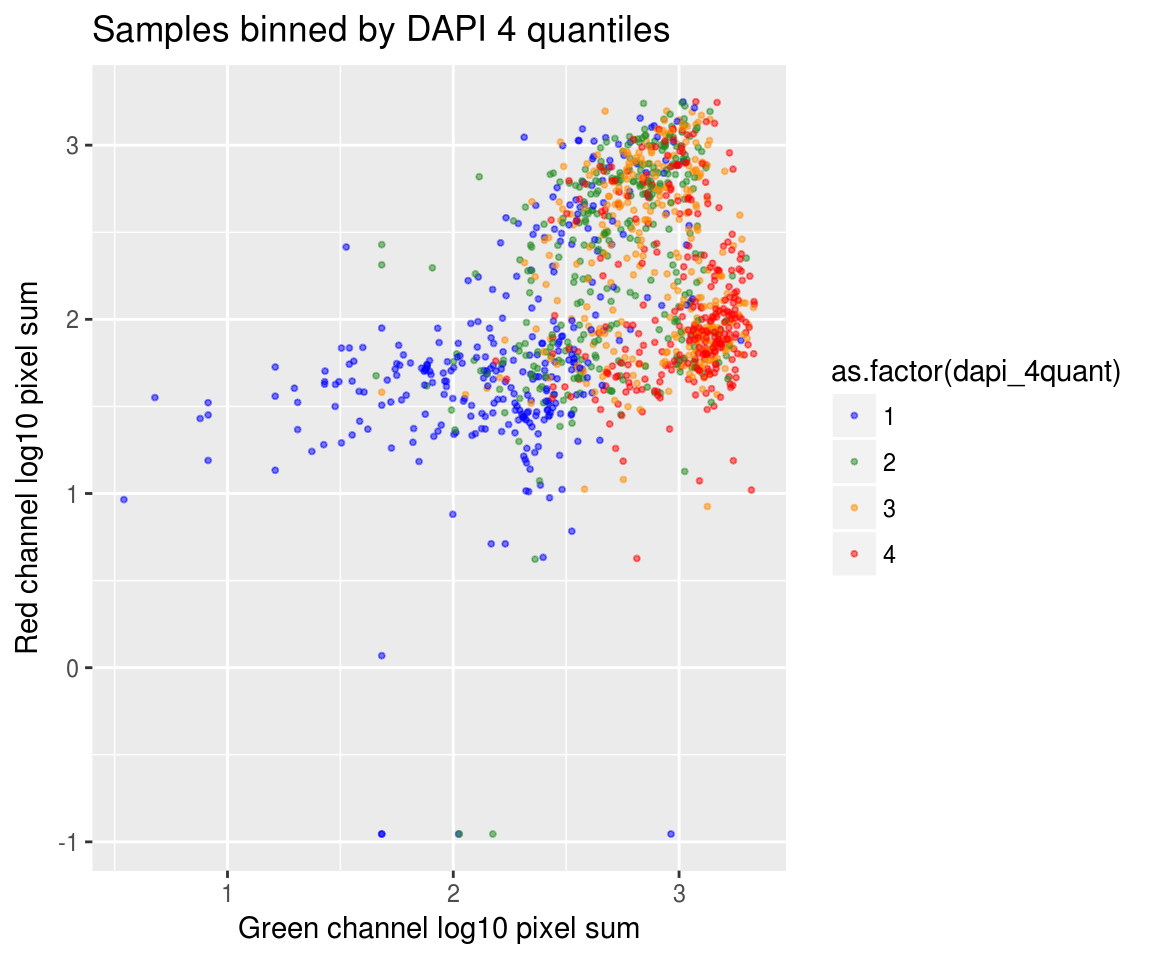
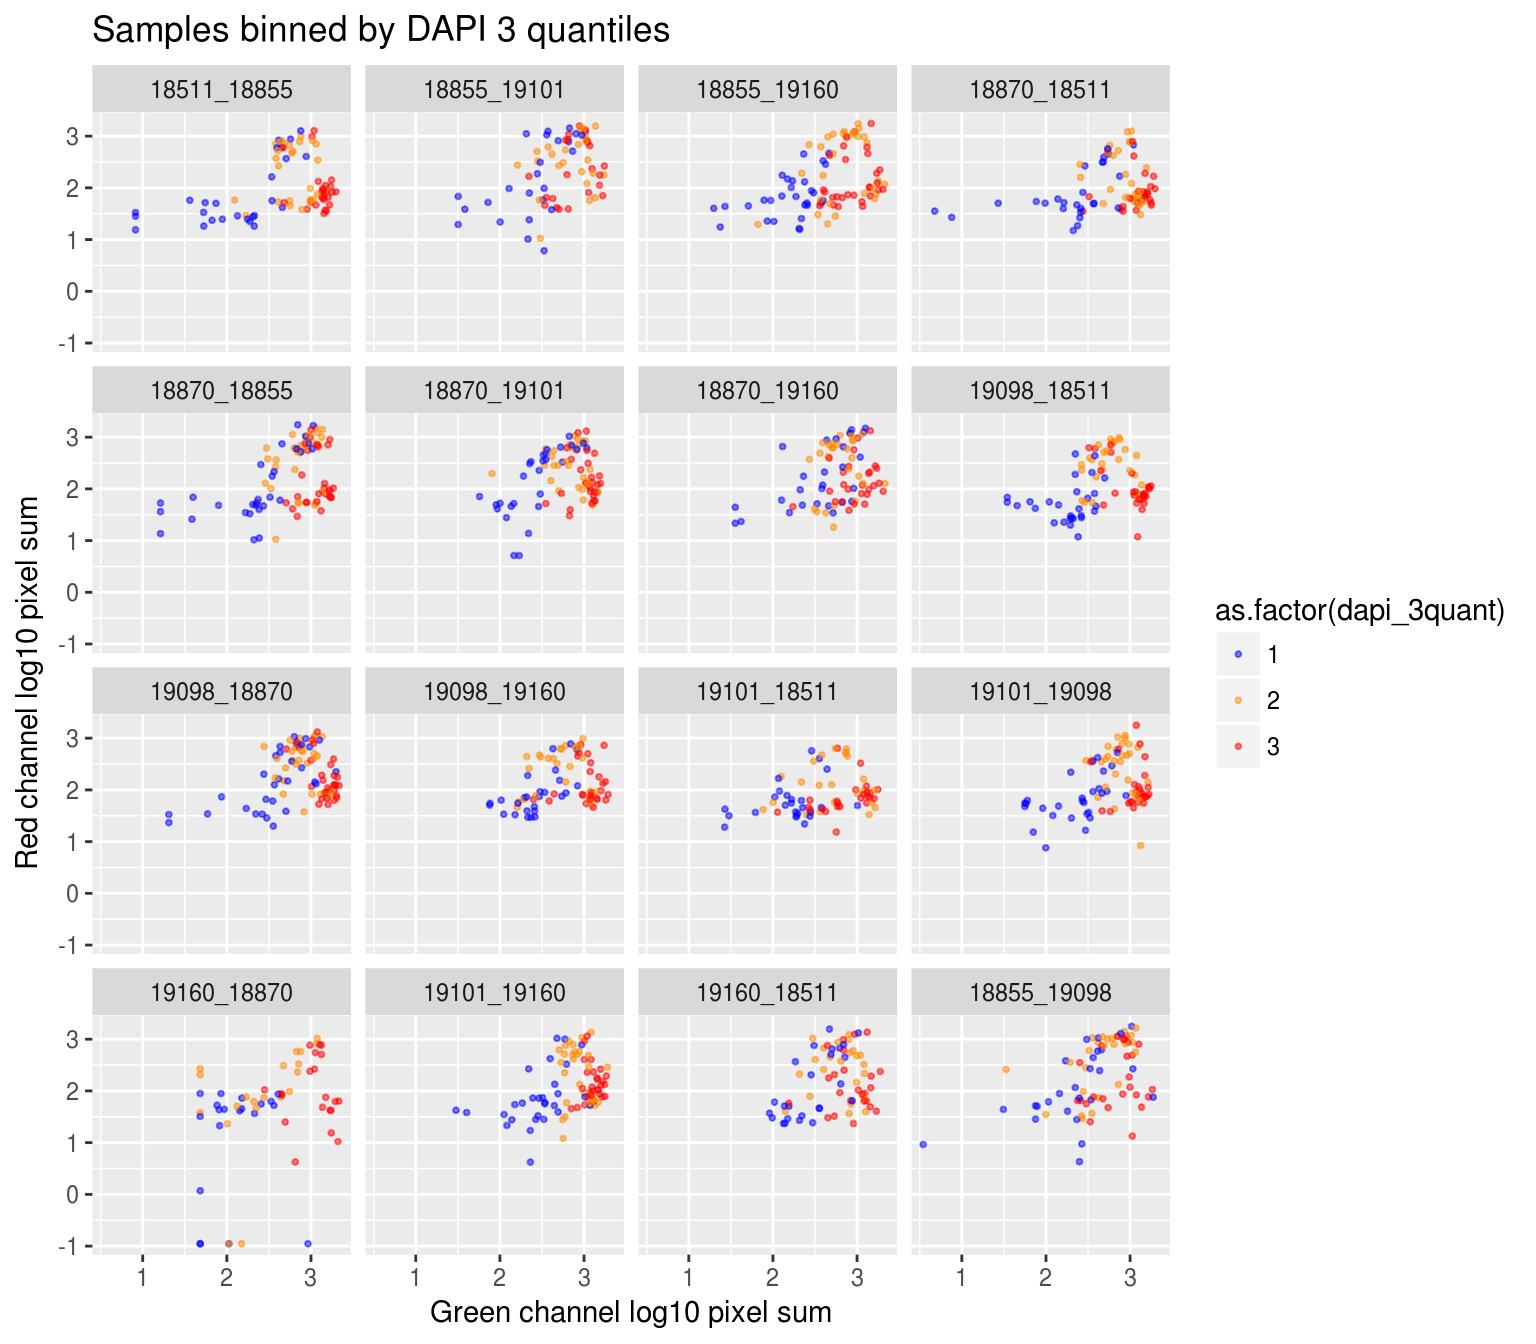
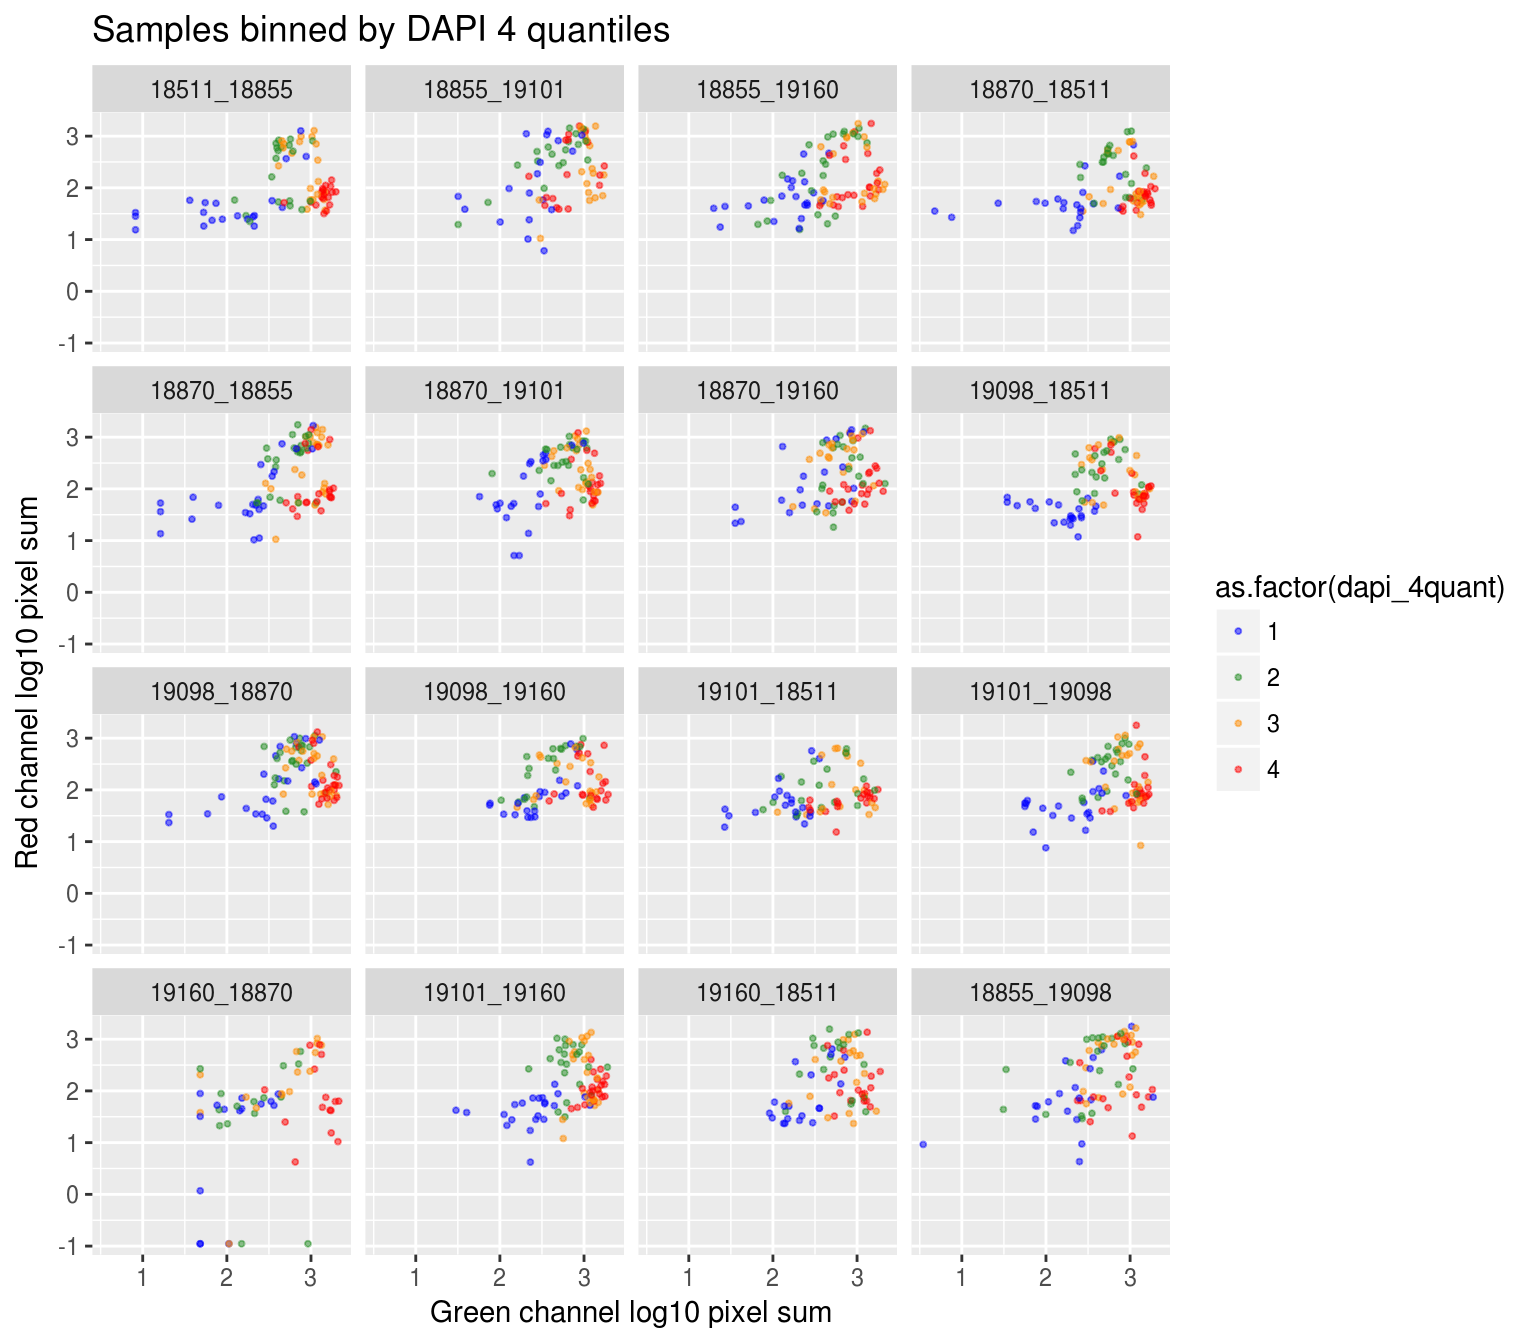
On log10 scale of pixel sum intensity, we are able to observe the separation of single cell samples on Red channel and also on Green channel. And, interestly, in figures plotting Red against Green, we observe three clusters roughly correspond to low, medium and high DAPI.</p></li>
<li><p>
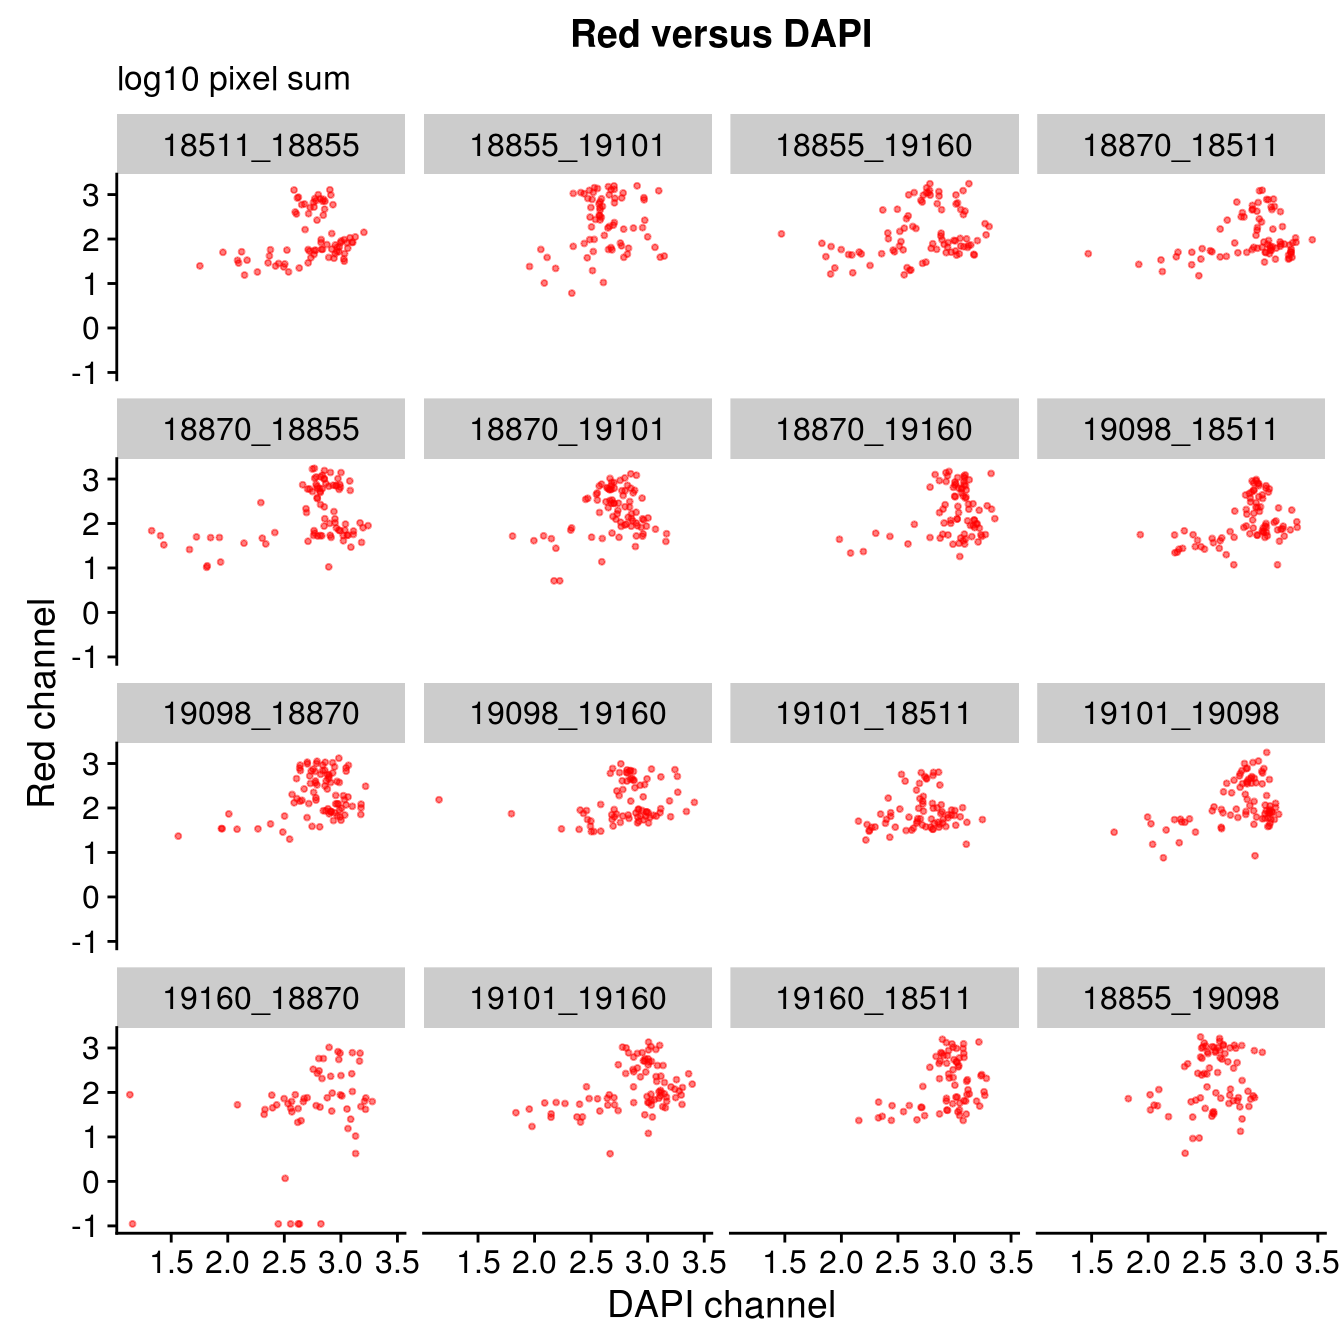
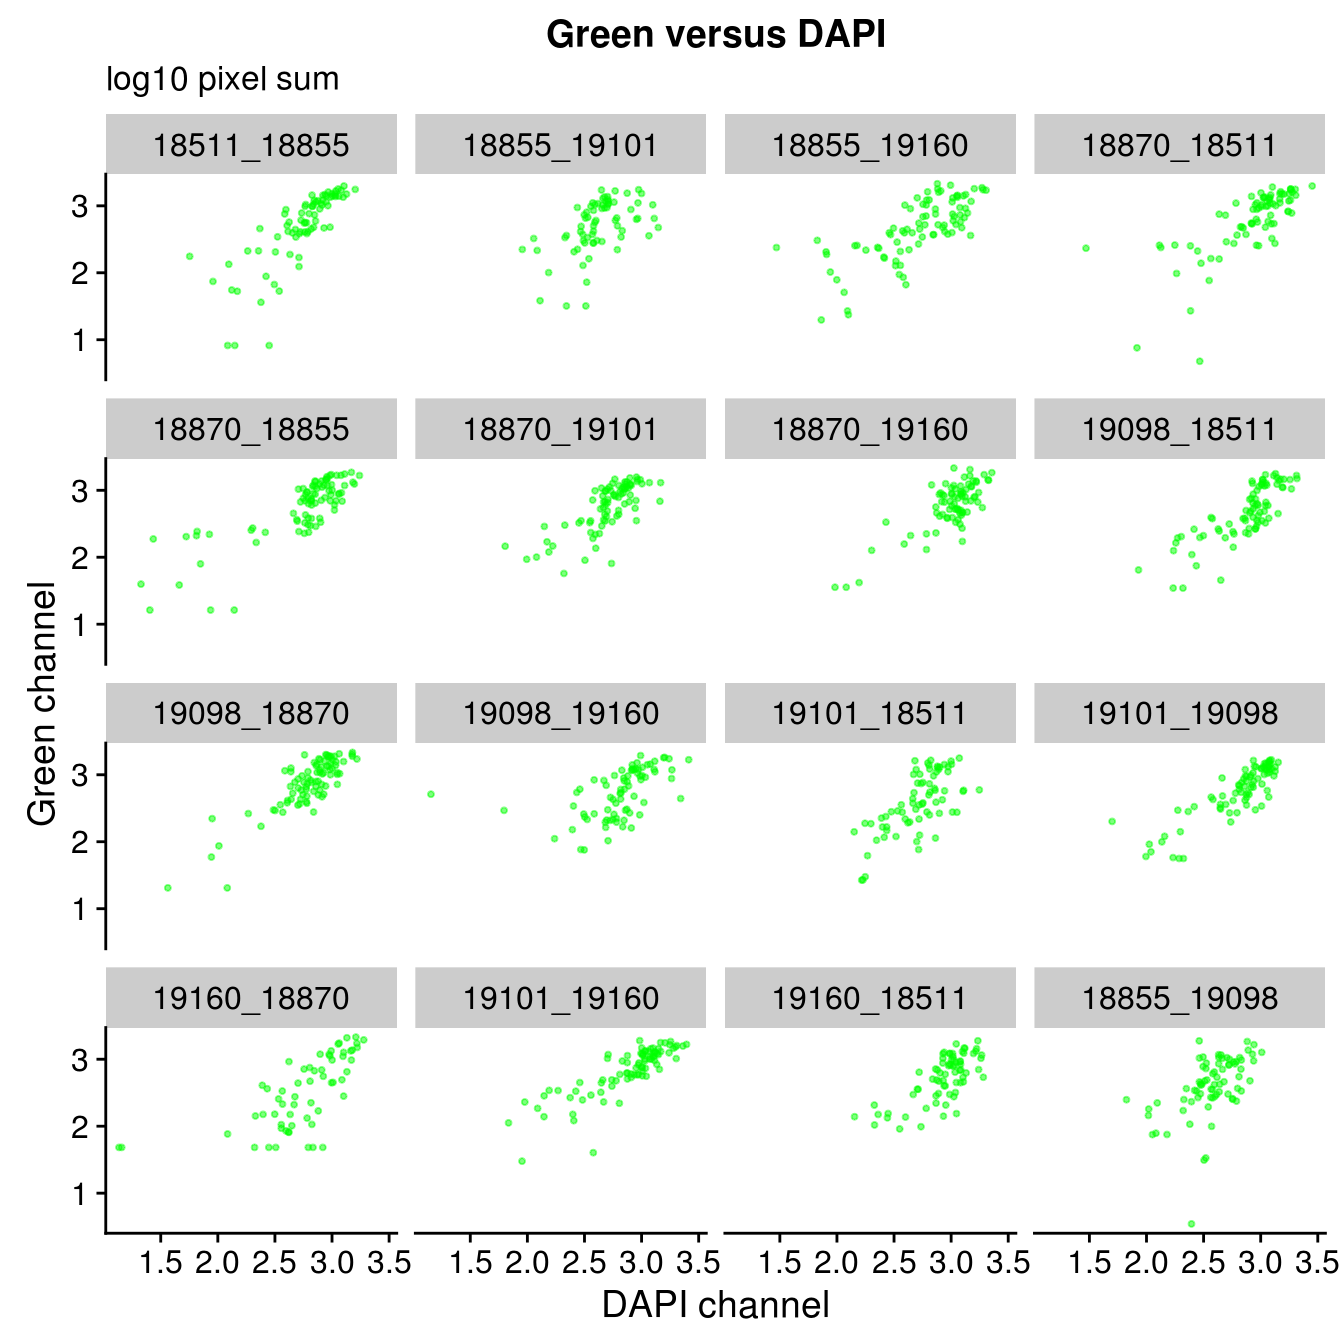
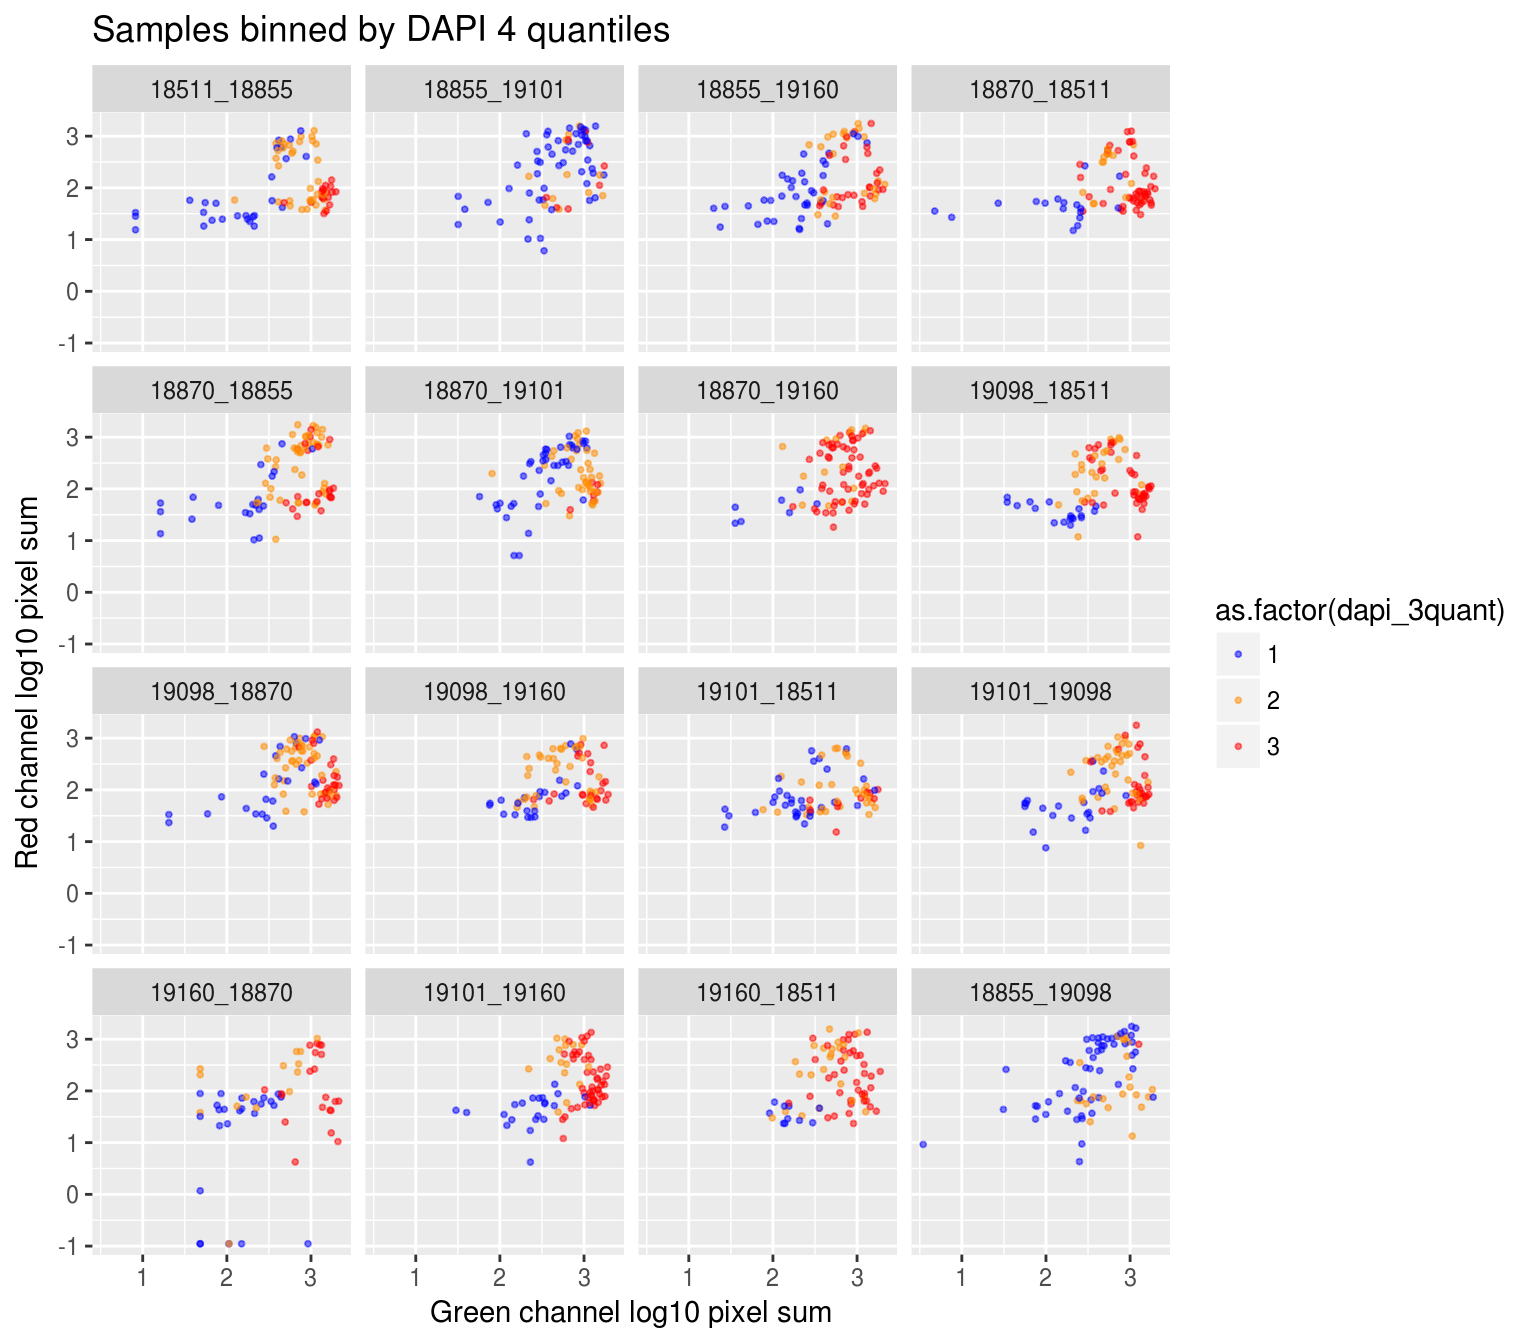
Plate effect: the pattern observed in Red intensities against Green intensities appears to vary by plate, and when we control for plate differencees in DAPI intensities, we see the distribution of DAPI intensities fairly similar across plates!</p></li>
<li><p>The metric for intensity in the current analysis effective scales the mean intensity by the channel specific and sample-specific coverage area of fluorescent intensities. This is likely the main contributing factor for the better separtion of single cell samples we observe here.</p></li>
</ol>
<p><strong>Next steps</strong>:</p>
<ol style="list-style-type: decimal">
<li><p>Batch correction for plate and individual effect.</p></li>
<li><p>Classification? How? Should be non-linear…</p></li>
</ol>
<hr />
</div>
<div id="loading-data" class="section level2">
<h2>Loading data</h2>
<pre><code>Warning: Installed Rcpp (0.12.14) different from Rcpp used to build dplyr (0.12.10).
Please reinstall dplyr to avoid random crashes or undefined behavior.</code></pre>
<p>Import combined intensity data (see <a href="/project2/gilad/joycehsiao/fucci-seq/code/combine-intensity-data.R">combine-intensity-data.R</a>).</p>
<pre class="r"><code>ints &lt;- readRDS(file=&quot;/project2/gilad/joycehsiao/fucci-seq/data/intensity.rds&quot;)

# compute sum of intensities
ints$dapi.sum.zoom &lt;- with(ints, (dapi.fore.zoom.mean-dapi.back.zoom.mean)*10000)
ints$rfp.sum.zoom &lt;- with(ints, (rfp.fore.zoom.mean-rfp.back.zoom.mean)*10000)
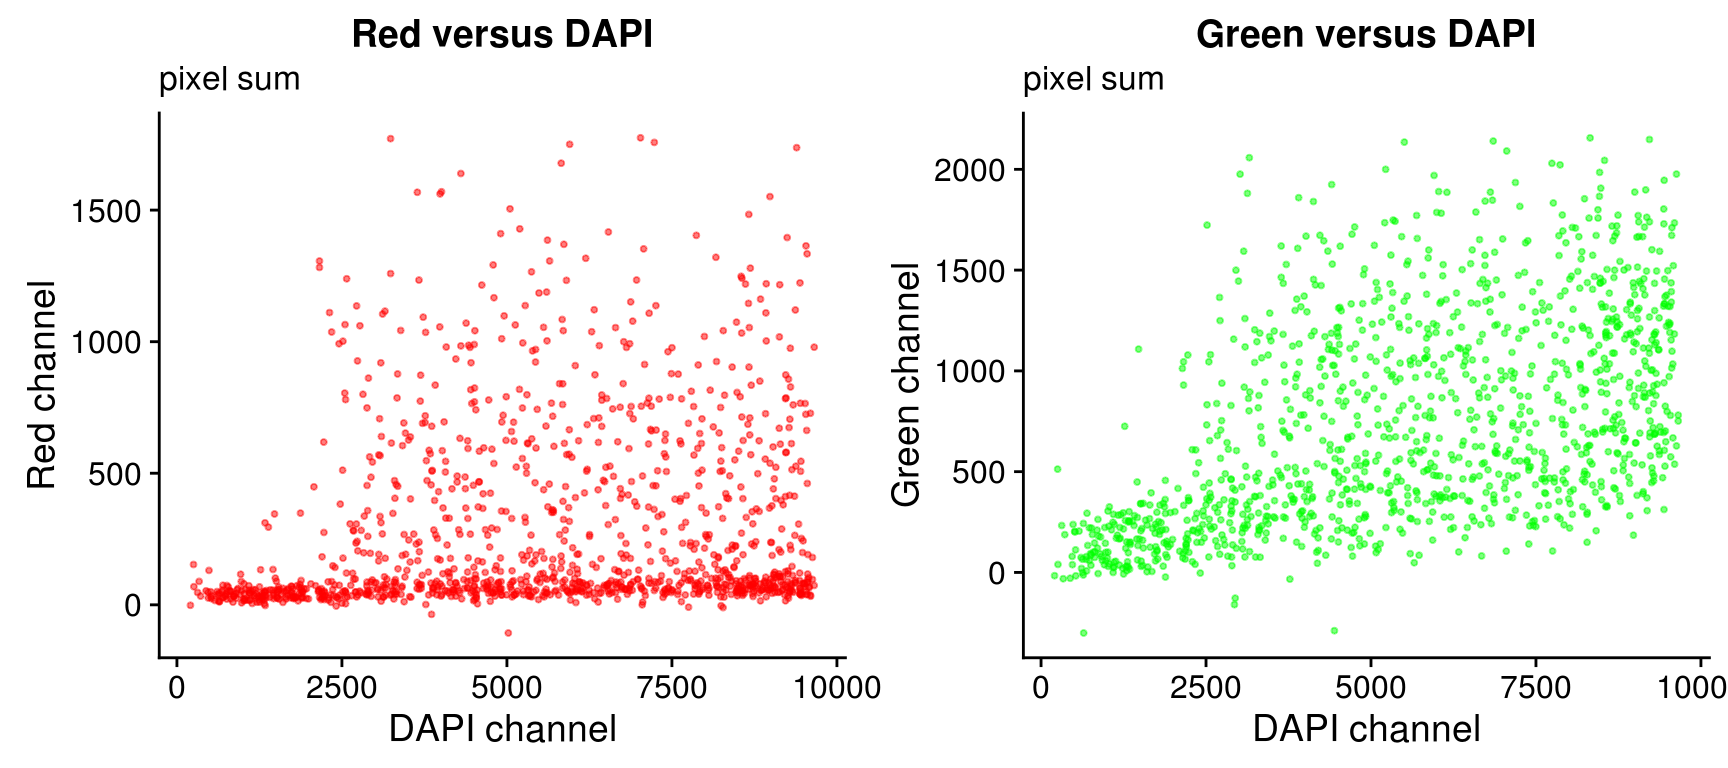
ints$gfp.sum.zoom &lt;- with(ints, (gfp.fore.zoom.mean-gfp.back.zoom.mean)*10000)</code></pre>
<hr />
</div>
<div id="dapi-versus-greenred" class="section level2">
<h2>DAPI versus Green/Red</h2>
<div id="pixel-sum" class="section level3">
<h3>Pixel sum</h3>
<p><img src="figure/images-qc-followup.Rmd/unnamed-chunk-3-1.png" width="864" style="display: block; margin: auto;" /></p>
</div>
<div id="log-10-pixel-sum" class="section level3">
<h3>log 10 pixel sum</h3>
<p><img src="figure/images-qc-followup.Rmd/unnamed-chunk-4-1.png" width="864" style="display: block; margin: auto;" /></p>
</div>
<div id="by-plate" class="section level3">
<h3>By plate</h3>
<p><img src="figure/images-qc-followup.Rmd/unnamed-chunk-5-1.png" width="672" style="display: block; margin: auto;" /><img src="figure/images-qc-followup.Rmd/unnamed-chunk-5-2.png" width="672" style="display: block; margin: auto;" /></p>
<hr />
</div>
</div>
<div id="red-vs-green-binned-by-dapi-quantiles" class="section level2">
<h2>Red vs Green binned by DAPI quantiles</h2>
<div id="across-plates" class="section level3">
<h3>Across plates</h3>
<p>Compute DAPI quantiles across plates.</p>
<pre class="r"><code>ints &lt;- ints %&gt;% mutate(dapi_4quant=ntile(dapi.mean.log10sum,4),
                          dapi_3quant=ntile(dapi.mean.log10sum,3))</code></pre>
<p><span class="math inline">\(~\)</span></p>
<p><img src="figure/images-qc-followup.Rmd/unnamed-chunk-7-1.png" width="576" style="display: block; margin: auto;" /><img src="figure/images-qc-followup.Rmd/unnamed-chunk-7-2.png" width="576" style="display: block; margin: auto;" /></p>
</div>
<div id="by-plate-overall-dapi-quantiles" class="section level3">
<h3>By plate, overall DAPI quantiles</h3>
<p>Compute DAPI quantiles across plates.</p>
<p><img src="figure/images-qc-followup.Rmd/unnamed-chunk-8-1.png" width="768" style="display: block; margin: auto;" /><img src="figure/images-qc-followup.Rmd/unnamed-chunk-8-2.png" width="768" style="display: block; margin: auto;" /></p>
</div>
<div id="by-plate-plate-specific-dapi-quantiles" class="section level3">
<h3>
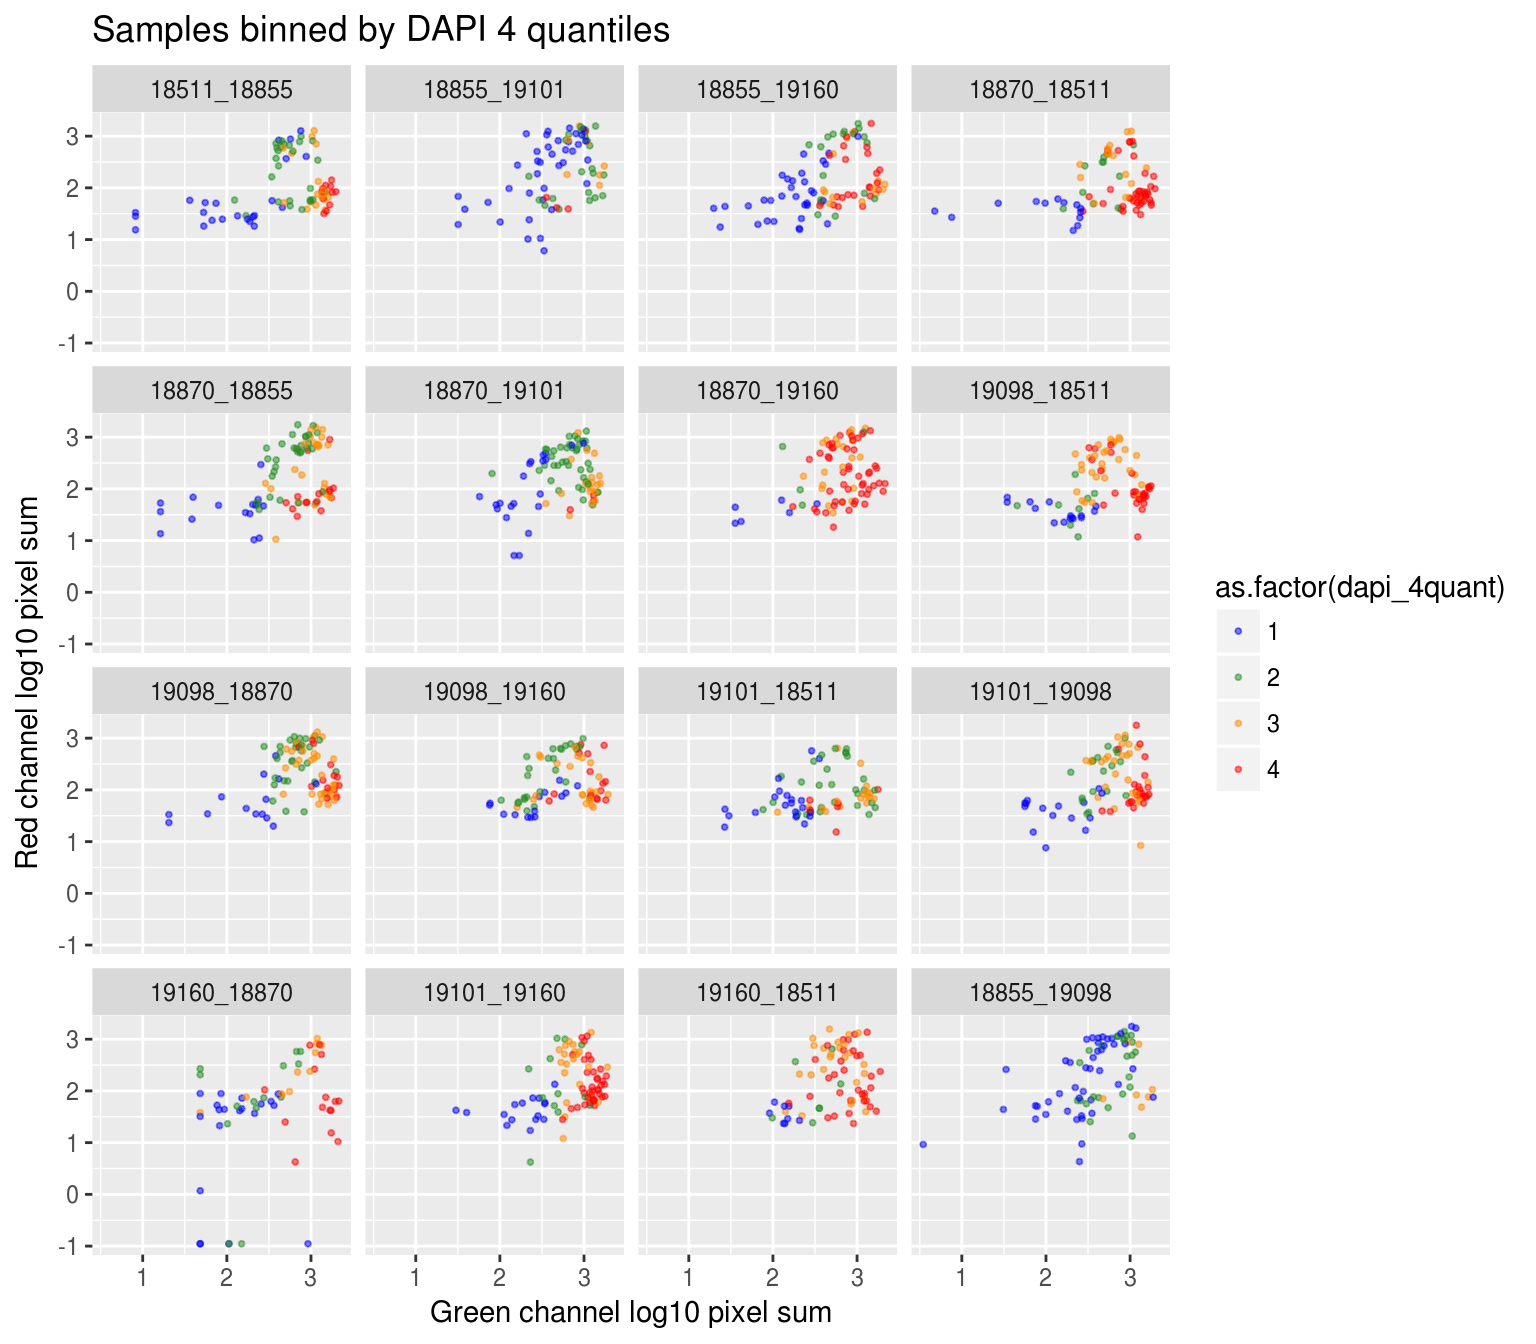
By plate, plate-specific DAPI quantiles</h3>
<p>Compute DAPI quantiles in each plate.</p>
<pre class="r"><code>ints_tmp &lt;- ints %&gt;% group_by(plate) %&gt;% mutate(dapi_4quant=ntile(dapi.mean.log10sum,4),
                          dapi_3quant=ntile(dapi.mean.log10sum,3))</code></pre>
<p><span class="math inline">\(~\)</span></p>
<p><img src="figure/images-qc-followup.Rmd/unnamed-chunk-10-1.png" width="768" style="display: block; margin: auto;" /><img src="figure/images-qc-followup.Rmd/unnamed-chunk-10-2.png" width="768" style="display: block; margin: auto;" /></p>
<hr />
</div>
</div>
<div id="density-distribution" class="section level2">
<h2>
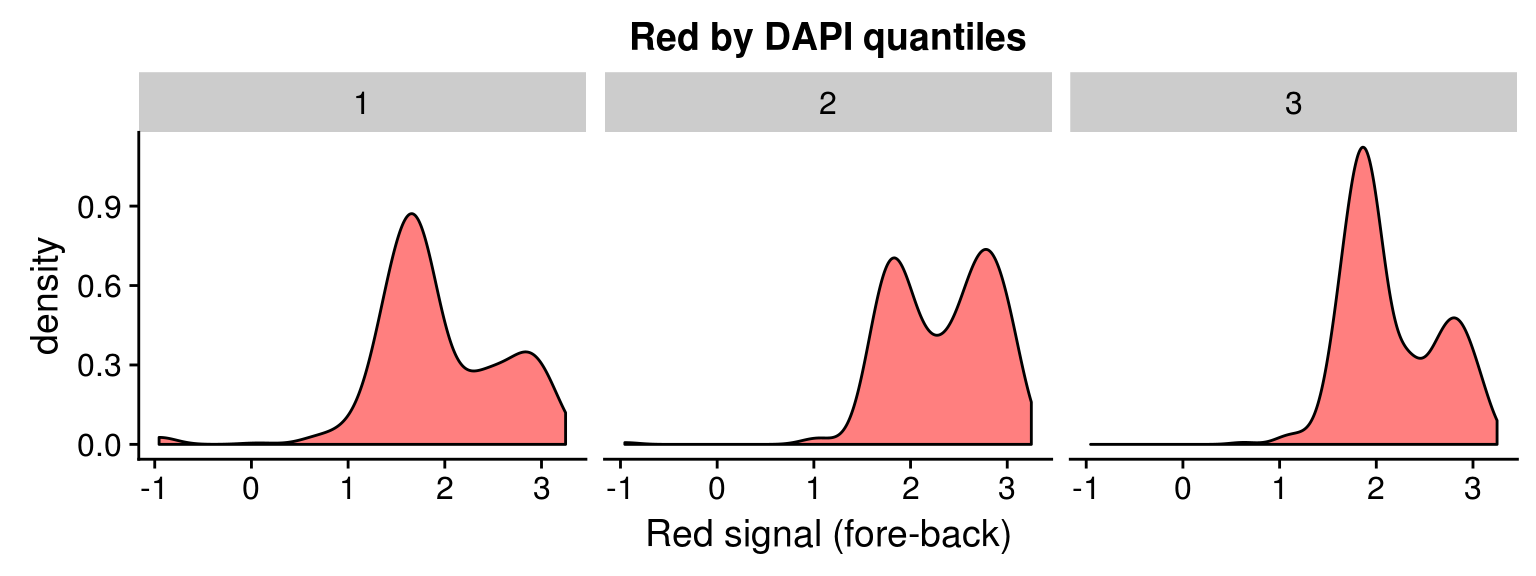
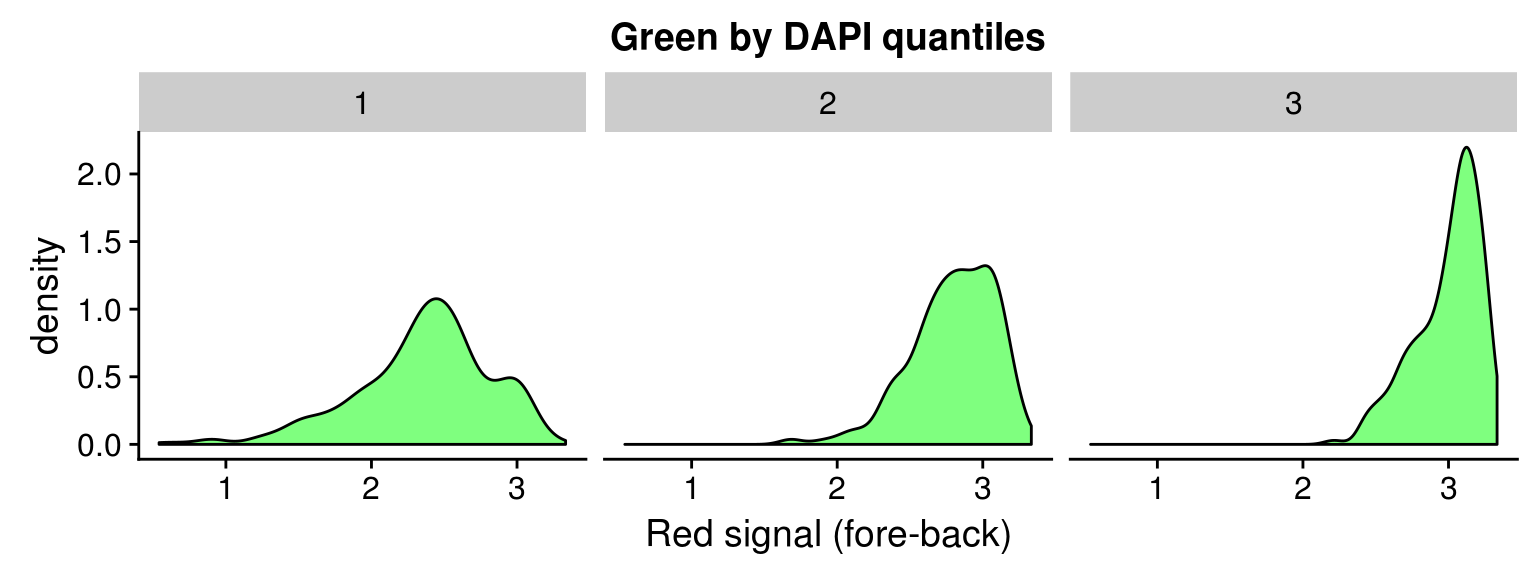
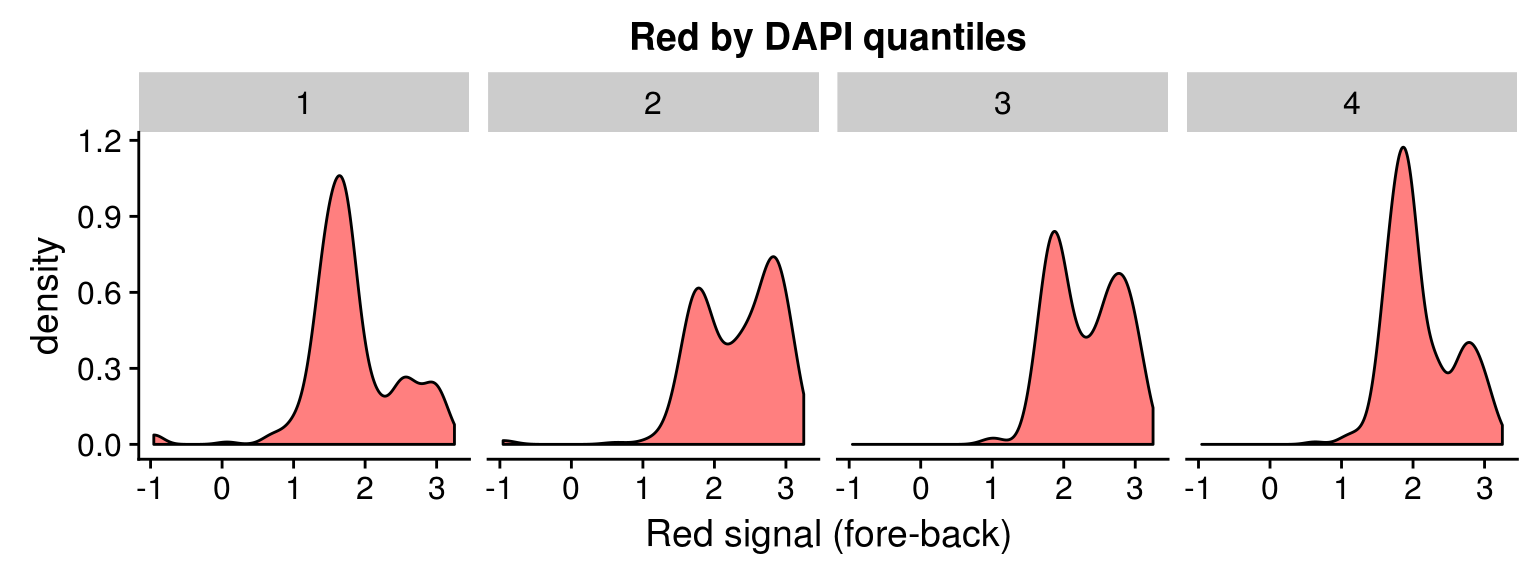
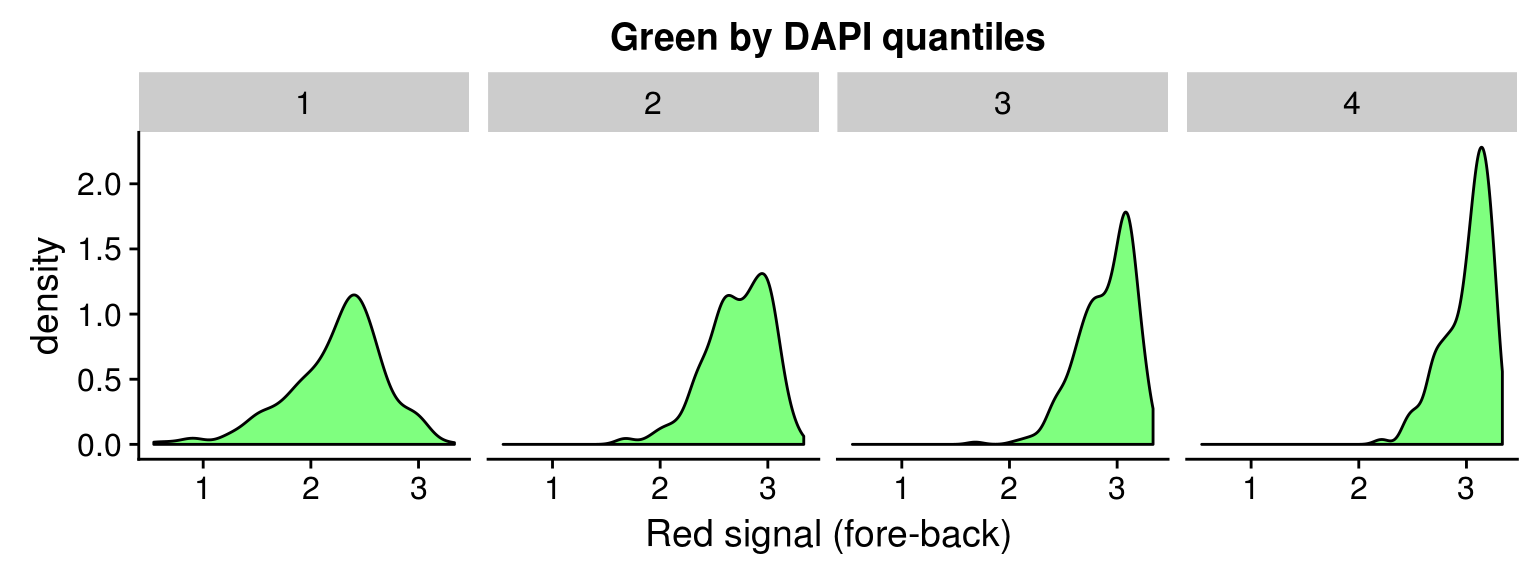
Density distribution</h2>
<div id="dapi-3-quantiles-across-plates" class="section level3">
<h3>DAPI 3 quantiles across plates</h3>
<p><img src="figure/images-qc-followup.Rmd/unnamed-chunk-11-1.png" width="768" style="display: block; margin: auto;" /><img src="figure/images-qc-followup.Rmd/unnamed-chunk-11-2.png" width="768" style="display: block; margin: auto;" /></p>
</div>
<div id="dapi-4-quantiles-across-plates" class="section level3">
<h3>DAPI 4 quantiles across plates</h3>
<p><img src="figure/images-qc-followup.Rmd/unnamed-chunk-12-1.png" width="768" style="display: block; margin: auto;" /><img src="figure/images-qc-followup.Rmd/unnamed-chunk-12-2.png" width="768" style="display: block; margin: auto;" /></p>
<hr />
</div>
</div>
<div id="session-information" class="section level2">
<h2>Session information</h2>
<!-- Insert the session information into the document -->
<pre class="r"><code>sessionInfo()</code></pre>
<pre><code>R version 3.4.1 (2017-06-30)
Platform: x86_64-pc-linux-gnu (64-bit)
Running under: Scientific Linux 7.2 (Nitrogen)

Matrix products: default
BLAS: /home/joycehsiao/miniconda3/envs/fucci-seq/lib/R/lib/libRblas.so
LAPACK: /home/joycehsiao/miniconda3/envs/fucci-seq/lib/R/lib/libRlapack.so

locale:
 [1] LC_CTYPE=en_US.UTF-8       LC_NUMERIC=C              
 [3] LC_TIME=en_US.UTF-8        LC_COLLATE=en_US.UTF-8    
 [5] LC_MONETARY=en_US.UTF-8    LC_MESSAGES=en_US.UTF-8   
 [7] LC_PAPER=en_US.UTF-8       LC_NAME=C                 
 [9] LC_ADDRESS=C               LC_TELEPHONE=C            
[11] LC_MEASUREMENT=en_US.UTF-8 LC_IDENTIFICATION=C       

attached base packages:
[1] stats     graphics  grDevices utils     datasets  methods   base     

other attached packages:
[1] RColorBrewer_1.1-2 wesanderson_0.3.2  cowplot_0.8.0     
[4] ggplot2_2.2.1      dplyr_0.7.0       

loaded via a namespace (and not attached):
 [1] Rcpp_0.12.14     knitr_1.16       magrittr_1.5     munsell_0.4.3   
 [5] colorspace_1.3-2 R6_2.2.0         rlang_0.1.2      stringr_1.2.0   
 [9] plyr_1.8.4       tools_3.4.1      grid_3.4.1       gtable_0.2.0    
[13] git2r_0.19.0     htmltools_0.3.6  yaml_2.1.14      lazyeval_0.2.0  
[17] rprojroot_1.2    digest_0.6.12    assertthat_0.1   tibble_1.3.3    
[21] glue_1.1.1       evaluate_0.10.1  rmarkdown_1.6    labeling_0.3    
[25] stringi_1.1.2    compiler_3.4.1   scales_0.4.1     backports_1.0.5 </code></pre>
</div>

<!-- Adjust MathJax settings so that all math formulae are shown using
TeX fonts only; see
http://docs.mathjax.org/en/latest/configuration.html.  This will make
the presentation more consistent at the cost of the webpage sometimes
taking slightly longer to load. Note that this only works because the
footer is added to webpages before the MathJax javascript. -->
<script type="text/x-mathjax-config">
  MathJax.Hub.Config({
    "HTML-CSS": { availableFonts: ["TeX"] }
  });
</script>

<hr>
<p>
    This <a href="http://rmarkdown.rstudio.com">R Markdown</a> site was created with <a href="https://github.com/jdblischak/workflowr">workflowr</a>
</p>
<hr>

<!-- To enable disqus, uncomment the section below and provide your disqus_shortname -->

<!-- disqus
  <div id="disqus_thread"></div>
    <script type="text/javascript">
        /* * * CONFIGURATION VARIABLES: EDIT BEFORE PASTING INTO YOUR WEBPAGE * * */
        var disqus_shortname = 'rmarkdown'; // required: replace example with your forum shortname

        /* * * DON'T EDIT BELOW THIS LINE * * */
        (function() {
            var dsq = document.createElement('script'); dsq.type = 'text/javascript'; dsq.async = true;
            dsq.src = '//' + disqus_shortname + '.disqus.com/embed.js';
            (document.getElementsByTagName('head')[0] || document.getElementsByTagName('body')[0]).appendChild(dsq);
        })();
    </script>
    <noscript>Please enable JavaScript to view the <a href="http://disqus.com/?ref_noscript">comments powered by Disqus.</a></noscript>
    <a href="http://disqus.com" class="dsq-brlink">comments powered by <span class="logo-disqus">Disqus</span></a>
-->


</div>
</div>

</div>

<script>

// add bootstrap table styles to pandoc tables
function bootstrapStylePandocTables() {
  $('tr.header').parent('thead').parent('table').addClass('table table-condensed');
}
$(document).ready(function () {
  bootstrapStylePandocTables();
});


</script>

<!-- dynamically load mathjax for compatibility with self-contained -->
<script>
  (function () {
    var script = document.createElement("script");
    script.type = "text/javascript";
    script.src  = "https://mathjax.rstudio.com/latest/MathJax.js?config=TeX-AMS-MML_HTMLorMML";
    document.getElementsByTagName("head")[0].appendChild(script);
  })();
</script>

</body>
</html>