<!DOCTYPE html>

<html xmlns="http://www.w3.org/1999/xhtml">

<head>

<meta charset="utf-8" />
<meta http-equiv="Content-Type" content="text/html; charset=utf-8" />
<meta name="generator" content="pandoc" />


<meta name="author" content="Joyce Hsiao" />


<title>Classify cells based on FUCCI using mixture modeling</title>

<script src="site_libs/jquery-1.11.3/jquery.min.js"></script>
<meta name="viewport" content="width=device-width, initial-scale=1" />
<link href="site_libs/bootstrap-3.3.5/css/cosmo.min.css" rel="stylesheet" />
<script src="site_libs/bootstrap-3.3.5/js/bootstrap.min.js"></script>
<script src="site_libs/bootstrap-3.3.5/shim/html5shiv.min.js"></script>
<script src="site_libs/bootstrap-3.3.5/shim/respond.min.js"></script>
<script src="site_libs/jqueryui-1.11.4/jquery-ui.min.js"></script>
<link href="site_libs/tocify-1.9.1/jquery.tocify.css" rel="stylesheet" />
<script src="site_libs/tocify-1.9.1/jquery.tocify.js"></script>
<script src="site_libs/navigation-1.1/tabsets.js"></script>
<link href="site_libs/highlightjs-9.12.0/textmate.css" rel="stylesheet" />
<script src="site_libs/highlightjs-9.12.0/highlight.js"></script>
<link href="site_libs/font-awesome-4.5.0/css/font-awesome.min.css" rel="stylesheet" />

<style type="text/css">code{white-space: pre;}</style>
<style type="text/css">
  pre:not([class]) {
    background-color: white;
  }
</style>
<script type="text/javascript">
if (window.hljs) {
  hljs.configure({languages: []});
  hljs.initHighlightingOnLoad();
  if (document.readyState && document.readyState === "complete") {
    window.setTimeout(function() { hljs.initHighlighting(); }, 0);
  }
}
</script>


<style type="text/css">
h1 {
  font-size: 34px;
}
h1.title {
  font-size: 38px;
}
h2 {
  font-size: 30px;
}
h3 {
  font-size: 24px;
}
h4 {
  font-size: 18px;
}
h5 {
  font-size: 16px;
}
h6 {
  font-size: 12px;
}
.table th:not([align]) {
  text-align: left;
}
</style>


</head>

<body>

<style type = "text/css">
.main-container {
  max-width: 940px;
  margin-left: auto;
  margin-right: auto;
}
code {
  color: inherit;
  background-color: rgba(0, 0, 0, 0.04);
}
img {
  max-width:100%;
  height: auto;
}
.tabbed-pane {
  padding-top: 12px;
}
button.code-folding-btn:focus {
  outline: none;
}
</style>


<style type="text/css">
/* padding for bootstrap navbar */
body {
  padding-top: 51px;
  padding-bottom: 40px;
}
/* offset scroll position for anchor links (for fixed navbar)  */
.section h1 {
  padding-top: 56px;
  margin-top: -56px;
}

.section h2 {
  padding-top: 56px;
  margin-top: -56px;
}
.section h3 {
  padding-top: 56px;
  margin-top: -56px;
}
.section h4 {
  padding-top: 56px;
  margin-top: -56px;
}
.section h5 {
  padding-top: 56px;
  margin-top: -56px;
}
.section h6 {
  padding-top: 56px;
  margin-top: -56px;
}
</style>

<script>
// manage active state of menu based on current page
$(document).ready(function () {
  // active menu anchor
  href = window.location.pathname
  href = href.substr(href.lastIndexOf('/') + 1)
  if (href === "")
    href = "index.html";
  var menuAnchor = $('a[href="' + href + '"]');

  // mark it active
  menuAnchor.parent().addClass('active');

  // if it's got a parent navbar menu mark it active as well
  menuAnchor.closest('li.dropdown').addClass('active');
});
</script>


<div class="container-fluid main-container">

<!-- tabsets -->
<script>
$(document).ready(function () {
  window.buildTabsets("TOC");
});
</script>

<!-- code folding -->


<script>
$(document).ready(function ()  {

    // move toc-ignore selectors from section div to header
    $('div.section.toc-ignore')
        .removeClass('toc-ignore')
        .children('h1,h2,h3,h4,h5').addClass('toc-ignore');

    // establish options
    var options = {
      selectors: "h1,h2,h3",
      theme: "bootstrap3",
      context: '.toc-content',
      hashGenerator: function (text) {
        return text.replace(/[.\\/?&!#<>]/g, '').replace(/\s/g, '_').toLowerCase();
      },
      ignoreSelector: ".toc-ignore",
      scrollTo: 0
    };
    options.showAndHide = true;
    options.smoothScroll = true;

    // tocify
    var toc = $("#TOC").tocify(options).data("toc-tocify");
});
</script>

<style type="text/css">

#TOC {
  margin: 25px 0px 20px 0px;
}
@media (max-width: 768px) {
#TOC {
  position: relative;
  width: 100%;
}
}


.toc-content {
  padding-left: 30px;
  padding-right: 40px;
}

div.main-container {
  max-width: 1200px;
}

div.tocify {
  width: 20%;
  max-width: 260px;
  max-height: 85%;
}

@media (min-width: 768px) and (max-width: 991px) {
  div.tocify {
    width: 25%;
  }
}

@media (max-width: 767px) {
  div.tocify {
    width: 100%;
    max-width: none;
  }
}

.tocify ul, .tocify li {
  line-height: 20px;
}

.tocify-subheader .tocify-item {
  font-size: 0.90em;
  padding-left: 25px;
  text-indent: 0;
}

.tocify .list-group-item {
  border-radius: 0px;
}


</style>

<!-- setup 3col/9col grid for toc_float and main content  -->
<div class="row-fluid">
<div class="col-xs-12 col-sm-4 col-md-3">
<div id="TOC" class="tocify">
</div>
</div>

<div class="toc-content col-xs-12 col-sm-8 col-md-9">


<div class="navbar navbar-default  navbar-fixed-top" role="navigation">
  <div class="container">
    <div class="navbar-header">
      <button type="button" class="navbar-toggle collapsed" data-toggle="collapse" data-target="#navbar">
        <span class="icon-bar"></span>
        <span class="icon-bar"></span>
        <span class="icon-bar"></span>
      </button>
      <a class="navbar-brand" href="index.html">fucci-seq</a>
    </div>
    <div id="navbar" class="navbar-collapse collapse">
      <ul class="nav navbar-nav">
        <li>
  <a href="index.html">Home</a>
</li>
<li>
  <a href="about.html">About</a>
</li>
<li>
  <a href="license.html">License</a>
</li>
      </ul>
      <ul class="nav navbar-nav navbar-right">
        <li>
  <a href="https://github.com/jdblischak/fucci-seq">
    <span class="fa fa-github"></span>
     
  </a>
</li>
      </ul>
    </div><!--/.nav-collapse -->
  </div><!--/.container -->
</div><!--/.navbar -->
<!-- Add a small amount of space between sections. -->
<style type="text/css">
div.section {
  padding-top: 12px;
}
</style>

<div class="fluid-row" id="header">


<h1 class="title toc-ignore">Classify cells based on FUCCI using mixture modeling</h1>
<h4 class="author"><em>Joyce Hsiao</em></h4>

</div>


<!-- The file analysis/chunks.R contains chunks that define default settings
shared across the workflowr files. -->
<!-- Update knitr chunk options -->
<!-- Insert the date the file was last updated -->
<p><strong>Last updated:</strong> 2018-01-26</p>
<!-- Insert the code version (Git commit SHA1) if Git repository exists and R
 package git2r is installed -->
<p><strong>Code version:</strong> 6aa2392</p>
<hr />
<div id="overviewresults" class="section level2">
<h2>Overview/Results</h2>
<p>I tried normal-based mixture modeling on the data that have already been filtered for quality single cells using both RNA-sequencing and microscopy data. The eventual goal is to select a subset of cells that are “representative” of each cell cycle phase.</p>
<p>I used <code>Mclust</code> package which fits mixtures of normal distributions with a variety of covariance structure. I allowed Mclust to fit all possible covariance structures and select the best-fit structure as the final result.</p>
<p><span class="math inline">\(~\)</span></p>
<p>Results:</p>
<ol style="list-style-type: decimal">
<li><p>First, note that the 990 samples in this dataset passed microscopy filters and sequencing data filters. Microscopy filters based on DAPI intensities exlude samples that are detected with low or no DNA content and also samples with more than one nucleus. In other words, microscopy filters exclude cells that are in G0 phase, which typically have low DNA content. In addition, microscopy filters based on GFP and RFP exlude samples that are either in G0 phase or in M phase.</p></li>
<li><p>
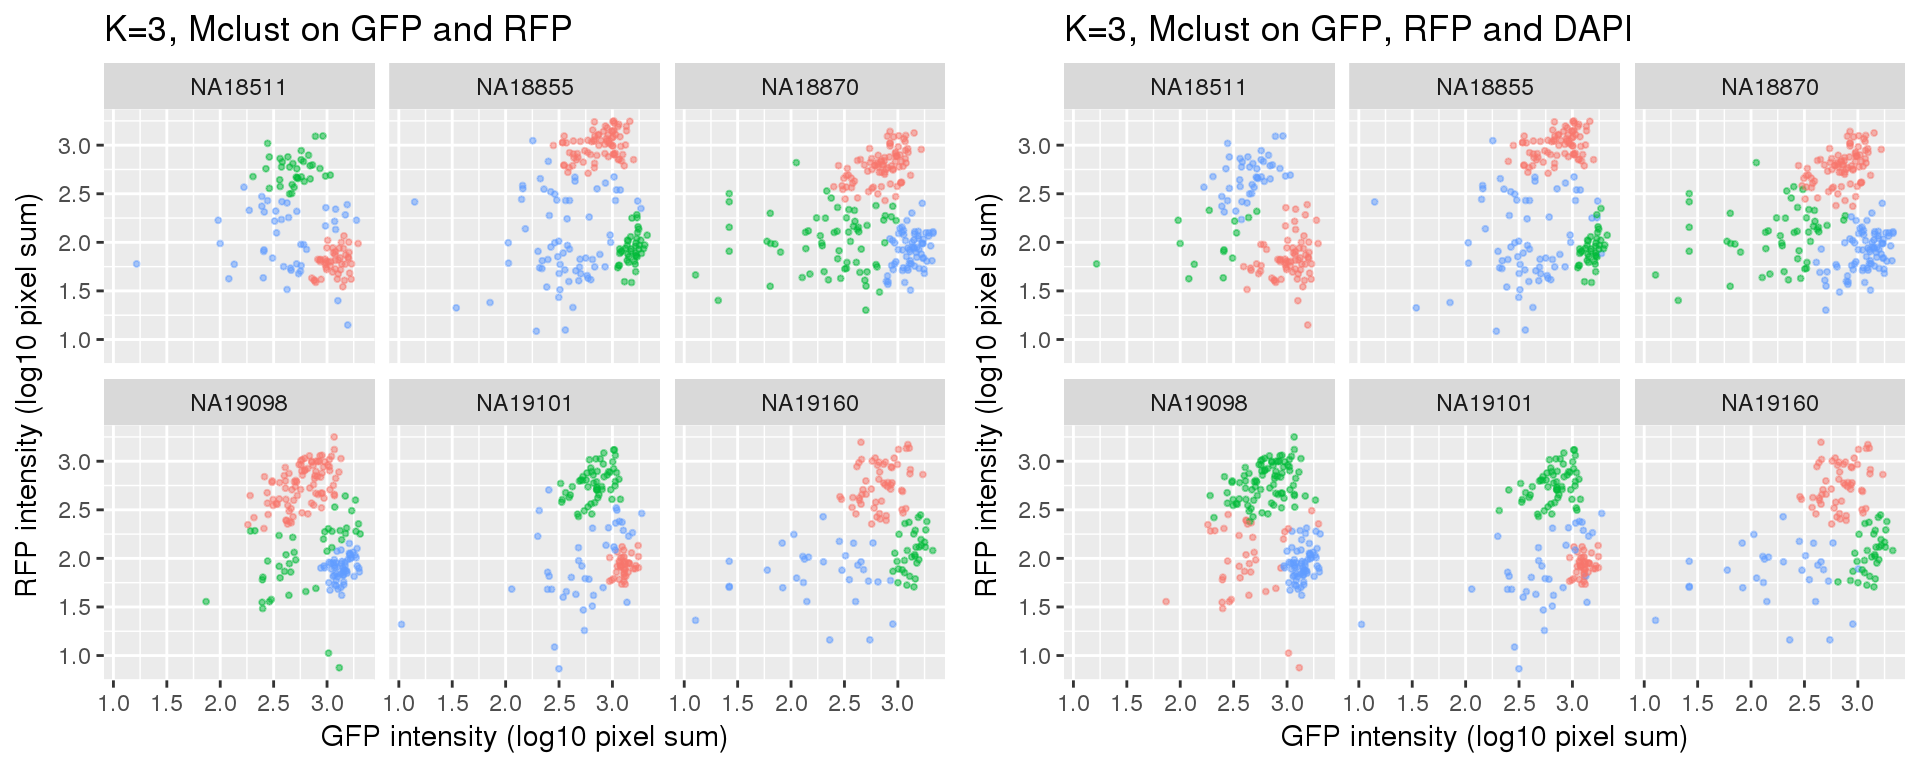
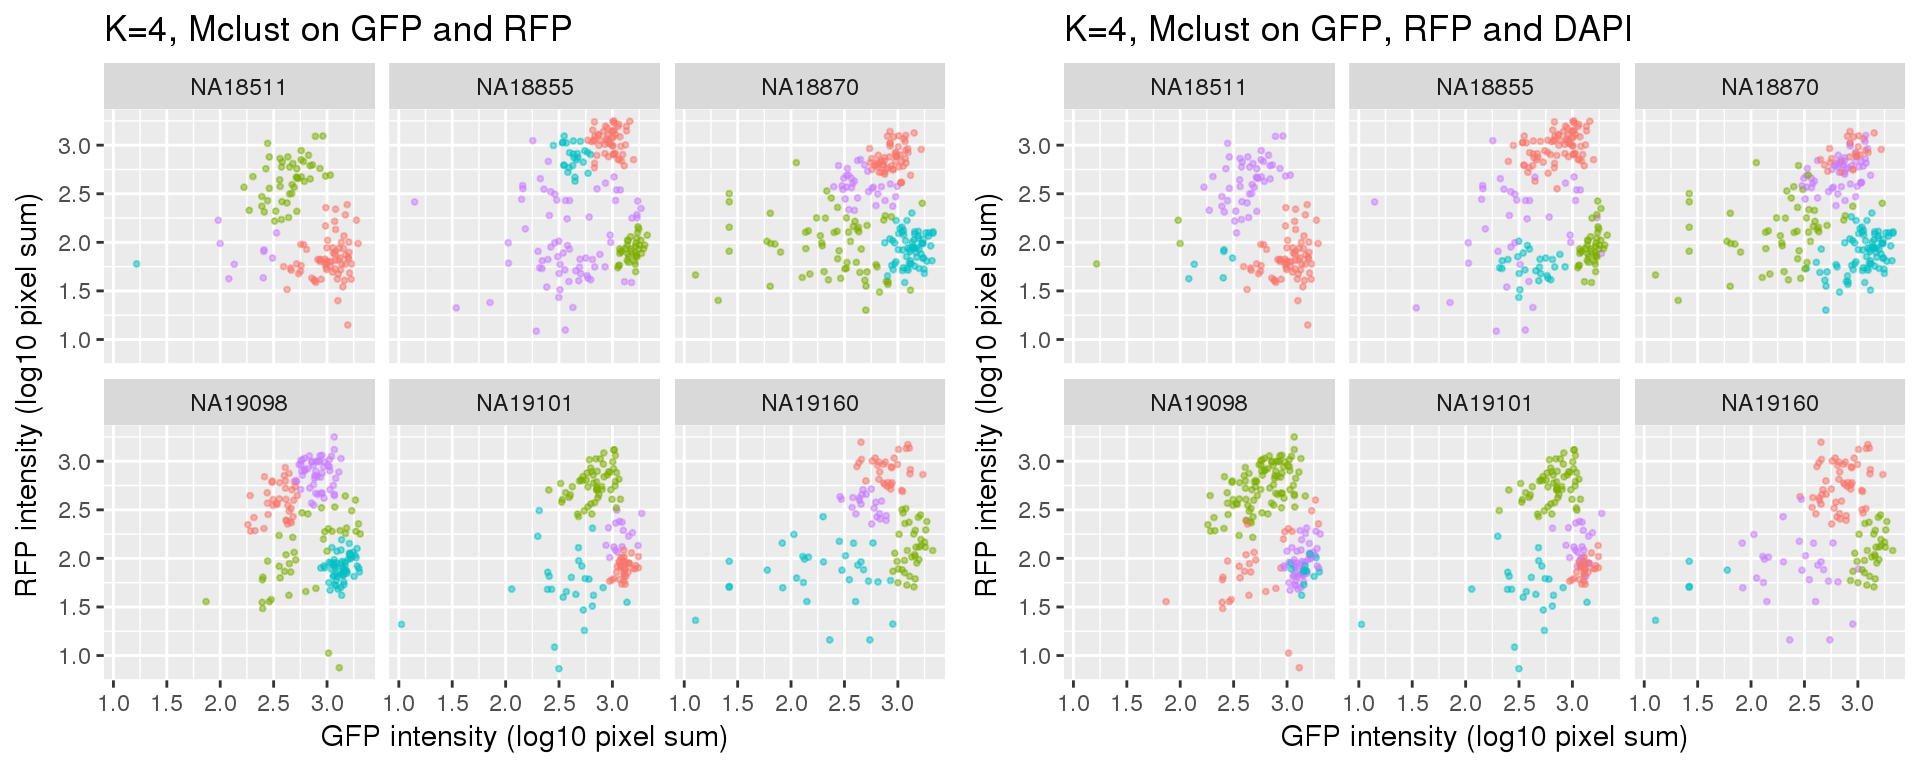
Standard flow cytometry analysis using GFP and RFP can classify cells into G1, G1/S, and G2/M. We fit k=3 and k=4 using PAM on GFP and RFP and also on GFP, RFP, and DAPI.</p></li>
<li><p>Results for either k=3 or k=4 didn’t change after adding DAPI measurements.</p></li>
<li><p>
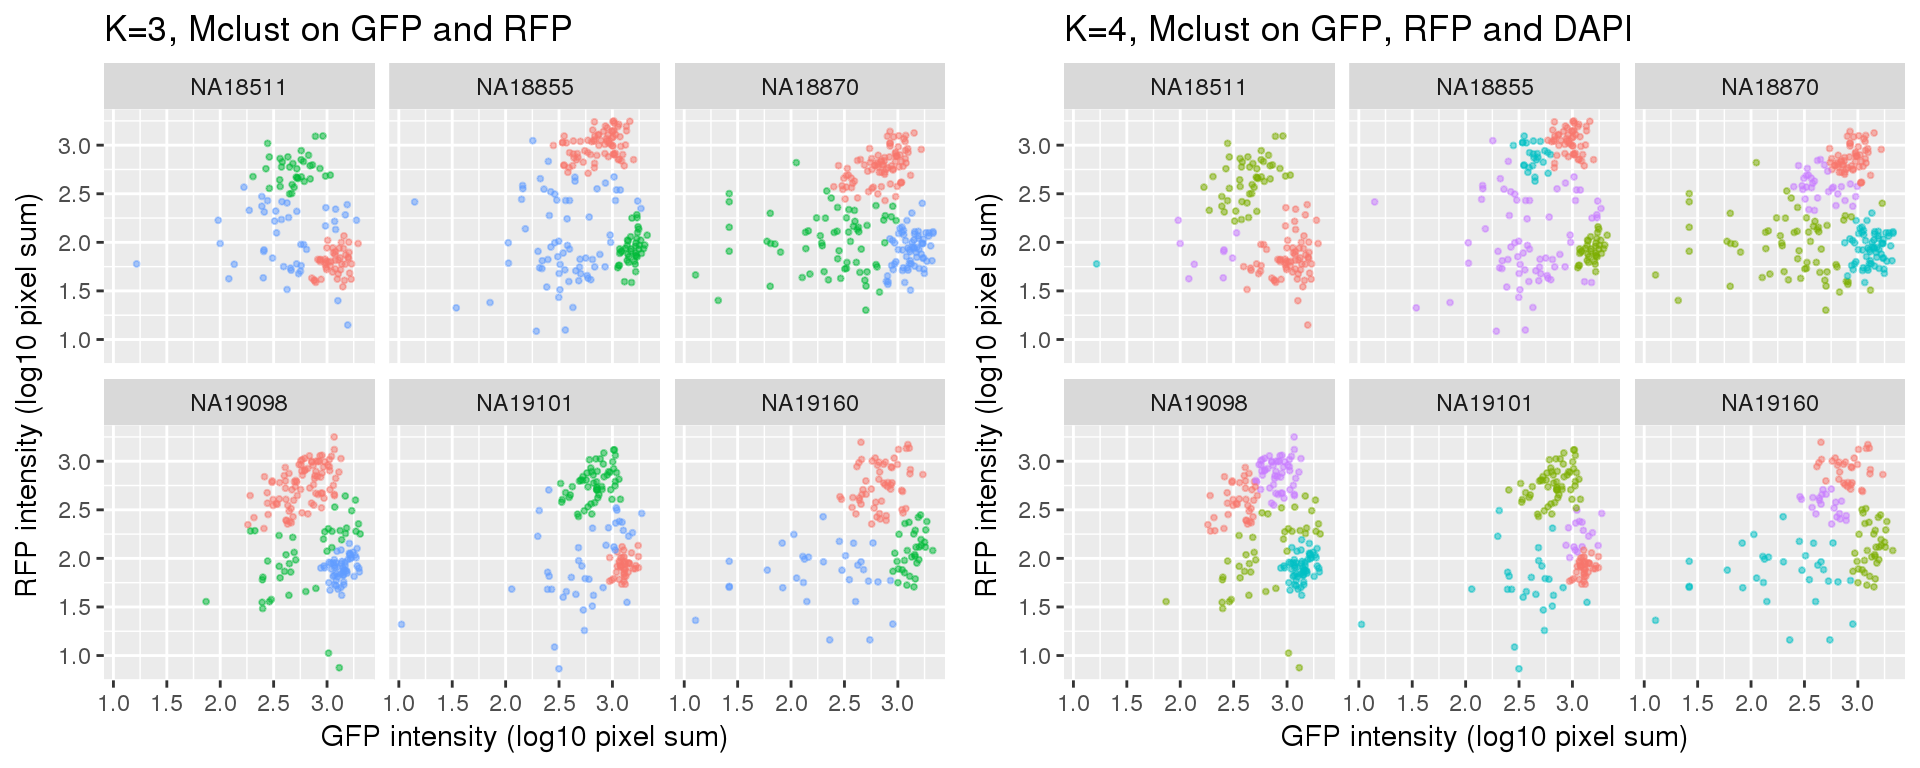
Results of partitions between k=3 and k=4: I am mainly interested in k=3 case. I will use k=4 results in the quality checks for k=3 results. In brief, I’ll look at cell cycle gene expression profiles of both of these cases. If the additional partition in k=4 is similar to one of the other three partitions, then we can say k=3 fits better.</p></li>
<li><p>After we decide on the clustering of cells, we can compute silhouette index for each cell to determine how well each cell fits into its cluster. Then, we can use silhouette index to choose the most “represented cells” from each cluster, for example selecting cells that are the closet to cluster centers.</p></li>
<li><p>Compared to the <a href="https://jdblischak.github.io/fucci-seq/images-pam.html">resutls using PAM</a>. normal-based mixture modeling results are highly influenced by outliers, and the clusters can overlap in the density region of GFP by RFP. These results make the normal-based mixture modeling results undesirable for classifying cell cycle phase. However, it remains to be seen that which of these two methods provide a better set of <em>representative</em> cells of cell cycle phases.</p></li>
</ol>
<hr />
</div>
<div id="data-and-packages" class="section level2">
<h2>Data and packages</h2>
<p>Packages</p>
<pre class="r"><code>library(Biobase)
library(ggplot2)
library(cowplot)
library(mclust)
library(data.table)</code></pre>
<p>Load data</p>
<pre class="r"><code>df &lt;- readRDS(file=&quot;../data/eset-filtered.rds&quot;)
pdata &lt;- pData(df)
fdata &lt;- fData(df)

# select endogeneous genes
counts &lt;- exprs(df)[grep(&quot;ERCC&quot;, rownames(df), invert=TRUE), ]

# cpm normalization
log2cpm &lt;- log2(t(t(counts+1)*(10^6)/colSums(counts)))</code></pre>
<p>select cell cycle genes</p>
<pre class="r"><code>cellcycle &lt;- readRDS(&quot;../data/cellcycle-genes-previous-studies/rds/macosko-2017.rds&quot;)
which_cc &lt;- which(rownames(log2cpm) %in% cellcycle$ensembl)

log2cpm_cc &lt;- log2cpm[which_cc, ]</code></pre>
<hr />
</div>
<div id="analysis" class="section level2">
<h2>Analysis</h2>
<p>Fitting mclust for cells using only green and red intensity measurements.</p>
<pre class="r"><code>ints &lt;- with(pdata, data.frame(rfp.median.log10sum,
                               gfp.median.log10sum,
                               dapi.median.log10sum))
ints &lt;- data.frame(ints, 
                   chip_id = as.factor(pdata$chip_id))

k_list &lt;- c(3:4)

fit_green_red &lt;- lapply(k_list, function(k) {
  fit &lt;- lapply(1:uniqueN(ints$chip_id), function(i) {
    df_sub &lt;- subset(ints, chip_id==unique(chip_id)[i], 
                     select = -c(chip_id, dapi.median.log10sum))
    fit_sub &lt;- Mclust(df_sub, G=k)
    return(fit_sub)
  })
  names(fit) &lt;- unique(ints$chip_id)
  return(fit)
})
names(fit_green_red) &lt;- paste0(&quot;k&quot;, k_list)

fit_green_red_plot &lt;- vector(&quot;list&quot;, length(fit_green_red))
for (k in c(1:length(k_list))) {
  pp &lt;- do.call(rbind, lapply(1:uniqueN(ints$chip_id), function(i) {
    df_sub &lt;- subset(ints, chip_id==unique(chip_id)[i])
    df_sub &lt;- data.frame(df_sub, cluster=as.factor(fit_green_red[[k]][[i]]$classification))
    return(df_sub)
  }))
  fit_green_red_plot[[k]] &lt;- pp
}</code></pre>
<p>Fitting for cells using all three intensity measurements.</p>
<pre class="r"><code>fit_green_red_dapi &lt;- lapply(k_list, function(k) {
  fit &lt;- lapply(1:uniqueN(ints$chip_id), function(i) {
    df_sub &lt;- subset(ints, chip_id==unique(chip_id)[i], 
                     select = -chip_id)
    fit_sub &lt;- Mclust(df_sub, G=k)
    return(fit_sub)
  })
  names(fit) &lt;- unique(ints$chip_id)
  return(fit)
})
names(fit_green_red_dapi) &lt;- paste0(&quot;k&quot;, k_list)

fit_green_red_dapi_plot &lt;- vector(&quot;list&quot;, length(fit_green_red_dapi))
for (k in c(1:length(k_list))) {
  pp &lt;- do.call(rbind, lapply(1:uniqueN(ints$chip_id), function(i) {
    df_sub &lt;- subset(ints, chip_id==unique(chip_id)[i])
    df_sub &lt;- data.frame(df_sub, cluster=as.factor(fit_green_red_dapi[[k]][[i]]$classification))
    return(df_sub)
  }))
  fit_green_red_dapi_plot[[k]] &lt;- pp
}</code></pre>
<hr />
</div>
<div id="results" class="section level2">
<h2>Results</h2>
<p><strong>k=3</strong></p>
<p><img src="figure/images-mclust.Rmd/unnamed-chunk-6-1.png" width="960" style="display: block; margin: auto;" /></p>
<p><strong>k=4</strong></p>
<p><img src="figure/images-mclust.Rmd/unnamed-chunk-7-1.png" width="960" style="display: block; margin: auto;" /></p>
<p><strong>k=3 versus k=4</strong></p>
<p><img src="figure/images-mclust.Rmd/unnamed-chunk-8-1.png" width="960" style="display: block; margin: auto;" /></p>
<hr />
</div>
<div id="session-information" class="section level2">
<h2>Session information</h2>
<pre><code>R version 3.4.1 (2017-06-30)
Platform: x86_64-redhat-linux-gnu (64-bit)
Running under: Scientific Linux 7.2 (Nitrogen)

Matrix products: default
BLAS/LAPACK: /usr/lib64/R/lib/libRblas.so

locale:
 [1] LC_CTYPE=en_US.UTF-8       LC_NUMERIC=C              
 [3] LC_TIME=en_US.UTF-8        LC_COLLATE=en_US.UTF-8    
 [5] LC_MONETARY=en_US.UTF-8    LC_MESSAGES=en_US.UTF-8   
 [7] LC_PAPER=en_US.UTF-8       LC_NAME=C                 
 [9] LC_ADDRESS=C               LC_TELEPHONE=C            
[11] LC_MEASUREMENT=en_US.UTF-8 LC_IDENTIFICATION=C       

attached base packages:
[1] parallel  stats     graphics  grDevices utils     datasets  methods  
[8] base     

other attached packages:
[1] data.table_1.10.4-3 mclust_5.4          cowplot_0.9.2      
[4] ggplot2_2.2.1       Biobase_2.38.0      BiocGenerics_0.24.0

loaded via a namespace (and not attached):
 [1] Rcpp_0.12.14     knitr_1.17       magrittr_1.5     munsell_0.4.3   
 [5] colorspace_1.3-2 rlang_0.1.4      stringr_1.2.0    plyr_1.8.4      
 [9] tools_3.4.1      grid_3.4.1       gtable_0.2.0     git2r_0.20.0    
[13] htmltools_0.3.6  yaml_2.1.16      lazyeval_0.2.1   rprojroot_1.3-1 
[17] digest_0.6.13    tibble_1.3.4     evaluate_0.10.1  rmarkdown_1.8   
[21] labeling_0.3     stringi_1.1.6    compiler_3.4.1   scales_0.5.0    
[25] backports_1.1.2 </code></pre>
</div>

<!-- Adjust MathJax settings so that all math formulae are shown using
TeX fonts only; see
http://docs.mathjax.org/en/latest/configuration.html.  This will make
the presentation more consistent at the cost of the webpage sometimes
taking slightly longer to load. Note that this only works because the
footer is added to webpages before the MathJax javascript. -->
<script type="text/x-mathjax-config">
  MathJax.Hub.Config({
    "HTML-CSS": { availableFonts: ["TeX"] }
  });
</script>

<hr>
<p>
    This <a href="http://rmarkdown.rstudio.com">R Markdown</a> site was created with <a href="https://github.com/jdblischak/workflowr">workflowr</a>
</p>
<hr>

<!-- To enable disqus, uncomment the section below and provide your disqus_shortname -->

<!-- disqus
  <div id="disqus_thread"></div>
    <script type="text/javascript">
        /* * * CONFIGURATION VARIABLES: EDIT BEFORE PASTING INTO YOUR WEBPAGE * * */
        var disqus_shortname = 'rmarkdown'; // required: replace example with your forum shortname

        /* * * DON'T EDIT BELOW THIS LINE * * */
        (function() {
            var dsq = document.createElement('script'); dsq.type = 'text/javascript'; dsq.async = true;
            dsq.src = '//' + disqus_shortname + '.disqus.com/embed.js';
            (document.getElementsByTagName('head')[0] || document.getElementsByTagName('body')[0]).appendChild(dsq);
        })();
    </script>
    <noscript>Please enable JavaScript to view the <a href="http://disqus.com/?ref_noscript">comments powered by Disqus.</a></noscript>
    <a href="http://disqus.com" class="dsq-brlink">comments powered by <span class="logo-disqus">Disqus</span></a>
-->


</div>
</div>

</div>

<script>

// add bootstrap table styles to pandoc tables
function bootstrapStylePandocTables() {
  $('tr.header').parent('thead').parent('table').addClass('table table-condensed');
}
$(document).ready(function () {
  bootstrapStylePandocTables();
});


</script>

<!-- dynamically load mathjax for compatibility with self-contained -->
<script>
  (function () {
    var script = document.createElement("script");
    script.type = "text/javascript";
    script.src  = "https://mathjax.rstudio.com/latest/MathJax.js?config=TeX-AMS-MML_HTMLorMML";
    document.getElementsByTagName("head")[0].appendChild(script);
  })();
</script>

</body>
</html>