alkati_subsampling_simulations
Haider Inam
1/31/2019
Last updated: 2019-02-11
workflowr checks: (Click a bullet for more information)-
✔ R Markdown file: up-to-date
Great! Since the R Markdown file has been committed to the Git repository, you know the exact version of the code that produced these results.
-
✔ Environment: empty
Great job! The global environment was empty. Objects defined in the global environment can affect the analysis in your R Markdown file in unknown ways. For reproduciblity it’s best to always run the code in an empty environment.
-
✔ Seed:
set.seed(20190211)The command
set.seed(20190211)was run prior to running the code in the R Markdown file. Setting a seed ensures that any results that rely on randomness, e.g. subsampling or permutations, are reproducible. -
✔ Session information: recorded
Great job! Recording the operating system, R version, and package versions is critical for reproducibility.
-
Great! You are using Git for version control. Tracking code development and connecting the code version to the results is critical for reproducibility. The version displayed above was the version of the Git repository at the time these results were generated.✔ Repository version: 4c89be3
Note that you need to be careful to ensure that all relevant files for the analysis have been committed to Git prior to generating the results (you can usewflow_publishorwflow_git_commit). workflowr only checks the R Markdown file, but you know if there are other scripts or data files that it depends on. Below is the status of the Git repository when the results were generated:
Note that any generated files, e.g. HTML, png, CSS, etc., are not included in this status report because it is ok for generated content to have uncommitted changes.Ignored files: Ignored: .Rproj.user/ Ignored: docs/figure/ Untracked files: Untracked: code/alldata_compiler.R Untracked: code/contab_maker.R Untracked: code/mut_excl_genes_datapoints.R Untracked: code/mut_excl_genes_generator.R Untracked: code/quadratic_solver.R Untracked: code/simresults_generator.R Untracked: data/All_Data_V2.csv Untracked: output/alkati_mtn_pval_fig2B.pdf
Expand here to see past versions:
| File | Version | Author | Date | Message |
|---|---|---|---|---|
| Rmd | 4c89be3 | haiderinam | 2019-02-11 | Publish the initial files for myproject |
Just want to make quick P-value distribution plots for Figure 1C. This is a tiny bit more tricky than previously because right now, my simresults_generator does not look at a bunch of subsample sizes
nsubsamples=12 # maybe this can be removed and instead calculated later.
  nsims<-100 #
  #Positive control 1
  nameposctrl1<-'BRAF'
  #Positive control 1
  nameposctrl2<-'NRAS'
  #Oncogene in Question
  namegene<-'ATI'
  #Mutation Boolean (Y or N)
  mtn<-'N'
  #Name Mutation for Positive Ctrl 1
  nameposctrl1mt<-'V600E'
  #Name of Mutation for Positive Ctrl 2
  nameposctrl2mt<-'Q61L'

  alldata=read.csv("data/All_Data_V2.csv",sep=",",header=T,stringsAsFactors=F)
  nexperiments=7
alldata_comp=alldata_compiler(alldata,nameposctrl1,nameposctrl2,namegene,mtn,"N/A","N/A")[[2]]
genex_replication_prop=alldata_compiler(alldata,nameposctrl1,nameposctrl2,namegene,mtn,"N/A","N/A")[[1]]
simresults_comb=data.frame()
for(subsample_number in c(1:12)){
  nsubsamples=subsample_number
  simresults=simresults_generator(alldata_comp,7)
  simresults_comb=rbind(simresults_comb,simresults) ##ik this is not a good way to do this but whatever
}
simresults_concat=simresults_comb%>%
filter(exp_num%in%c(4))
# simresults_concat=simresults_comb
ggplot(simresults_concat,aes(x=factor(subsample_size),y=-log10(p_val)))+
geom_boxplot(aes(fill=factor(exp_num)))+
cleanup+
guides(fill=F)+
scale_y_continuous(name="-log(P-Value)")+
scale_x_discrete(name="Subsample size")+
# scale_color_manual(values="#E78AC3")+
theme(plot.title = element_text(hjust=.5),
text = element_text(size=26,face="bold"),
axis.title = element_text(face="bold",size="26",color="black"),
axis.text=element_text(face="bold",size="24",color="black"))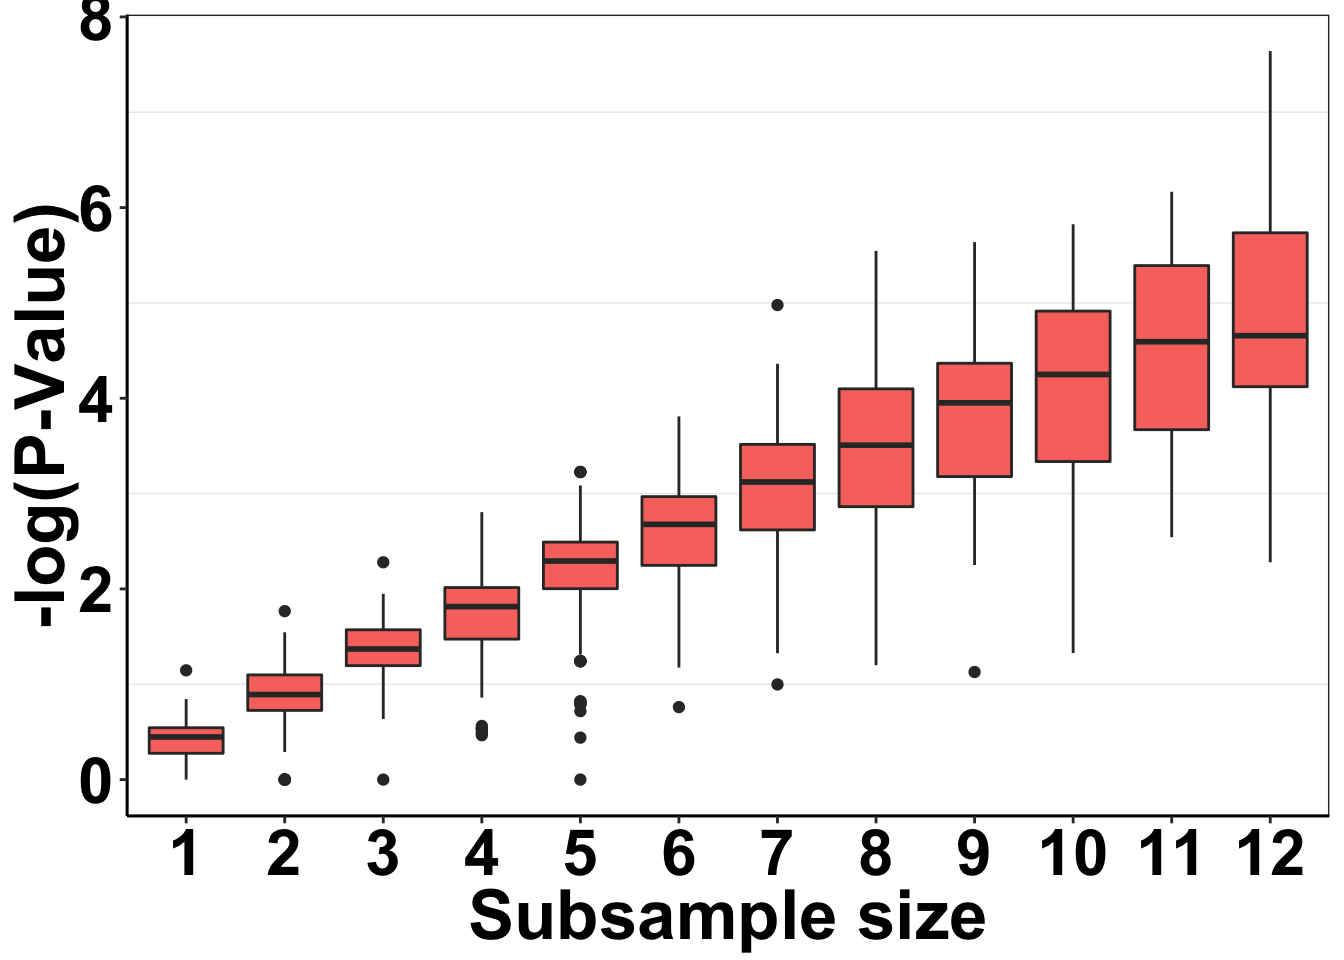
# ggsave("alkati_subsamplesize_pval_fig1c.pdf",width = 10,height = 10,units = "in",useDingbats=F)Doing simulations with mutations
nsubsamples=12 # maybe this can be removed and instead calculated later.
  nsims<-100 #
  #Positive control 1
  nameposctrl1<-'BRAF'
  #Positive control 1
  nameposctrl2<-'NRAS'
  #Oncogene in Question
  namegene<-'ATI'
  #Mutation Boolean (Y or N)
  mtn<-'Y'
  #Name Mutation for Positive Ctrl 1
  nameposctrl1mt<-'V600E'
  #Name of Mutation for Positive Ctrl 2
  nameposctrl2mt<-'Q61L'

  alldata=read.csv("data/All_Data_V2.csv",sep=",",header=T,stringsAsFactors=F)
  nexperiments=7
###For mutation
alldata_comp=alldata_compiler(alldata,nameposctrl1,nameposctrl2,namegene,mtn,nameposctrl1mt,nameposctrl2mt)[[2]]
genex_replication_prop=alldata_compiler(alldata,nameposctrl1,nameposctrl2,namegene,mtn,nameposctrl1mt,nameposctrl2mt)[[1]]
  simresults=simresults_generator(alldata_comp,7)
simresults$mtn='Y'

####For no mutation
mtn='N'
alldata_comp=alldata_compiler(alldata,nameposctrl1,nameposctrl2,namegene,mtn,"N/A","N/A")[[2]]
genex_replication_prop=alldata_compiler(alldata,nameposctrl1,nameposctrl2,namegene,mtn,"N/A","N/A")[[1]]
  simresults_nomtn=simresults_generator(alldata_comp,7)
simresults_nomtn$mtn='N'

simresults=rbind(simresults,simresults_nomtn)
Now doing the p-values for Figure 2b. Will show ati vs braf, ati vs nras, and mutations
simresults[simresults$exp_num==1,]$exp_name="BRAF & ALKATI"
simresults[simresults$exp_num==3,]$exp_name="NRAS & ALKATI"
simresults[simresults$exp_num==4,]$exp_name="BRAF & NRAS"
simresults$exp_name=factor(simresults$exp_name,levels=c("1","5","6","7","BRAF & ALKATI","NRAS & ALKATI","BRAF & NRAS"))
simresults$mtn_tag='N'
simresults[simresults$mtn=='Y',]$mtn_tag="Mutation-specific"
simresults[simresults$mtn=='N',]$mtn_tag="Non mutation-specific"

simresults$mtn_tag=factor(simresults$mtn_tag,levels=c("Non mutation-specific","Mutation-specific"))
simresults_concat=simresults%>%
  filter(exp_num==c(1,3,4))
Warning in exp_num == c(1, 3, 4): longer object length is not a multiple of
shorter object lengthggplot(simresults_concat,aes(x=factor(exp_name),y=-log10(p_val)))+
geom_boxplot(aes(fill=factor(exp_name)))+
facet_wrap(~factor(mtn_tag))+
cleanup+
guides(fill=F)+
scale_y_continuous(name="-log(P-Value)")+
scale_x_discrete(name="Gene Pair")+
scale_fill_brewer(palette = "Set2",name="Gene Pair")+
theme(plot.title = element_text(hjust=.5),
text = element_text(size=26,face="bold"),
axis.title = element_text(face="bold",size="26",color="black"),
axis.text=element_text(face="bold",size="20",color="black"))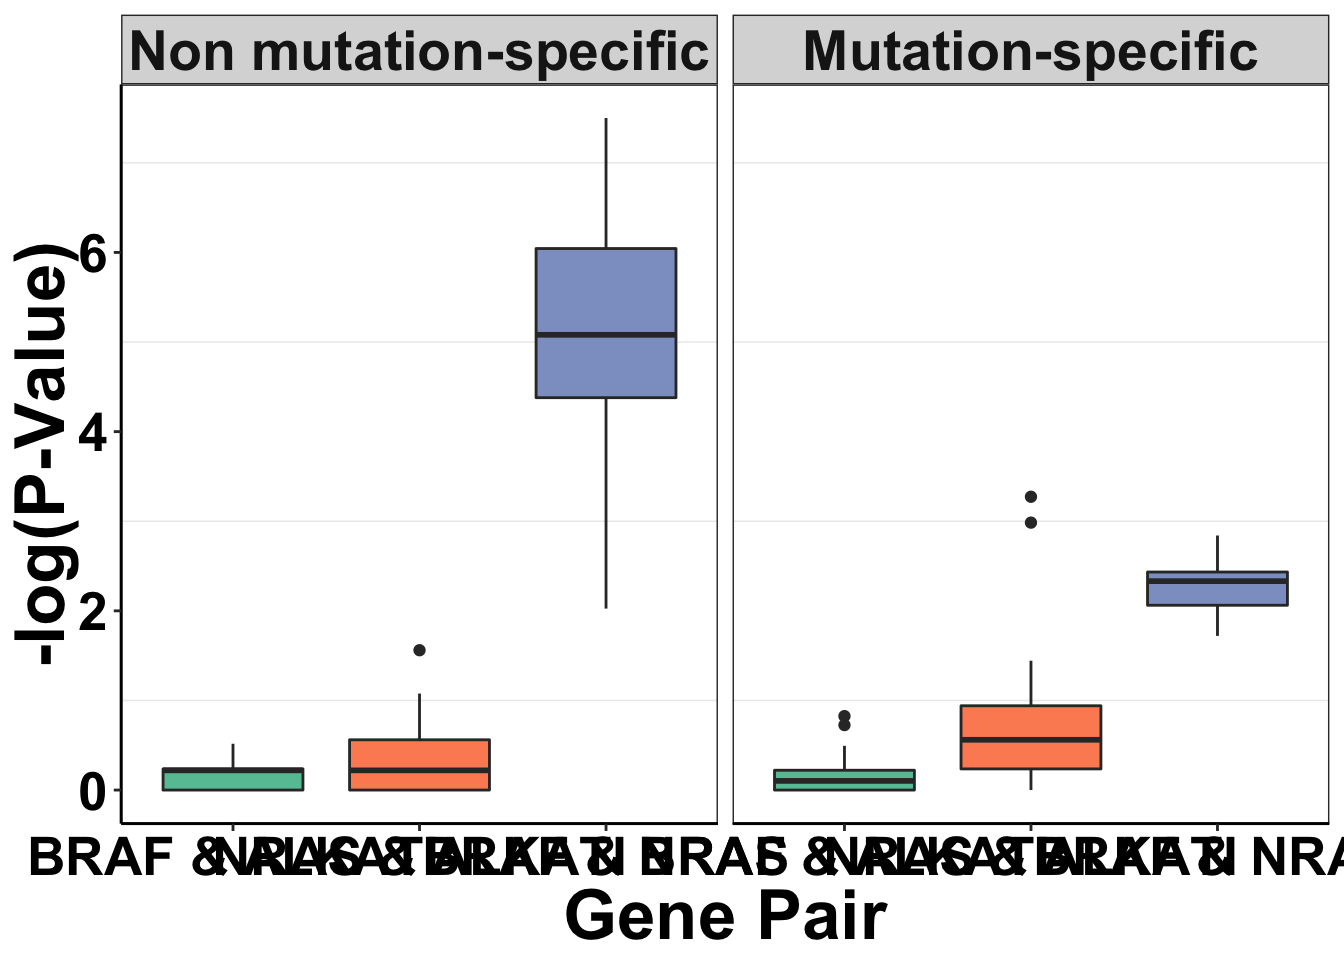
ggsave("output/alkati_mtn_pval_fig2B.pdf",width = 16,height = 10,units = "in",useDingbats=F)Session information
sessionInfo()R version 3.5.2 (2018-12-20)
Platform: x86_64-apple-darwin15.6.0 (64-bit)
Running under: macOS Mojave 10.14.3
Matrix products: default
BLAS: /Library/Frameworks/R.framework/Versions/3.5/Resources/lib/libRblas.0.dylib
LAPACK: /Library/Frameworks/R.framework/Versions/3.5/Resources/lib/libRlapack.dylib
locale:
[1] en_US.UTF-8/en_US.UTF-8/en_US.UTF-8/C/en_US.UTF-8/en_US.UTF-8
attached base packages:
[1] parallel grid stats graphics grDevices utils datasets
[8] methods base
other attached packages:
[1] bindrcpp_0.2.2 ggsignif_0.4.0 usethis_1.4.0
[4] devtools_2.0.1 RColorBrewer_1.1-2 reshape2_1.4.3
[7] ggplot2_3.1.0 doParallel_1.0.14 iterators_1.0.10
[10] foreach_1.4.4 dplyr_0.7.8 VennDiagram_1.6.20
[13] futile.logger_1.4.3 workflowr_1.1.1 tictoc_1.0
[16] knitr_1.21
loaded via a namespace (and not attached):
[1] tidyselect_0.2.5 xfun_0.4 remotes_2.0.2
[4] purrr_0.3.0 colorspace_1.4-0 htmltools_0.3.6
[7] yaml_2.2.0 rlang_0.3.1 pkgbuild_1.0.2
[10] R.oo_1.22.0 pillar_1.3.1 glue_1.3.0
[13] withr_2.1.2 R.utils_2.7.0 sessioninfo_1.1.1
[16] lambda.r_1.2.3 bindr_0.1.1 plyr_1.8.4
[19] stringr_1.3.1 munsell_0.5.0 gtable_0.2.0
[22] R.methodsS3_1.7.1 codetools_0.2-16 evaluate_0.12
[25] memoise_1.1.0 labeling_0.3 callr_3.1.1
[28] ps_1.3.0 Rcpp_1.0.0 backports_1.1.3
[31] scales_1.0.0 formatR_1.5 desc_1.2.0
[34] pkgload_1.0.2 fs_1.2.6 digest_0.6.18
[37] stringi_1.2.4 processx_3.2.1 rprojroot_1.3-2
[40] cli_1.0.1 tools_3.5.2 magrittr_1.5
[43] lazyeval_0.2.1 tibble_2.0.1 futile.options_1.0.1
[46] crayon_1.3.4 whisker_0.3-2 pkgconfig_2.0.2
[49] prettyunits_1.0.2 assertthat_0.2.0 rmarkdown_1.11
[52] rstudioapi_0.9.0 R6_2.3.0 git2r_0.24.0
[55] compiler_3.5.2 This reproducible R Markdown analysis was created with workflowr 1.1.1