Peak To Gene Assignment
Briana Mittleman
9/26/2018
Last updated: 2018-09-26
workflowr checks: (Click a bullet for more information)-
✔ R Markdown file: up-to-date
Great! Since the R Markdown file has been committed to the Git repository, you know the exact version of the code that produced these results.
-
✔ Environment: empty
Great job! The global environment was empty. Objects defined in the global environment can affect the analysis in your R Markdown file in unknown ways. For reproduciblity it’s best to always run the code in an empty environment.
-
✔ Seed:
set.seed(12345)The command
set.seed(12345)was run prior to running the code in the R Markdown file. Setting a seed ensures that any results that rely on randomness, e.g. subsampling or permutations, are reproducible. -
✔ Session information: recorded
Great job! Recording the operating system, R version, and package versions is critical for reproducibility.
-
Great! You are using Git for version control. Tracking code development and connecting the code version to the results is critical for reproducibility. The version displayed above was the version of the Git repository at the time these results were generated.✔ Repository version: dd2b07d
Note that you need to be careful to ensure that all relevant files for the analysis have been committed to Git prior to generating the results (you can usewflow_publishorwflow_git_commit). workflowr only checks the R Markdown file, but you know if there are other scripts or data files that it depends on. Below is the status of the Git repository when the results were generated:
Note that any generated files, e.g. HTML, png, CSS, etc., are not included in this status report because it is ok for generated content to have uncommitted changes.Ignored files: Ignored: .DS_Store Ignored: .Rhistory Ignored: .Rproj.user/ Ignored: output/.DS_Store Untracked files: Untracked: analysis/ncbiRefSeq_sm.sort.mRNA.bed Untracked: analysis/snake.config.notes.Rmd Untracked: analysis/verifyBAM.Rmd Untracked: data/18486.genecov.txt Untracked: data/APApeaksYL.total.inbrain.bed Untracked: data/NuclearApaQTLs.txt Untracked: data/RNAkalisto/ Untracked: data/TotalApaQTLs.txt Untracked: data/Totalpeaks_filtered_clean.bed Untracked: data/YL-SP-18486-T-combined-genecov.txt Untracked: data/YL-SP-18486-T_S9_R1_001-genecov.txt Untracked: data/bedgraph_peaks/ Untracked: data/bin200.5.T.nuccov.bed Untracked: data/bin200.Anuccov.bed Untracked: data/bin200.nuccov.bed Untracked: data/clean_peaks/ Untracked: data/comb_map_stats.csv Untracked: data/comb_map_stats.xlsx Untracked: data/comb_map_stats_39ind.csv Untracked: data/combined_reads_mapped_three_prime_seq.csv Untracked: data/filtered_APApeaks_merged_allchrom_refseqTrans.closest2End.bed Untracked: data/filtered_APApeaks_merged_allchrom_refseqTrans.closest2End.noties.bed Untracked: data/gencov.test.csv Untracked: data/gencov.test.txt Untracked: data/gencov_zero.test.csv Untracked: data/gencov_zero.test.txt Untracked: data/gene_cov/ Untracked: data/joined Untracked: data/leafcutter/ Untracked: data/merged_combined_YL-SP-threeprimeseq.bg Untracked: data/nom_QTL/ Untracked: data/nom_QTL_opp/ Untracked: data/nuc6up/ Untracked: data/other_qtls/ Untracked: data/peakPerRefSeqGene/ Untracked: data/perm_QTL/ Untracked: data/perm_QTL_opp/ Untracked: data/reads_mapped_three_prime_seq.csv Untracked: data/smash.cov.results.bed Untracked: data/smash.cov.results.csv Untracked: data/smash.cov.results.txt Untracked: data/smash_testregion/ Untracked: data/ssFC200.cov.bed Untracked: data/temp.file1 Untracked: data/temp.file2 Untracked: data/temp.gencov.test.txt Untracked: data/temp.gencov_zero.test.txt Untracked: output/picard/ Untracked: output/plots/ Untracked: output/qual.fig2.pdf Unstaged changes: Modified: analysis/28ind.peak.explore.Rmd Modified: analysis/callMolQTLS.Rmd Modified: analysis/cleanupdtseq.internalpriming.Rmd Modified: analysis/dif.iso.usage.leafcutter.Rmd Modified: analysis/diff_iso_pipeline.Rmd Modified: analysis/explore.filters.Rmd Modified: analysis/overlap_qtls.Rmd Modified: analysis/peakOverlap_oppstrand.Rmd Modified: analysis/pheno.leaf.comb.Rmd Modified: analysis/test.max2.Rmd Modified: code/Snakefile
Expand here to see past versions:
library(tidyverse)── Attaching packages ──────────────────────────────────────────────────────────────────────────────────────────── tidyverse 1.2.1 ──✔ ggplot2 3.0.0 ✔ purrr 0.2.5
✔ tibble 1.4.2 ✔ dplyr 0.7.6
✔ tidyr 0.8.1 ✔ stringr 1.3.1
✔ readr 1.1.1 ✔ forcats 0.3.0── Conflicts ─────────────────────────────────────────────────────────────────────────────────────────────── tidyverse_conflicts() ──
✖ dplyr::filter() masks stats::filter()
✖ dplyr::lag() masks stats::lag()library(workflowr)This is workflowr version 1.1.1
Run ?workflowr for help getting startedI will use this analysis to investigate further the best way to assign the peaks to a gene. Right now I am using
Prepare referece
#!/bin/bash

#SBATCH --job-name=intGenes_combfilterPeaksOppStrand
#SBATCH --account=pi-yangili1
#SBATCH --time=24:00:00
#SBATCH --output=intGenes_combfilterPeaksOppStrand.out
#SBATCH --error=intGenes_combfilterPeaksOppStrand.err
#SBATCH --partition=broadwl
#SBATCH --mem=12G
#SBATCH --mail-type=END

module load Anaconda3
source activate three-prime-env

bedtools intersect -wa -wb -sorted -S -a /project2/gilad/briana/threeprimeseq/data/mergedPeaks_comb/filtered_APApeaks_merged_allchrom.named.fixed.bed -b /project2/gilad/briana/genome_anotation_data/ncbiRefSeq_sm_noChr.sort.mRNA.bed > /project2/gilad/briana/threeprimeseq/data/mergedPeaks_comb/filtered_APApeaks_merged_allchrom_refseqGenes.OppStrand.bed
This results in peaks being mapped to multiple genes. I want to use a method where I look for the closest end of transcript to each peak then use that gene for the assignment. This would mean each peak is assigned to one gene.
Create a python script to process the NCBI file. I want protien coding transcript ends with the associated gene names. Original file: ncbiRefSeq.txt
- Column 2 transcript name
- Column 13 gene name
- NM is protein coding
EndOfProCodTrans.py
def main(inF, outF):
  infile= open(inF, "r")
  fout = open(outF,'w')
  for line in infile:
      linelist=line.split()
      transcript=linelist[1]
      transcript_id=transcript.split("_")[0]
      if transcript_id=="NM":
          chr=linelist[2][3:]
          strand=linelist[3]
          gene= linelist[12]
          if strand == "+" :
              end = int(linelist[7])
              end2= end - 1
              fout.write("%s\t%d\t%d\t%s:%s\t.\t%s\n"%(chr, end2, end, transcript,gene, strand))
          if strand == "-":
              end= int(linelist[4])
              end2= end + 1
              fout.write("%s\t%d\t%d\t%s:%s\t.\t%s\n"%(chr, end, end2, transcript,gene, strand))


if __name__ == "__main__":
    inF = "/project2/gilad/briana/genome_anotation_data/ncbiRefSeq.txt"
    outF= "/project2/gilad/briana/genome_anotation_data/ncbiRefSeq_endProtCodGenes.txt"
    main(inF, outF)
Find closest gene to each peak
bedtools closest
-A peaks /project2/gilad/briana/threeprimeseq/data/mergedPeaks_comb/filtered_APApeaks_merged_allchrom.named.fixed.bed -B transcript file /project2/gilad/briana/genome_anotation_data/ncbiRefSeq_endProtCodGenes_sort.txt -S (opposite strand) -D b (give distance wrt to gene strand)
#!/bin/bash

#SBATCH --job-name=TransClosest2End
#SBATCH --account=pi-yangili1
#SBATCH --time=24:00:00
#SBATCH --output=TransClosest2End.out
#SBATCH --error=TransClosest2End.err
#SBATCH --partition=broadwl
#SBATCH --mem=12G
#SBATCH --mail-type=END

module load Anaconda3

source activate three-prime-env


bedtools closest -S -D b -a /project2/gilad/briana/threeprimeseq/data/mergedPeaks_comb/filtered_APApeaks_merged_allchrom.named.fixed.bed -b  /project2/gilad/briana/genome_anotation_data/ncbiRefSeq_endProtCodGenes_sort.txt > /project2/gilad/briana/threeprimeseq/data/mergedPeaks_comb/filtered_APApeaks_merged_allchrom_refseqTrans.closest2End.bed
I will take a look at this file in R then I will process the file in python.
names=c("PeakChr", "PeakStart", "PeakEnd", "PeakName","PeakScore", "PeakStrand", "GeneChr", "GeneStart", "GeneEnd", "Transcript", "GeneScore", "GeneStrand", "Distance" )
peak2transDist=read.table("../data/filtered_APApeaks_merged_allchrom_refseqTrans.closest2End.bed", col.names = names, stringsAsFactors = F, header=F)
ggplot(peak2transDist, aes(x=abs(Distance)))+ geom_density() + scale_x_log10()Warning: Transformation introduced infinite values in continuous x-axisWarning: Removed 4362 rows containing non-finite values (stat_density).
Expand here to see past versions of unnamed-chunk-6-1.png:
| Version | Author | Date |
|---|---|---|
| aaed5fd | Briana Mittleman | 2018-09-26 |
peak2transDist0=peak2transDist %>% filter(Distance==0)
nrow(peak2transDist0)
[1] 4362peak2transDist200=peak2transDist %>% filter(abs(Distance)<200)
nrow(peak2transDist200)[1] 23778summary(peak2transDist$Distance) Min. 1st Qu. Median Mean 3rd Qu. Max.
-5523243 -57698 -12830 -23711 3373 5592124 try adding the no ties flag -t first.
peak2transDist_noties=read.table("../data/filtered_APApeaks_merged_allchrom_refseqTrans.closest2End.noties.bed", col.names = names, stringsAsFactors = F, header=F)
ggplot(peak2transDist_noties, aes(x=abs(Distance)))+ geom_density() + scale_x_log10()
Warning: Transformation introduced infinite values in continuous x-axisWarning: Removed 2044 rows containing non-finite values (stat_density).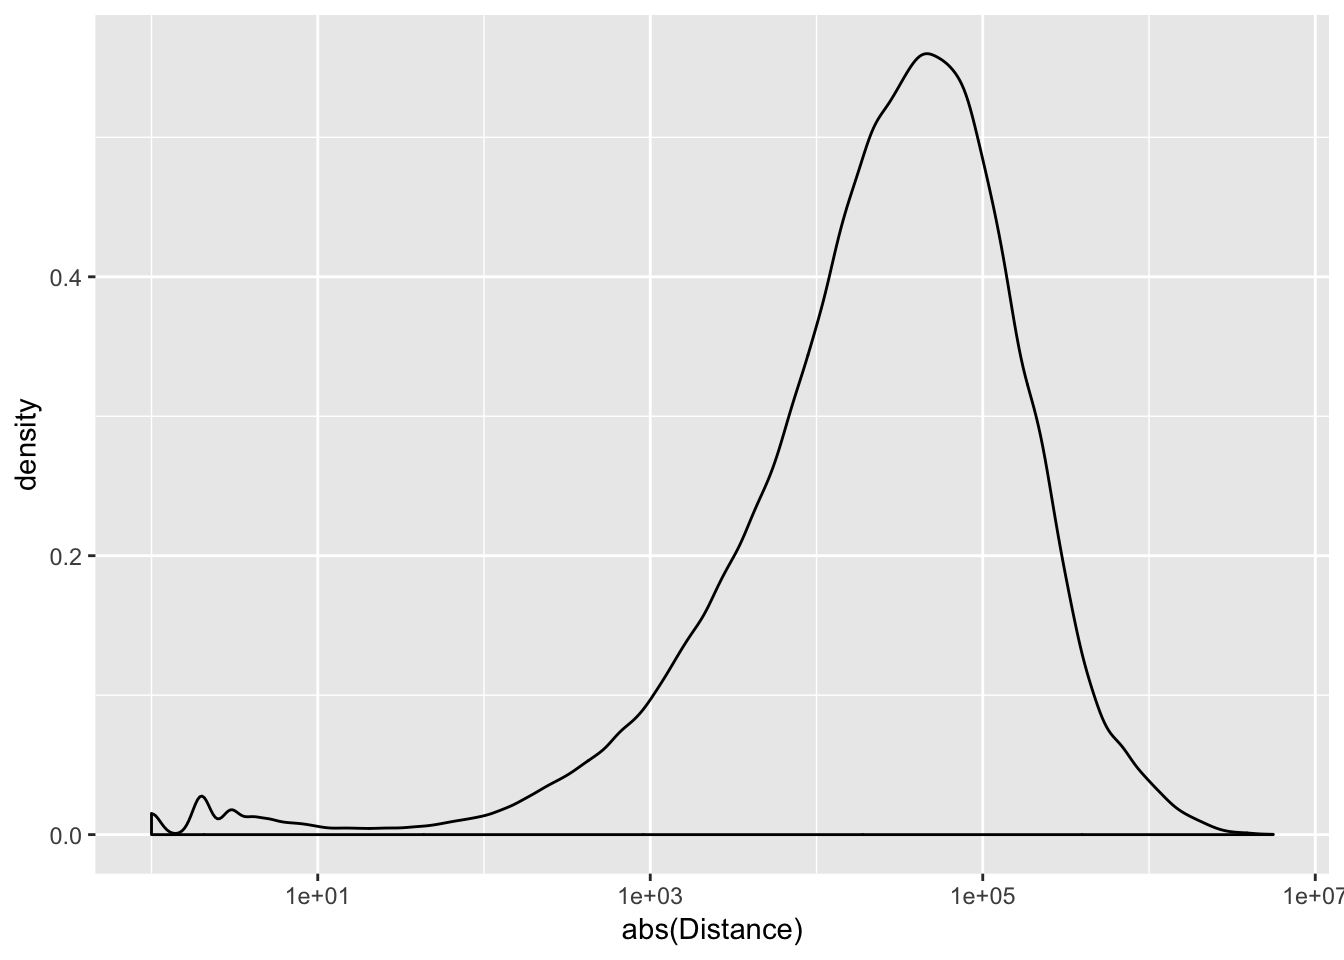
peak2transDist0_noT=peak2transDist_noties%>% filter(Distance==0)
nrow(peak2transDist0_noT)
[1] 2044peak2transDist200_noT=peak2transDist_noties %>% filter(abs(Distance)<200)
nrow(peak2transDist200_noT)[1] 10488summary(peak2transDist$Distance) Min. 1st Qu. Median Mean 3rd Qu. Max.
-5523243 -57698 -12830 -23711 3373 5592124 ggplot(peak2transDist_noties, aes(x=abs(Distance)))+ geom_histogram(binwidth = .5) + scale_x_log10()Warning: Transformation introduced infinite values in continuous x-axisWarning: Removed 2044 rows containing non-finite values (stat_bin).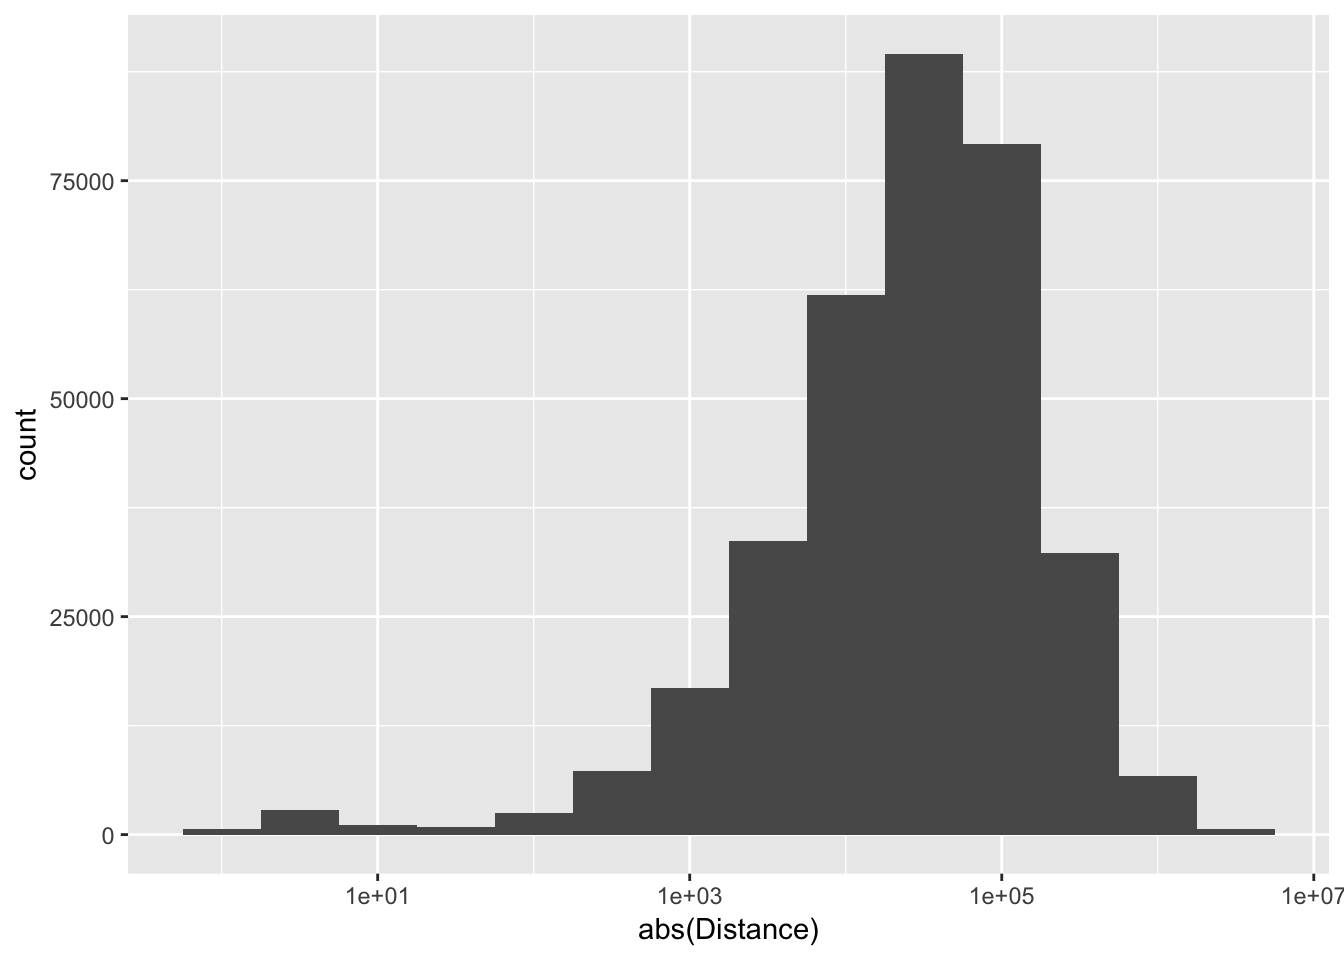
Session information
sessionInfo()R version 3.5.1 (2018-07-02)
Platform: x86_64-apple-darwin15.6.0 (64-bit)
Running under: macOS Sierra 10.12.6
Matrix products: default
BLAS: /Library/Frameworks/R.framework/Versions/3.5/Resources/lib/libRblas.0.dylib
LAPACK: /Library/Frameworks/R.framework/Versions/3.5/Resources/lib/libRlapack.dylib
locale:
[1] en_US.UTF-8/en_US.UTF-8/en_US.UTF-8/C/en_US.UTF-8/en_US.UTF-8
attached base packages:
[1] stats graphics grDevices utils datasets methods base
other attached packages:
[1] bindrcpp_0.2.2 workflowr_1.1.1 forcats_0.3.0 stringr_1.3.1
[5] dplyr_0.7.6 purrr_0.2.5 readr_1.1.1 tidyr_0.8.1
[9] tibble_1.4.2 ggplot2_3.0.0 tidyverse_1.2.1
loaded via a namespace (and not attached):
[1] tidyselect_0.2.4 haven_1.1.2 lattice_0.20-35
[4] colorspace_1.3-2 htmltools_0.3.6 yaml_2.2.0
[7] rlang_0.2.2 R.oo_1.22.0 pillar_1.3.0
[10] glue_1.3.0 withr_2.1.2 R.utils_2.7.0
[13] modelr_0.1.2 readxl_1.1.0 bindr_0.1.1
[16] plyr_1.8.4 munsell_0.5.0 gtable_0.2.0
[19] cellranger_1.1.0 rvest_0.3.2 R.methodsS3_1.7.1
[22] evaluate_0.11 labeling_0.3 knitr_1.20
[25] broom_0.5.0 Rcpp_0.12.18 scales_1.0.0
[28] backports_1.1.2 jsonlite_1.5 hms_0.4.2
[31] digest_0.6.16 stringi_1.2.4 grid_3.5.1
[34] rprojroot_1.3-2 cli_1.0.0 tools_3.5.1
[37] magrittr_1.5 lazyeval_0.2.1 crayon_1.3.4
[40] whisker_0.3-2 pkgconfig_2.0.2 xml2_1.2.0
[43] lubridate_1.7.4 assertthat_0.2.0 rmarkdown_1.10
[46] httr_1.3.1 rstudioapi_0.7 R6_2.2.2
[49] nlme_3.1-137 git2r_0.23.0 compiler_3.5.1
This reproducible R Markdown analysis was created with workflowr 1.1.1