Last updated: 2018-04-05
Code version: 6a0a11e
I will use this analysis to answer the question: Do eQTLs also equally affect antisense transcriptions? This will take advantage of strand specificity of the net-seq data and the phenominon of convergent and divergent transcription around TSS.
Workflow:
*Download eqtls
*Rank eqtls based on coverage in tss region, this may include seeing if the eqtl genes are in the filtered gene set from the strand specificity analysis
*Look at some of the top snps
-separate individuals by genome
-look at them in IGV
-box plots seperated by genotype, forward and reverse transcription
Load libraries
library(workflowr)Loading required package: rmarkdownThis is workflowr version 0.7.0
Run ?workflowr for help getting startedlibrary(tidyr)
library(dplyr)
Attaching package: 'dplyr'The following objects are masked from 'package:stats':
filter, lagThe following objects are masked from 'package:base':
intersect, setdiff, setequal, unionlibrary(reshape2)Warning: package 'reshape2' was built under R version 3.4.3
Attaching package: 'reshape2'The following object is masked from 'package:tidyr':
smithslibrary(ggplot2)
library(plyr)-------------------------------------------------------------------------You have loaded plyr after dplyr - this is likely to cause problems.
If you need functions from both plyr and dplyr, please load plyr first, then dplyr:
library(plyr); library(dplyr)-------------------------------------------------------------------------
Attaching package: 'plyr'The following objects are masked from 'package:dplyr':
arrange, count, desc, failwith, id, mutate, rename, summarise,
summarizeGene overlaps
Download eqtls and YRI genotypes from http://eqtl.uchicago.edu/jointLCL/ to /project2/gilad/briana/Net-seq-pilot/data/eqtl
wget  http://eqtl.uchicago.edu/jointLCL/output_RNAseqGeuvadis_PC14.txt
wget http://eqtl.uchicago.edu/jointLCL/genotypesYRI.gen.txt.gz
Make a list of the genes that have an eqtl with the effect size (so i can order which to look at) :
awk '{print $2}' eqtl_RNAseqGeuvadis.txt > eqtl_genes
awk '{print $1 "\t" $2 "\t" $6}' eqtl_RNAseqGeuvadis.txt > eqtl_genes_effectsize.txt
The filtered genes are in /project2/gilad/briana/genome_anotation_data/gencode.v19.annotation.distfilteredgenes.bed
Pull both of these into R so I can filter the genes by if they have an eqtl.
eqtl_gene= read.table("../data/eqtl_genes_effectsize.txt", stringsAsFactors = FALSE, header=TRUE)
filter_genes= read.table("../data/gencode.v19.annotation.distfilteredgenes.bed", stringsAsFactors = FALSE)
colnames(filter_genes)=c("chr", "start", "end", "gene", "score", "strand")
Use the filter dplyr functions to filter the eqtl genes by genes that are covered in our list of filtered genes.
eqtl_gene_filter=eqtl_gene %>% semi_join(filter_genes, by="gene") %>% arrange(desc(beta))

eqtl_pergene= eqtl_gene_filter %>% group_by(gene) %>% tally()
This shows that 3985 genes in the filter_genes file have at least one eqtl. The eqtl_gene_filter file has all the eqtl genes sorted in descending order by the beta value. Now I need to back filter the bed file to only include the genes in the eqtl genes. This will allow me to get coverage for each of these.
filter_genes_byeqtl= filter_genes %>% semi_join(eqtl_pergene, by="gene")

#write.table(filter_genes_byeqtl, "../data/gencode.v19.annotation.eqtlfilter.bed",col.names = TRUE, row.names = FALSE, quote = FALSE, sep="\t")
This file is now in /project2/gilad/briana/genome_anotation_data/gencode.v19.annotation.eqtlfilter.bed
Coverage for TSS
I need to modify gencode.v19.annotation.eqtlfilter.bed to include the TSS of each of these genes. I am looking at the first 500 basepairs of each gene.
awk '{if($6 == "+") print($1 "\t" $2 -500 "\t" $2 + 500 "\t" $4 "\t" $5 "\t" $6 ); else print($1 "\t" $3 - 500 "\t" $3 +500 "\t" $4 "\t" $5 "\t" $6 )}' gencode.v19.annotation.eqtlfilter.bed > gencode.v19.annotation.eqtlfilter_TSS.bed Bam to bed and sort each bedfile with sort -k1,1 -k2,2n
#!/bin/bash
#SBATCH --mail-type=END

module load Anaconda3
source activate net-seq

bamToBed -i YG-SP-NET3-18508_combined_Netpilot-sort.bam | sort -k1,1 -k2,2n > ../sorted_bed/YG-SP-NET3-18508_combined_Netpilot-bedsort.bed

bamToBed -i YG-SP-NET3-19128_combined_Netpilot-sort.bam | sort -k1,1 -k2,2n > ../sorted_bed/YG-SP-NET3-19128_combined_Netpilot-bedsort.bed

bamToBed -i YG-SP-NET3-19141_combined_Netpilot-sort.bam | sort -k1,1 -k2,2n > ../sorted_bed/YG-SP-NET3-19141_combined_Netpilot-bedsort.bed

bamToBed -i YG-SP-NET3-19193_combined_Netpilot-sort.bam | sort -k1,1 -k2,2n > ../sorted_bed/YG-SP-NET3-19193_combined_Netpilot-bedsort.bed

bamToBed -i YG-SP-NET3-19239_combined_Netpilot-sort.bam | sort -k1,1 -k2,2n > ../sorted_bed/YG-SP-NET3-19239_combined_Netpilot-bedsort.bed

bamToBed -i YG-SP-NET3-19257_combined_Netpilot-sort.bam | sort -k1,1 -k2,2n > ../sorted_bed/YG-SP-NET3-19257_combined_Netpilot-bedsort.bed
Now I can write a script that counts the coverage for these TSS in a strand specific manner. Remeber that netseq is flipped strand so same strand should be the -S and opp strand is -s. This script is in the code directory and is called eqtl_stranded.sh.
#!/bin/bash

#SBATCH --job-name=eqtl_strand
#SBATCH --time=8:00:00
#SBATCH --output=eqtlstrand.out
#SBATCH --error=eqtlstrand.err
#SBATCH --partition=broadwl
#SBATCH --mem=40G
#SBATCH --mail-type=END

module load Anaconda3
source activate net-seq

sample=$1
describer=$(echo ${sample} | sed -e 's/.*\YG-SP-//' | sed -e "s/_combined_Netpilot-bedsort.bed$//")


bedtools coverage -counts -S -a /project2/gilad/briana/genome_anotation_data/gencode.v19.annotation.eqtlfilter_TSS.bed -b $1 > /project2/gilad/briana/Net-seq-pilot/output/eqtl_strand_spec/${describer}_same_eqtstrandedlTSS.txt

bedtools coverage -counts -s -a /project2/gilad/briana/genome_anotation_data/gencode.v19.annotation.eqtlfilter_TSS.bed -b $1 > /project2/gilad/briana/Net-seq-pilot/output/eqtl_strand_spec/${describer}_opp_eqtstrandedlTSS.txt
Create a wrapper to run this on all files: wrap_eqtl_strand.sh
#!/bin/bash

#SBATCH --job-name=w_eqtl_strand
#SBATCH --time=8:00:00
#SBATCH --output=weqtlstrand.out
#SBATCH --error=weqtlstrand.err
#SBATCH --partition=broadwl
#SBATCH --mem=8G
#SBATCH --mail-type=END


for i in $(ls /project2/gilad/briana/Net-seq-pilot/data/sorted_bed/); do
            sbatch eqtl_stranded.sh /project2/gilad/briana/Net-seq-pilot/data/sorted_bed/$i
        done
need to give more memory to 508, 128, 141, 193, 239
Pull in all files and join them the same strand ones on the first four columns
same_18486= read.table(file = "../data/eqtl_strand_spec/NET3-18486_same_eqtstrandedlTSS.txt", header =F, col.names=c("chr", "start", "end", "gene", "score", "strand", "same_18486"), stringsAsFactors = F)
same_18505= read.table(file = "../data/eqtl_strand_spec/NET3-18505_same_eqtstrandedlTSS.txt", header =F, col.names=c("chr", "start", "end", "gene", "score", "strand", "same_18505"),stringsAsFactors = F)
same_18508= read.table(file = "../data/eqtl_strand_spec/NET3-18508_same_eqtstrandedlTSS.txt", header =F, col.names=c("chr", "start", "end", "gene", "score", "strand", "same_18508"),stringsAsFactors = F)
same_19128= read.table(file = "../data/eqtl_strand_spec/NET3-19128_same_eqtstrandedlTSS.txt", header =F, col.names=c("chr", "start", "end", "gene", "score", "strand", "same_19128"),stringsAsFactors = F)
same_19141= read.table(file = "../data/eqtl_strand_spec/NET3-19141_same_eqtstrandedlTSS.txt", header =F, col.names=c("chr", "start", "end", "gene", "score", "strand", "same_19141"),stringsAsFactors = F)
same_19193= read.table(file = "../data/eqtl_strand_spec/NET3-19193_same_eqtstrandedlTSS.txt", header =F, col.names=c("chr", "start", "end", "gene", "score", "strand", "same_19193"),stringsAsFactors = F)
same_19239= read.table(file = "../data/eqtl_strand_spec/NET3-19239_same_eqtstrandedlTSS.txt", header =F, col.names=c("chr", "start", "end", "gene", "score", "strand", "same_19239"),stringsAsFactors = F)
same_19257= read.table(file = "../data/eqtl_strand_spec/NET3-19257_same_eqtstrandedlTSS.txt", header =F, col.names=c("chr", "start", "end", "gene", "score", "strand", "same_19257"),stringsAsFactors = F)
Same strand:
all_same_strand=cbind(same_18486[,1:7], same_18505$same_18505, same_18508$same_18508, same_19128$same_19128,same_19141$same_19141, same_19193$same_19193, same_19239$same_19239, same_19257$same_19257)
colnames(all_same_strand)=c("chr", "start", "end", "gene", "score", "strand", "same_18486", "same_18505", "same_18508", "same_19128", "same_19141", "same_19193", "same_19239", "same_19257")


all_same_strand_long=melt(all_same_strand, variable.name = "library",  value.name = "same_count",
                     id.vars = c("chr", "start", "end", "gene", "score", "strand"))
plot coverage dist:
ggplot(all_same_strand_long, aes(x=library, y=log10(same_count + .25))) + geom_violin()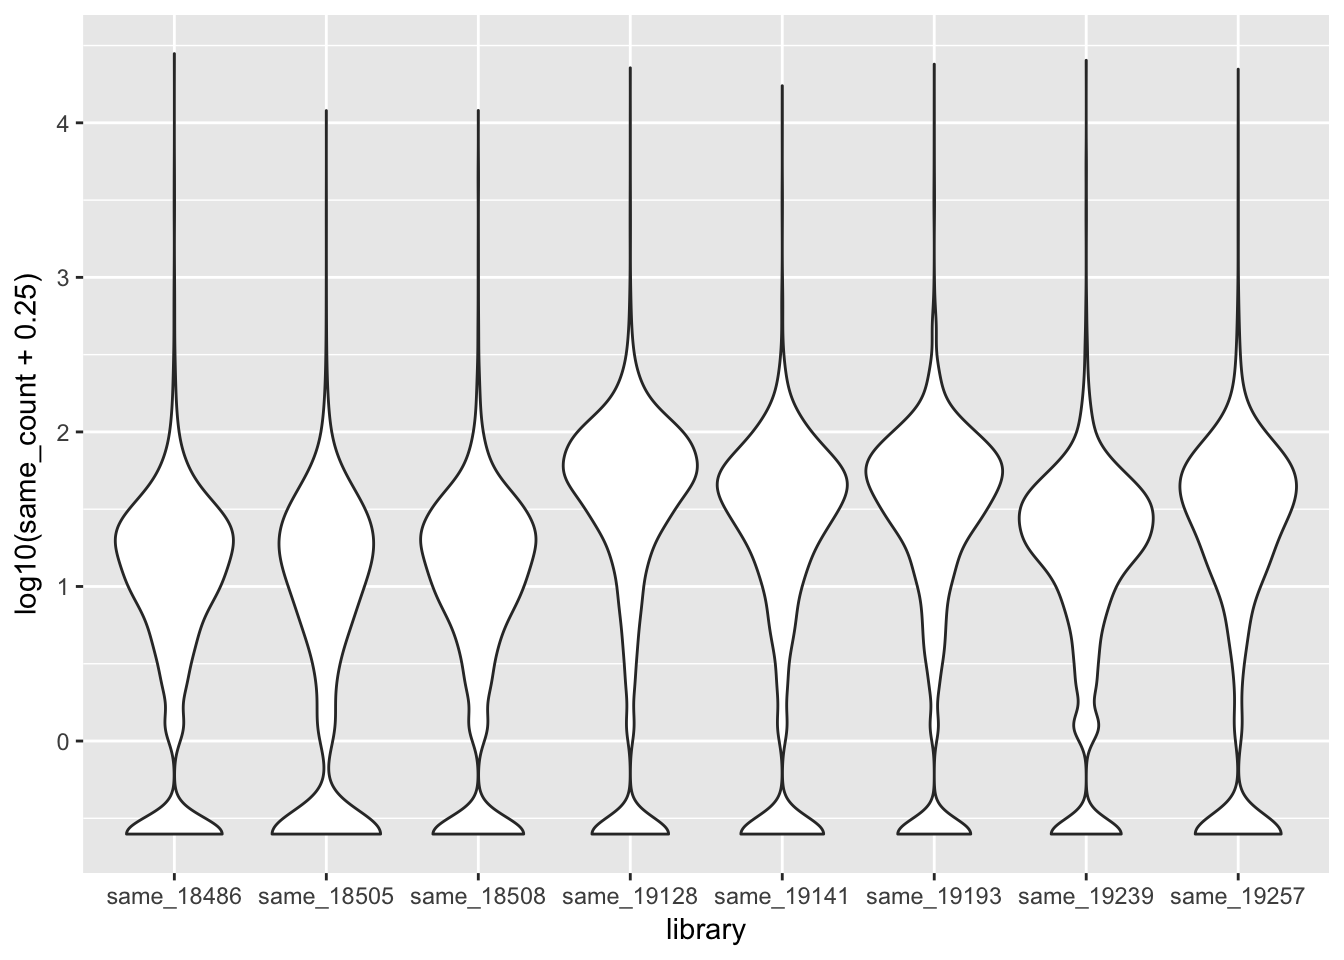
Opp strand:
opp_18486= read.table(file = "../data/eqtl_strand_spec/NET3-18486_opp_eqtstrandedlTSS.txt", header =F, col.names=c("chr", "start", "end", "gene", "score", "strand", "opp_18486"),stringsAsFactors = F)
opp_18505= read.table(file = "../data/eqtl_strand_spec/NET3-18505_opp_eqtstrandedlTSS.txt", header =F, col.names=c("chr", "start", "end", "gene", "score", "strand", "opp_18505"),stringsAsFactors = F)
opp_18508= read.table(file = "../data/eqtl_strand_spec/NET3-18508_opp_eqtstrandedlTSS.txt", header =F, col.names=c("chr", "start", "end", "gene", "score", "strand", "opp_18508"),stringsAsFactors = F)
opp_19128= read.table(file = "../data/eqtl_strand_spec/NET3-19128_opp_eqtstrandedlTSS.txt", header =F, col.names=c("chr", "start", "end", "gene", "score", "strand", "opp_19128"),stringsAsFactors = F)
opp_19141= read.table(file = "../data/eqtl_strand_spec/NET3-19141_opp_eqtstrandedlTSS.txt", header =F, col.names=c("chr", "start", "end", "gene", "score", "strand", "opp_19141"),stringsAsFactors = F)
opp_19193= read.table(file = "../data/eqtl_strand_spec/NET3-19193_opp_eqtstrandedlTSS.txt", header =F, col.names=c("chr", "start", "end", "gene", "score", "strand", "opp_19193"),stringsAsFactors = F)
opp_19239= read.table(file = "../data/eqtl_strand_spec/NET3-19239_opp_eqtstrandedlTSS.txt", header =F, col.names=c("chr", "start", "end", "gene", "score", "strand", "opp_19239"),stringsAsFactors = F)
opp_19257= read.table(file = "../data/eqtl_strand_spec/NET3-19257_opp_eqtstrandedlTSS.txt", header =F, col.names=c("chr", "start", "end", "gene", "score", "strand", "opp_19257"),stringsAsFactors = F)
all_opp_strand=cbind(opp_18486[,1:7], opp_18505$opp_18505, opp_18508$opp_18508, opp_19128$opp_19128,opp_19141$opp_19141, opp_19193$opp_19193, opp_19239$opp_19239, opp_19257$opp_19257)
colnames(all_opp_strand)=c("chr", "start", "end", "gene", "score", "strand", "opp_18486", "opp_18505", "opp_18508", "opp_19128", "opp_19141", "opp_19193", "opp_19239", "opp_19257")all_opp_strand_long=melt(all_opp_strand, variable.name = "library", value.name = "opp_count",
id.vars = c("chr", "start", "end", "gene", "score", "strand"))
ggplot(all_opp_strand_long, aes(x=library, y=log10(opp_count + .25))) + geom_violin()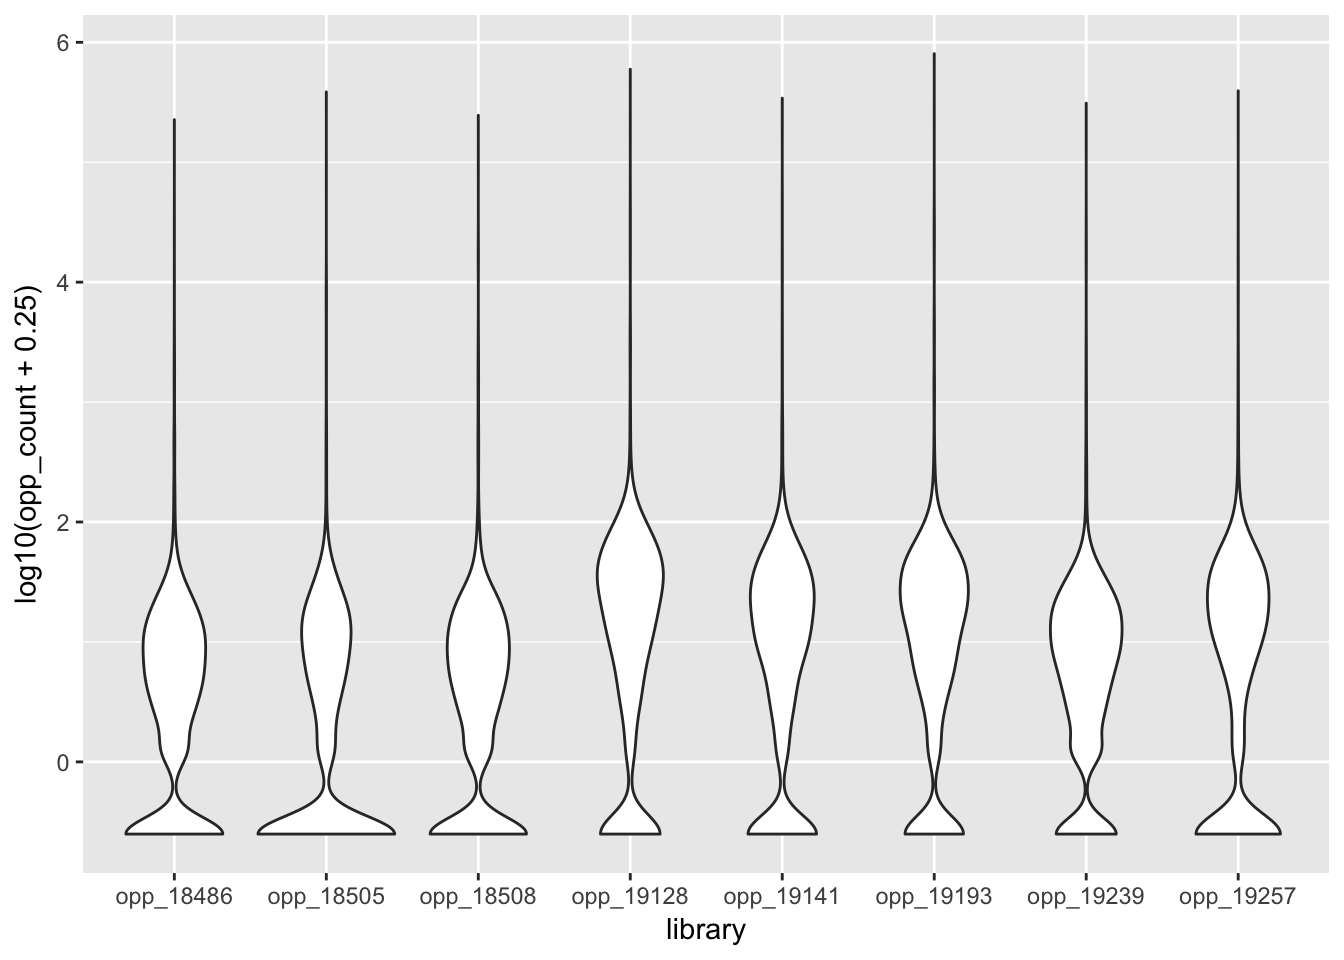
Combine these to do it together colored by strand.
colnames(all_same_strand)= c("chr", "start", "end", "gene", "score", "strand", "l_18486", "l_18505", "l_18508", "l_19128", "l_19141", "l_19193", "l_19239", "l_19257")
all_same_strand_new= all_same_strand %>% mutate(which_strand="same")


colnames(all_opp_strand)= c("chr", "start", "end", "gene", "score", "strand", "l_18486", "l_18505", "l_18508", "l_19128", "l_19141", "l_19193", "l_19239", "l_19257")
all_opp_strand_new=all_opp_strand %>% mutate(which_strand="opp")

all_coverage= rbind(all_same_strand_new, all_opp_strand_new)
Make this long:
all_strand_long=melt(all_coverage, variable.name = "library", value.name = "count",
                     id.vars = c("chr", "start", "end", "gene", "score", "strand", "which_strand"))


ggplot(all_strand_long, aes(x=library, y=log10( count+ .25), fill=which_strand)) + geom_violin() + ggtitle("TSS coverage by strand by libary") 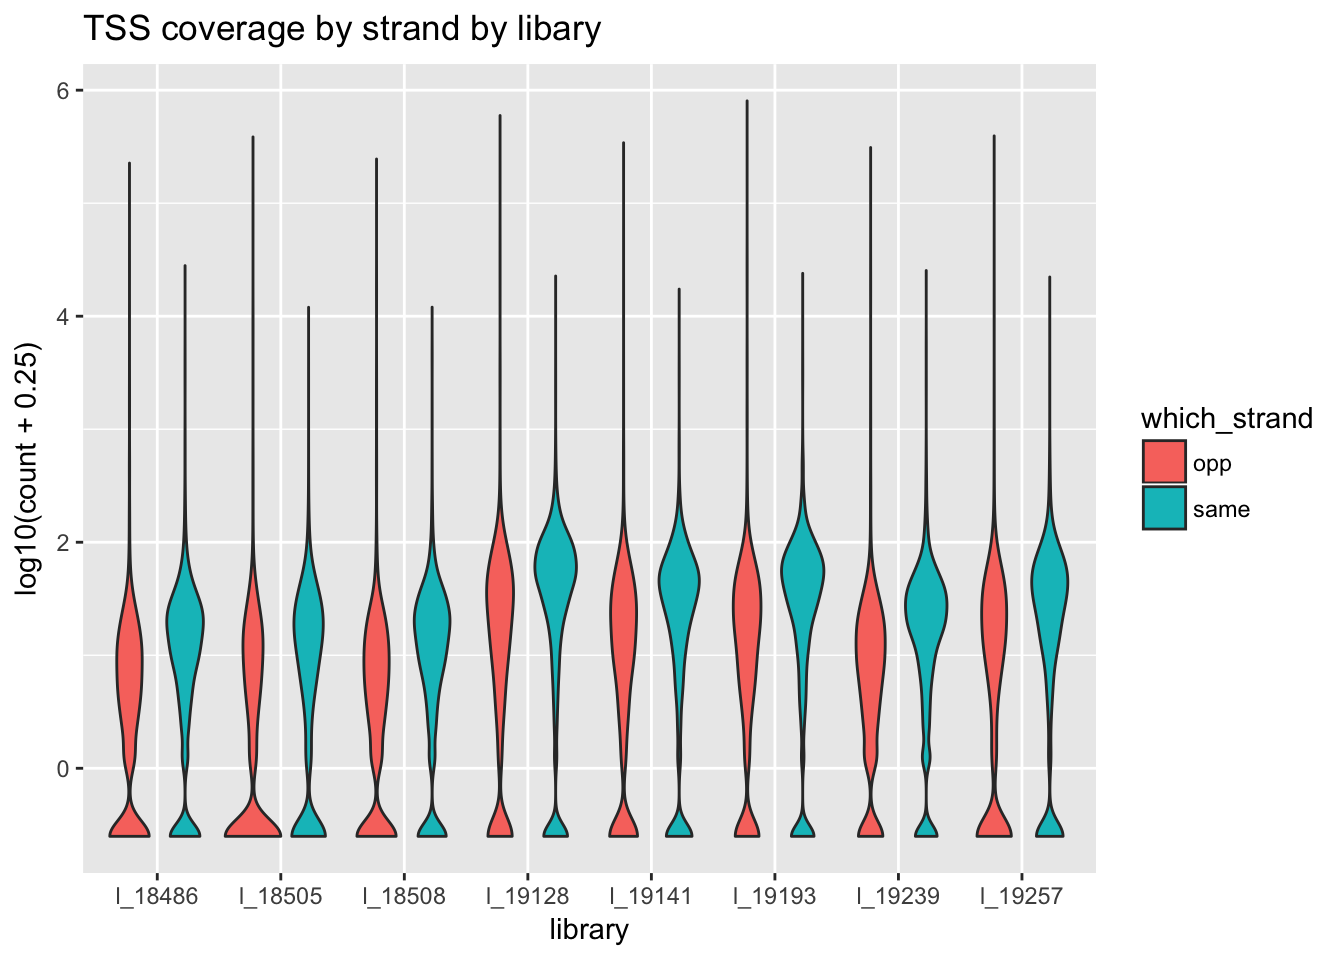
Calculate the %same:
perc_18486=all_same_strand$l_18486/(all_same_strand$l_18486 + all_opp_strand$l_18486)
perc_18505=all_same_strand$l_18505/(all_same_strand$l_18505 + all_opp_strand$l_18505)
perc_18508=all_same_strand$l_18508/(all_same_strand$l_18508 + all_opp_strand$l_18508)
perc_19128=all_same_strand$l_19128/(all_same_strand$l_19128 + all_opp_strand$l_19128)
perc_19141=all_same_strand$l_19141/(all_same_strand$l_19141 + all_opp_strand$l_19141)
perc_19193=all_same_strand$l_19193/(all_same_strand$l_19193 + all_opp_strand$l_19193)
perc_19239=all_same_strand$l_19239/(all_same_strand$l_19239 + all_opp_strand$l_19239)
perc_19257=all_same_strand$l_19257/(all_same_strand$l_19257 + all_opp_strand$l_19257)
Create a table with these:
perc_all= cbind(all_same_strand[,1:6],perc_18486,perc_18505,perc_18508,perc_19128,perc_19141,perc_19193, perc_19239,perc_19257)Make this tidy to remove NA and to make box plots
perc_all_long=melt(perc_all, variable.name = "library",  value.name = "perc_same",
                     id.vars = c("chr", "start", "end", "gene", "score", "strand"), na.rm = TRUE)
Make a side by side box plot:
ggplot(perc_all_long, aes(x=library, y=perc_same)) + geom_violin() + ggtitle("Distribution of the precent of reads mapping to the same strand") 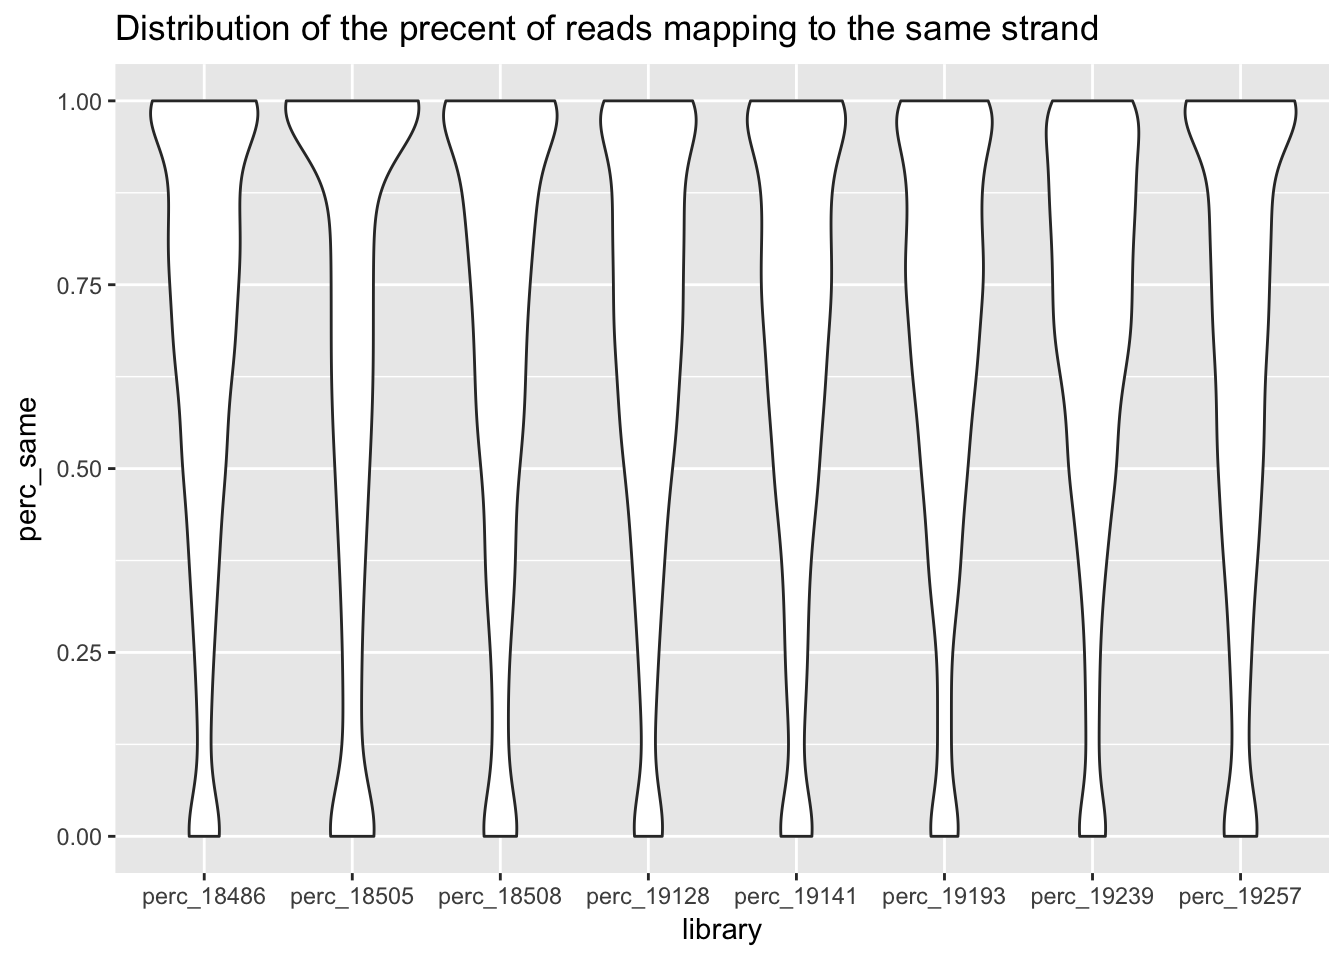
This is good. Expectation is the samples have similar distributions of the
Look at eqtls
I need to select the genotypes by the individuals i have and the eqtl snps.
geno= read.table("../data/eqtl_strand_spec/genotypesYRI.gen.txt")
colnames(geno)= c("CHROM",  "POS",  "ID",   "REF",  "ALT",  "QUAL", "FILTER",   "INFO", "FORMAT",   "18486",    "18489",    "18498",    "18499",    "18501",    "18502",    "18504",    "18505",    "18507",    "18508",    "18510",    "18511",    "18516",    "18517",    "18519",    "18520",    "18522",    "18523",    "18853",    "18856",    "18858",    "18861",    "18870",    '18871',    "18907",    "18909",    "18912",    "18916",    "19093",    "19098",    "19099",    '19102',    "19108",    "19114",    "19116",    "19119",    "19129",    "19131",    '19137',    "19138",    "19141",    "19143",    "19144",    "19147",    "19152",    "19153",    "19159",    "19160",    "19171",    "19172",    "19190",    "19200",    "19201",    "19204",    "19207",    "19209",    "19210",    "19225",    "19257",    "19175",    "19176",    "19203",    "18855",    "19095",    "19096",    "18867",    "18868",    "18924",    "18923",    "18488",    "19122",    "19121",    "19247",    "19248",    "18933",    "18934",    "19118",    '19117',    '19149',    "19150",    "18487",    "19235",    "19236",    "19226",    "19189",    "18910",    "18917",    "19113",    "19214",    "19213",    "19182",    "19181",    "19179",    "19178",    "19146",    "19107",    "19185",    "19184",    "19256",    "19197",    "19198",    "18873",    "18874",    "19238",    "19239",    "19222",    "19223",    "18862",    "18852",    "19140",    "19127",    "19128",    "19193",    "19192",    "19130",    "19206",    "18913",    '18859',    "19101")
filter by my ind.:
geno_netpilot= geno %>% select("CHROM", "POS", "ID", "REF", "ALT", "QUAL", "FILTER", "INFO", "FORMAT", "18486", "18505", "18508", "19128", "19141", "19193", "19239", "19257")Write out this filitered data:
write.table(geno_netpilot, "../data/eqtl_strand_spec/genotypesYRI.gen.netpilot.txt", quote=FALSE,strcol.names = c("CHROM", "POS", "ID", "REF", "ALT", "QUAL", "FILTER", "INFO", "FORMAT", "18486", "18505", "18508", "19128", "19141", "19193", "19239", "19257"))Pull this in for analysis:
geno_netpilot= read.table( "../data/eqtl_strand_spec/genotypesYRI.gen.netpilot.txt", header=TRUE, stringsAsFactors = FALSE)The next step will be to filter this further by the eqtl snps, to do this i will have to process the eqtl snp ids by seperating the chr and the rs ids. I will then be able to filter join with dplyr.
eqtl_gene_filter_rs= eqtl_gene_filter %>% separate(snps,c("CHROM", "ID"))

eqtl_gene_filter_rs$ID=sub("^", "rs", eqtl_gene_filter_rs$ID)
Use semi joing by the CHROM and ID columns. I want to filter the genotypes so that is the x.
geno_netpilot_eqtl=geno_netpilot %>% semi_join(eqtl_gene_filter_rs, by=c("ID"))
geno_netpilot_eqtl_round= geno_netpilot_eqtl %>% mutate_if(is.numeric, round)
Create a file with the full count for each gene at its TSS by adding the strand counts:
all_18486=all_same_strand$l_18486 + all_opp_strand$l_18486
all_18505=all_same_strand$l_18505+ all_opp_strand$l_18505
all_18508=all_same_strand$l_18508 + all_opp_strand$l_18508
all_19128=all_same_strand$l_19128 + all_opp_strand$l_19128
all_19141=all_same_strand$l_19141 + all_opp_strand$l_19141
all_19193=all_same_strand$l_19193 + all_opp_strand$l_19193
all_19239=all_same_strand$l_19239+ all_opp_strand$l_19239
all_19257=all_same_strand$l_19257+ all_opp_strand$l_19257


all_exp_both= cbind(all_same_strand[,1:6],all_18486,all_18505,all_18508, all_19128,all_19141,all_19193, all_19239, all_19257)
Next step is to create the function that plots the gene coverage by genotype when you give it a qtl snp:
by_geno_exp=function(rsID){
  geno_rs=geno_netpilot_eqtl_round %>% filter(geno_netpilot_eqtl_round$ID==rsID) %>% select(10:17)
  gene_rs= eqtl_gene_filter_rs  %>% filter(ID==rsID) %>% select(gene) %>% top_n(1) %>% as.character()
  exp_gene= all_exp_both %>% filter(gene==gene_rs) %>% select(7:14)
  colnames(exp_gene)= colnames(geno_rs)
  x=rbind(geno_rs,exp_gene) %>% t
  x=as.data.frame(x)
  return(boxplot(x$V2~x$V1, ylab="TSS count", xlab="genotype", main=rsID))
}
Sort the eqtls by effect size and run my function on top 10:
top_10_effect=eqtl_gene_filter_rs %>% arrange(desc(beta)) %>% semi_join(geno_netpilot_eqtl_round, by="ID") %>% semi_join(all_exp_both, by="gene") %>% select(ID) %>% top_n(10)Selecting by IDprint(top_10_effect) ID
1 rs999837
2 rs999454
3 rs9996578
4 rs9994286
5 rs9997275
6 rs9999085
7 rs999454
8 rs999837
9 rs9994709
10 rs9994709for(i in top_10_effect$ID){
by_geno_exp(i)
}Selecting by gene
Selecting by gene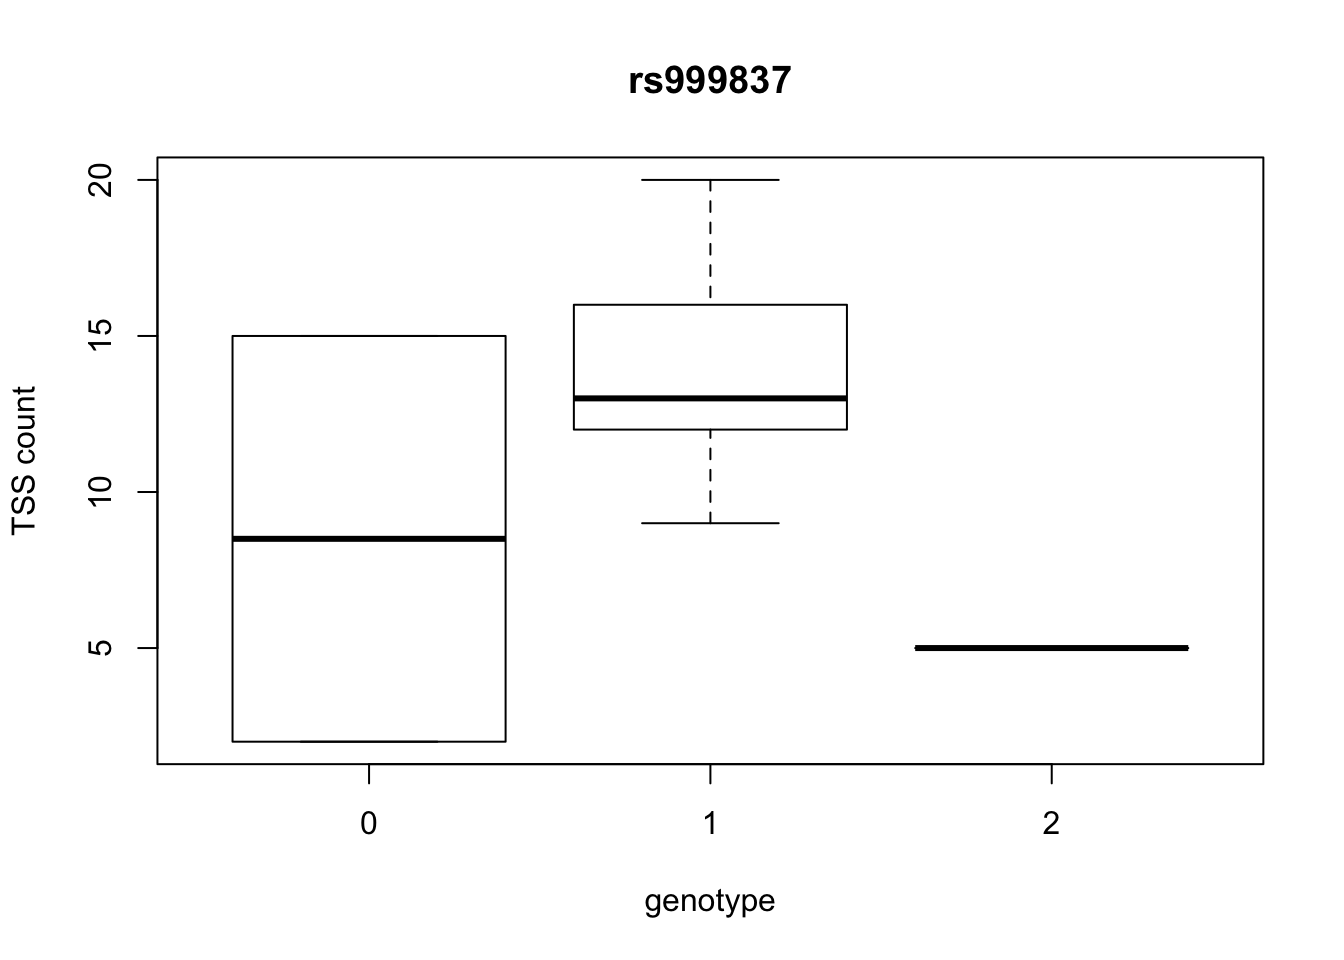
Selecting by gene
Selecting by gene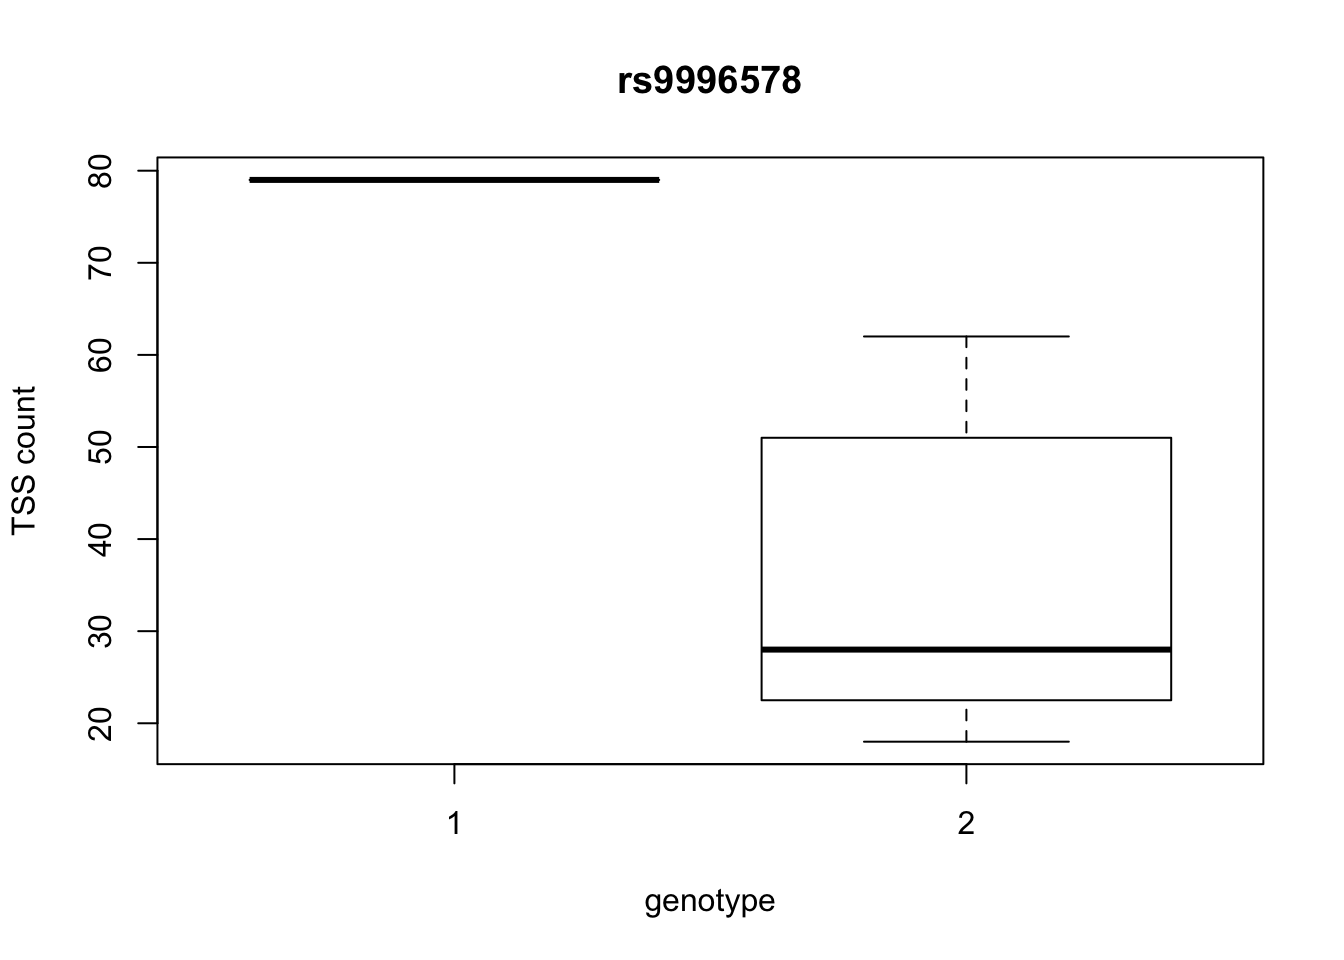
Selecting by gene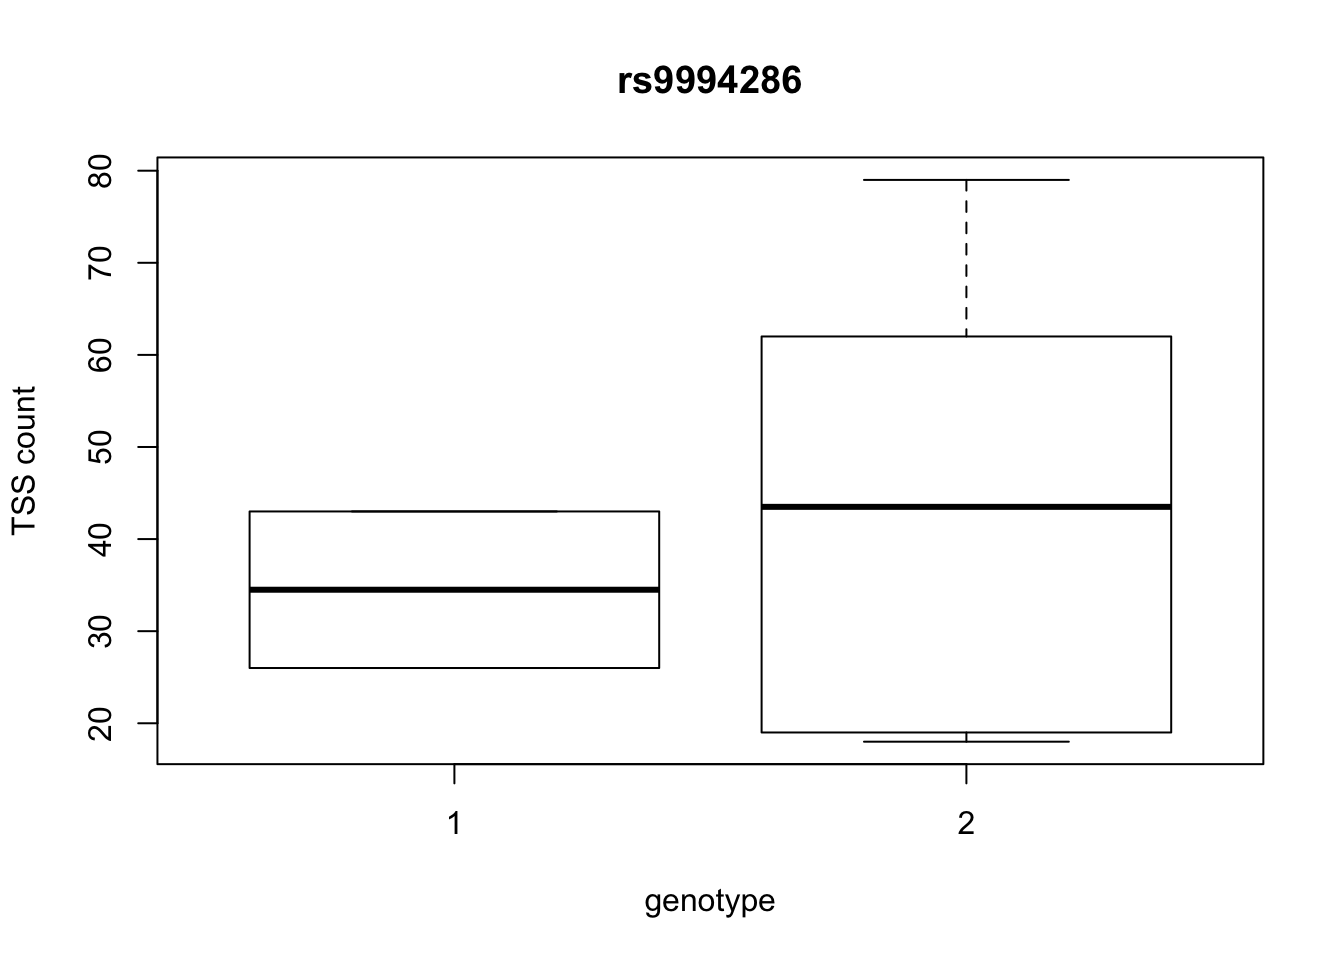
Selecting by gene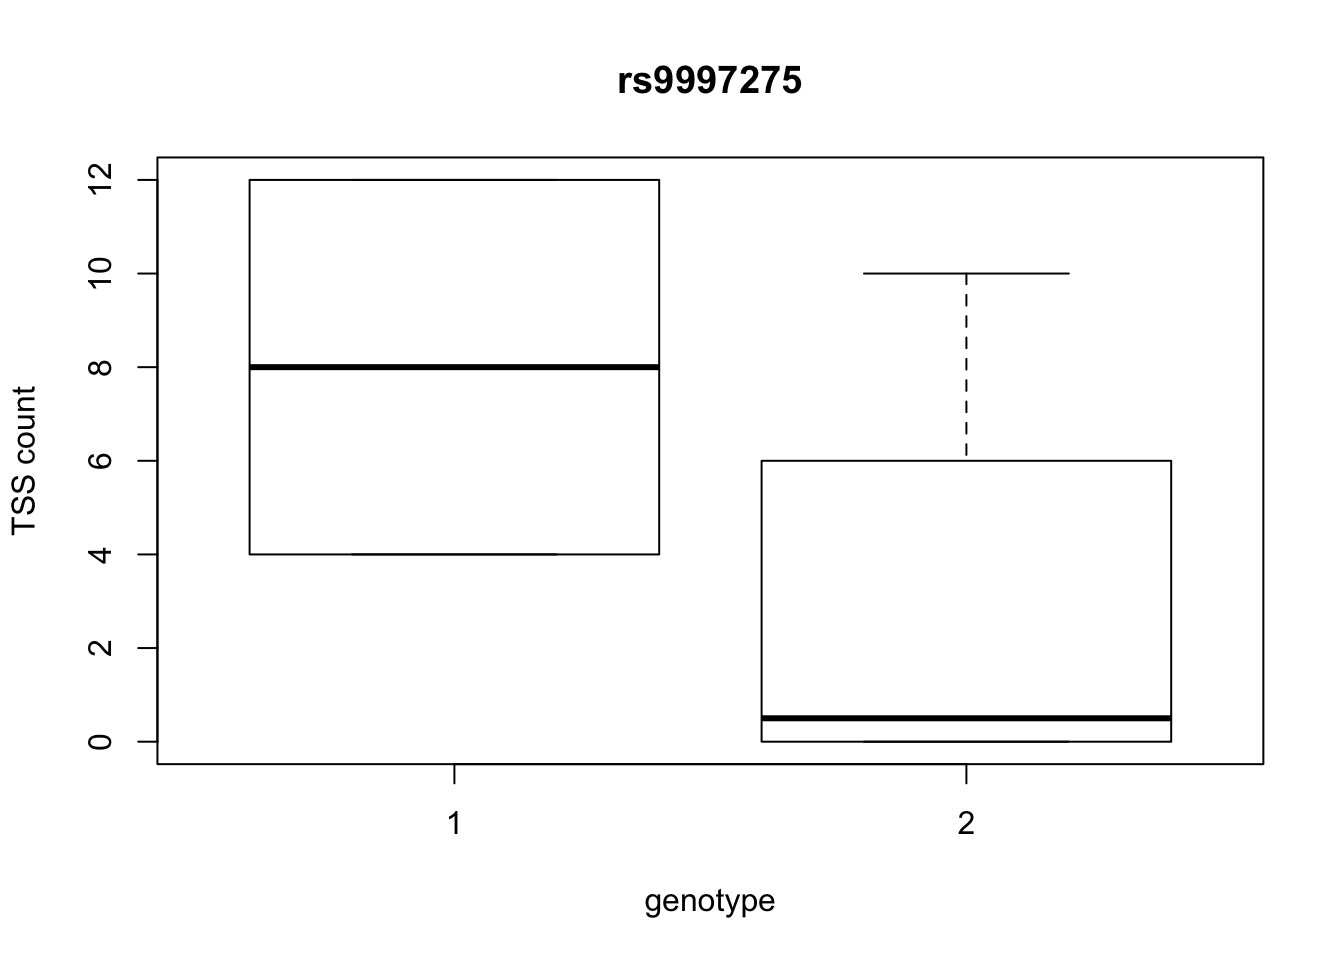
Selecting by gene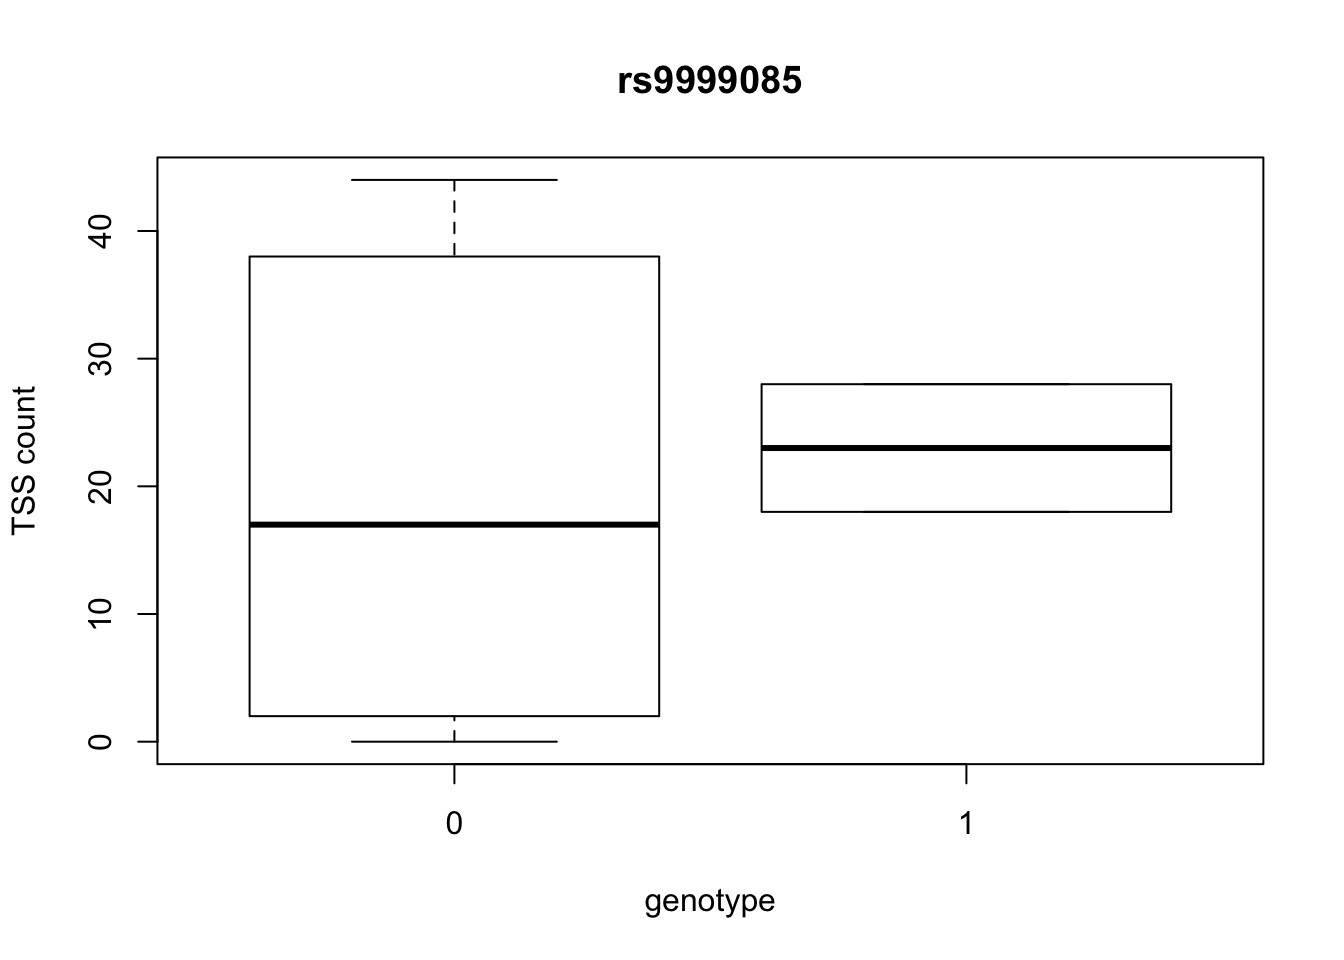
Selecting by gene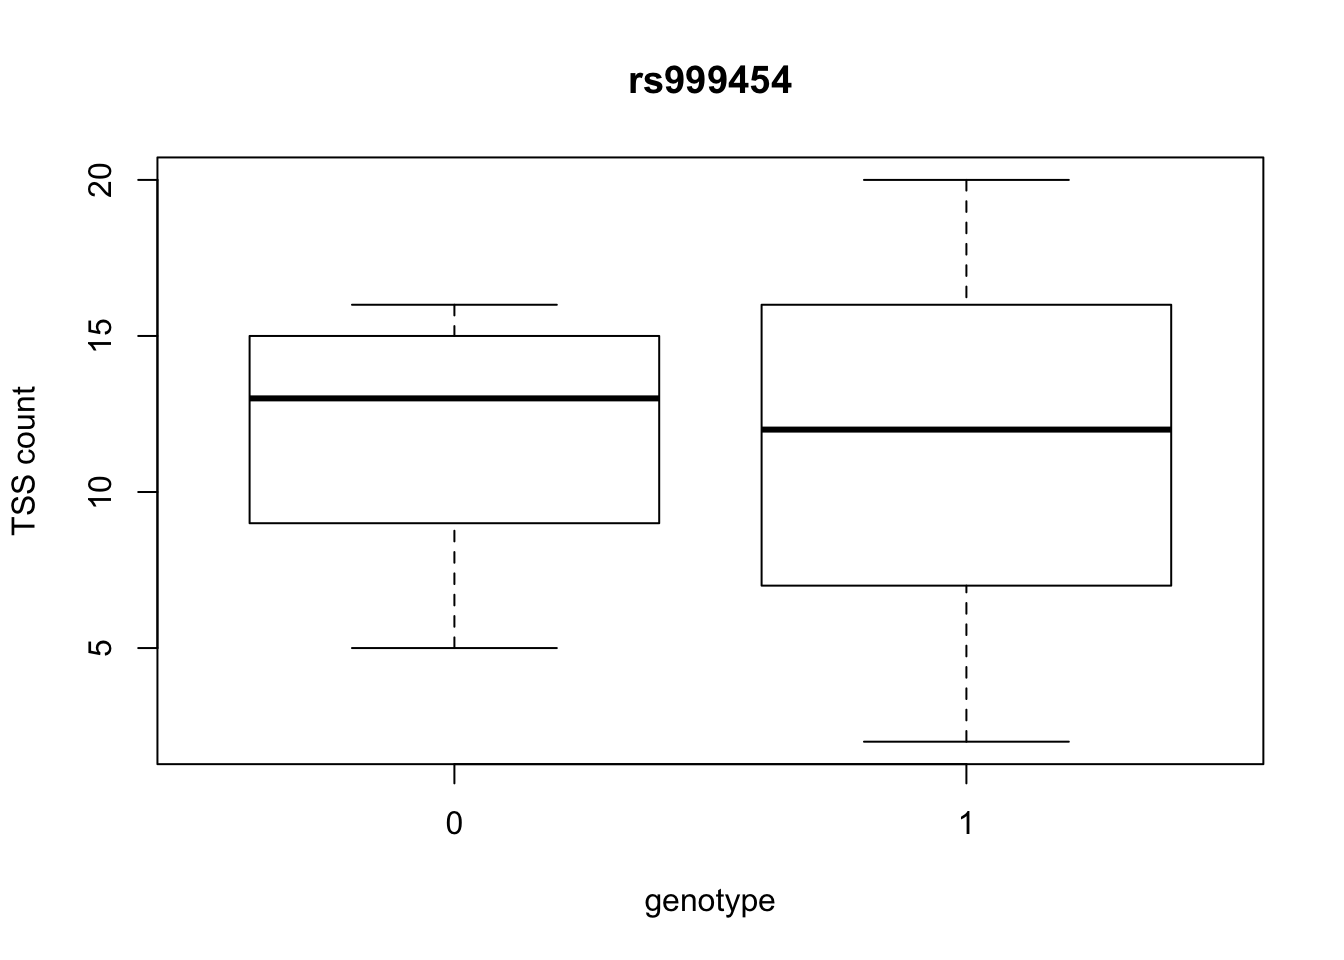
Selecting by gene
Selecting by gene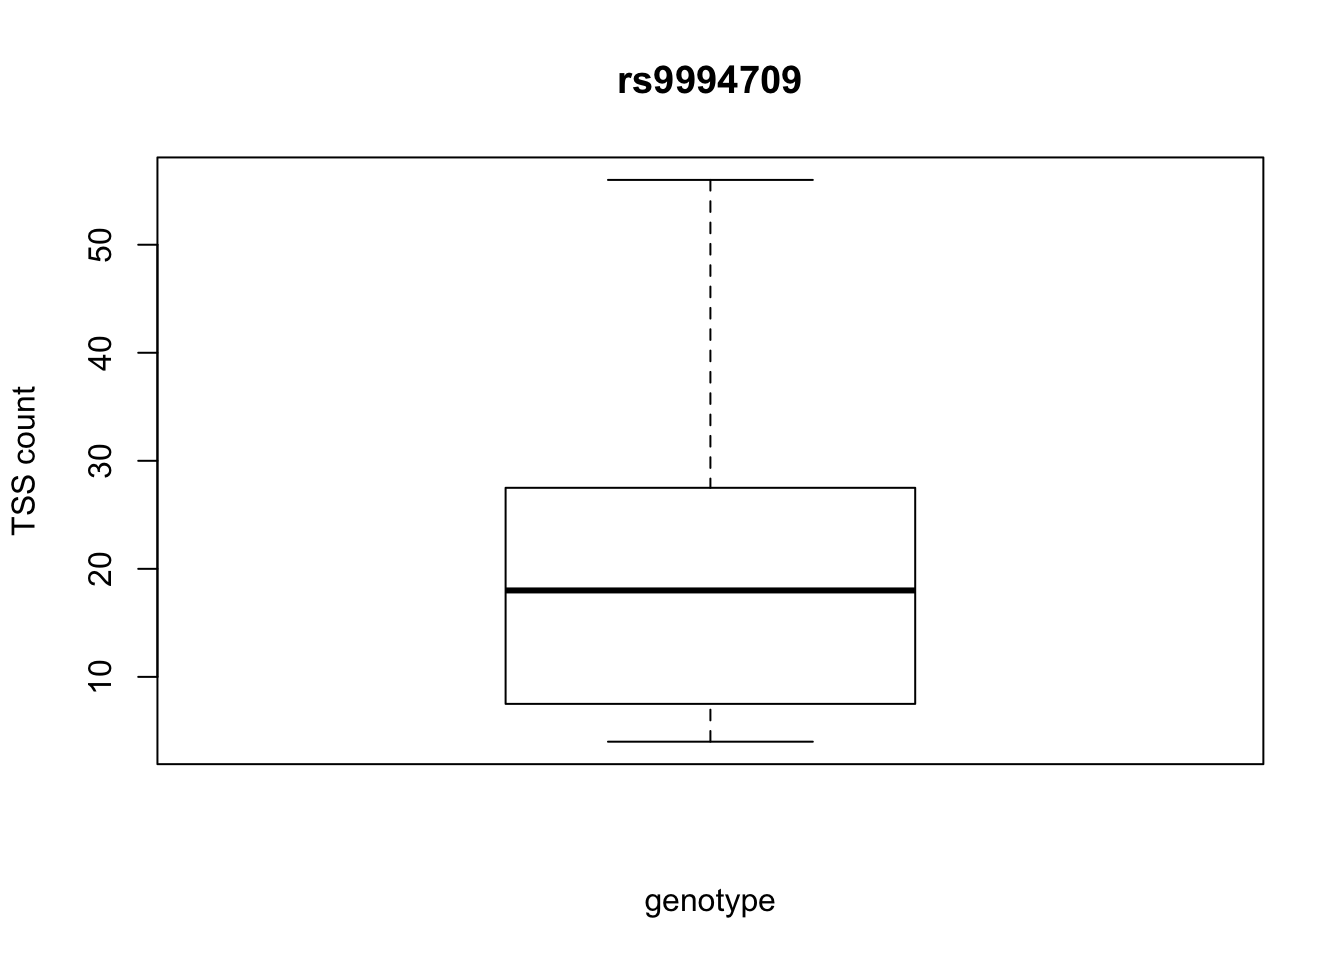
There are 16362 eqtls that we have genotype and expression information for.
Session information
sessionInfo()R version 3.4.2 (2017-09-28)
Platform: x86_64-apple-darwin15.6.0 (64-bit)
Running under: macOS Sierra 10.12.6
Matrix products: default
BLAS: /Library/Frameworks/R.framework/Versions/3.4/Resources/lib/libRblas.0.dylib
LAPACK: /Library/Frameworks/R.framework/Versions/3.4/Resources/lib/libRlapack.dylib
locale:
[1] en_US.UTF-8/en_US.UTF-8/en_US.UTF-8/C/en_US.UTF-8/en_US.UTF-8
attached base packages:
[1] stats graphics grDevices utils datasets methods base
other attached packages:
[1] bindrcpp_0.2 plyr_1.8.4 ggplot2_2.2.1 reshape2_1.4.3
[5] dplyr_0.7.4 tidyr_0.7.2 workflowr_0.7.0 rmarkdown_1.8.5
loaded via a namespace (and not attached):
[1] Rcpp_0.12.15 knitr_1.18 bindr_0.1 magrittr_1.5
[5] tidyselect_0.2.3 munsell_0.4.3 colorspace_1.3-2 R6_2.2.2
[9] rlang_0.1.6 stringr_1.2.0 tools_3.4.2 grid_3.4.2
[13] gtable_0.2.0 git2r_0.21.0 htmltools_0.3.6 lazyeval_0.2.1
[17] yaml_2.1.16 rprojroot_1.3-2 digest_0.6.14 assertthat_0.2.0
[21] tibble_1.4.2 purrr_0.2.4 glue_1.2.0 evaluate_0.10.1
[25] labeling_0.3 stringi_1.1.6 compiler_3.4.2 pillar_1.1.0
[29] scales_0.5.0 backports_1.1.2 pkgconfig_2.0.1 This R Markdown site was created with workflowr