<!DOCTYPE html> <html xmlns="http://www.w3.org/1999/xhtml"> <head> <meta charset="utf-8" /> <meta http-equiv="Content-Type" content="text/html; charset=utf-8" /> <meta name="generator" content="pandoc" /> <meta name="author" content="Briana Mittleman" /> <meta name="date" content="2017-12-13" /> <title>Create Gviz genome track plots</title> <script src="site_libs/jquery-1.11.3/jquery.min.js"></script> <meta name="viewport" content="width=device-width, initial-scale=1" /> <link href="site_libs/bootstrap-3.3.5/css/cosmo.min.css" rel="stylesheet" /> <script src="site_libs/bootstrap-3.3.5/js/bootstrap.min.js"></script> <script src="site_libs/bootstrap-3.3.5/shim/html5shiv.min.js"></script> <script src="site_libs/bootstrap-3.3.5/shim/respond.min.js"></script> <script src="site_libs/jqueryui-1.11.4/jquery-ui.min.js"></script> <link href="site_libs/tocify-1.9.1/jquery.tocify.css" rel="stylesheet" /> <script src="site_libs/tocify-1.9.1/jquery.tocify.js"></script> <script src="site_libs/navigation-1.1/tabsets.js"></script> <link href="site_libs/highlightjs-9.12.0/textmate.css" rel="stylesheet" /> <script src="site_libs/highlightjs-9.12.0/highlight.js"></script> <link href="site_libs/font-awesome-4.5.0/css/font-awesome.min.css" rel="stylesheet" /> <style type="text/css">code{white-space: pre;}</style> <style type="text/css"> pre:not([class]) { background-color: white; } </style> <script type="text/javascript"> if (window.hljs) { hljs.configure({languages: []}); hljs.initHighlightingOnLoad(); if (document.readyState && document.readyState === "complete") { window.setTimeout(function() { hljs.initHighlighting(); }, 0); } } </script> <style type="text/css"> h1 { font-size: 34px; } h1.title { font-size: 38px; } h2 { font-size: 30px; } h3 { font-size: 24px; } h4 { font-size: 18px; } h5 { font-size: 16px; } h6 { font-size: 12px; } .table th:not([align]) { text-align: left; } </style> </head> <body> <style type = "text/css"> .main-container { max-width: 940px; margin-left: auto; margin-right: auto; } code { color: inherit; background-color: rgba(0, 0, 0, 0.04); } img { max-width:100%; height: auto; } .tabbed-pane { padding-top: 12px; } button.code-folding-btn:focus { outline: none; } </style> <style type="text/css"> /* padding for bootstrap navbar */ body { padding-top: 51px; padding-bottom: 40px; } /* offset scroll position for anchor links (for fixed navbar) */ .section h1 { padding-top: 56px; margin-top: -56px; } .section h2 { padding-top: 56px; margin-top: -56px; } .section h3 { padding-top: 56px; margin-top: -56px; } .section h4 { padding-top: 56px; margin-top: -56px; } .section h5 { padding-top: 56px; margin-top: -56px; } .section h6 { padding-top: 56px; margin-top: -56px; } </style> <script> // manage active state of menu based on current page $(document).ready(function () { // active menu anchor href = window.location.pathname href = href.substr(href.lastIndexOf('/') + 1) if (href === "") href = "index.html"; var menuAnchor = $('a[href="' + href + '"]'); // mark it active menuAnchor.parent().addClass('active'); // if it's got a parent navbar menu mark it active as well menuAnchor.closest('li.dropdown').addClass('active'); }); </script> <div class="container-fluid main-container"> <!-- tabsets --> <script> $(document).ready(function () { window.buildTabsets("TOC"); }); </script> <!-- code folding --> <script> $(document).ready(function () { // move toc-ignore selectors from section div to header $('div.section.toc-ignore') .removeClass('toc-ignore') .children('h1,h2,h3,h4,h5').addClass('toc-ignore'); // establish options var options = { selectors: "h1,h2,h3", theme: "bootstrap3", context: '.toc-content', hashGenerator: function (text) { return text.replace(/[.\\/?&!#<>]/g, '').replace(/\s/g, '_').toLowerCase(); }, ignoreSelector: ".toc-ignore", scrollTo: 0 }; options.showAndHide = true; options.smoothScroll = true; // tocify var toc = $("#TOC").tocify(options).data("toc-tocify"); }); </script> <style type="text/css"> #TOC { margin: 25px 0px 20px 0px; } @media (max-width: 768px) { #TOC { position: relative; width: 100%; } } .toc-content { padding-left: 30px; padding-right: 40px; } div.main-container { max-width: 1200px; } div.tocify { width: 20%; max-width: 260px; max-height: 85%; } @media (min-width: 768px) and (max-width: 991px) { div.tocify { width: 25%; } } @media (max-width: 767px) { div.tocify { width: 100%; max-width: none; } } .tocify ul, .tocify li { line-height: 20px; } .tocify-subheader .tocify-item { font-size: 0.90em; padding-left: 25px; text-indent: 0; } .tocify .list-group-item { border-radius: 0px; } </style> <!-- setup 3col/9col grid for toc_float and main content --> <div class="row-fluid"> <div class="col-xs-12 col-sm-4 col-md-3"> <div id="TOC" class="tocify"> </div> </div> <div class="toc-content col-xs-12 col-sm-8 col-md-9"> <div class="navbar navbar-default navbar-fixed-top" role="navigation"> <div class="container"> <div class="navbar-header"> <button type="button" class="navbar-toggle collapsed" data-toggle="collapse" data-target="#navbar"> <span class="icon-bar"></span> <span class="icon-bar"></span> <span class="icon-bar"></span> </button> <a class="navbar-brand" href="index.html">Net-seq</a> </div> <div id="navbar" class="navbar-collapse collapse"> <ul class="nav navbar-nav"> <li> <a href="index.html">Home</a> </li> <li> <a href="about.html">About</a> </li> <li> <a href="license.html">License</a> </li> </ul> <ul class="nav navbar-nav navbar-right"> <li> <a href="https://github.com/brimittleman/Net-seq"> <span class="fa fa-github"></span> </a> </li> </ul> </div><!--/.nav-collapse --> </div><!--/.container --> </div><!--/.navbar --> <div class="fluid-row" id="header"> <h1 class="title toc-ignore">Create Gviz genome track plots</h1> <h4 class="author"><em>Briana Mittleman</em></h4> <h4 class="date"><em>2017-12-13</em></h4> </div> <!-- The file analysis/chunks.R contains chunks that define default settings shared across the workflowr files. --> <!-- Update knitr chunk options --> <!-- Insert the date the file was last updated --> <p><strong>Last updated:</strong> 2017-12-19</p> <!-- Insert the code version (Git commit SHA1) if Git repository exists and R package git2r is installed --> <p><strong>Code version:</strong> 1d63e1d</p> <!-- Add your analysis here --> <p>The goal of this analysis is to create nice plots showing that we are getting as much information as the 1 lane from the Mayer sample. I will do this with our merged data vs. their 1 lane.</p> <p>Genes from IGV that I want to use:</p> <ul> <li><p>HERPUD1 chr16:56,964,002-56,979,793</p></li> <li><p>ACTB chr7:5,564,779-5,572,232</p></li> <li><p>CCNB2 chr15:59,396,707-59,401,006</p></li> <li><p>chr11:234,336-239,997</p></li> <li><p>KIAA0100 chr17:26,968,078-26,974,887</p></li> <li><p>HECTD1 chr14:31,672,040-31,681,043</p></li> <li><p>STAG1 chr3:136,469,421-136,472,771</p></li> <li><p>SRSF3</p></li> <li><p>ENO1</p></li> </ul> <p>Load Packages:</p> <pre class="r"><code>library(Gviz)</code></pre> <pre><code>Loading required package: S4Vectors</code></pre> <pre><code>Loading required package: stats4</code></pre> <pre><code>Loading required package: BiocGenerics</code></pre> <pre><code>Loading required package: parallel</code></pre> <pre><code> Attaching package: 'BiocGenerics'</code></pre> <pre><code>The following objects are masked from 'package:parallel': clusterApply, clusterApplyLB, clusterCall, clusterEvalQ, clusterExport, clusterMap, parApply, parCapply, parLapply, parLapplyLB, parRapply, parSapply, parSapplyLB</code></pre> <pre><code>The following objects are masked from 'package:stats': IQR, mad, sd, var, xtabs</code></pre> <pre><code>The following objects are masked from 'package:base': anyDuplicated, append, as.data.frame, cbind, colMeans, colnames, colSums, do.call, duplicated, eval, evalq, Filter, Find, get, grep, grepl, intersect, is.unsorted, lapply, lengths, Map, mapply, match, mget, order, paste, pmax, pmax.int, pmin, pmin.int, Position, rank, rbind, Reduce, rowMeans, rownames, rowSums, sapply, setdiff, sort, table, tapply, union, unique, unsplit, which, which.max, which.min</code></pre> <pre><code> Attaching package: 'S4Vectors'</code></pre> <pre><code>The following object is masked from 'package:base': expand.grid</code></pre> <pre><code>Loading required package: IRanges</code></pre> <pre><code>Loading required package: GenomicRanges</code></pre> <pre><code>Loading required package: GenomeInfoDb</code></pre> <pre><code>Loading required package: grid</code></pre> <pre class="r"><code>library(GenomicRanges) library(biomaRt) library(TxDb.Hsapiens.UCSC.hg19.knownGene)</code></pre> <pre><code>Loading required package: GenomicFeatures</code></pre> <pre><code>Loading required package: AnnotationDbi</code></pre> <pre><code>Loading required package: Biobase</code></pre> <pre><code>Welcome to Bioconductor Vignettes contain introductory material; view with 'browseVignettes()'. To cite Bioconductor, see 'citation("Biobase")', and for packages 'citation("pkgname")'.</code></pre> <pre class="r"><code>library("IRanges") library("dplyr")</code></pre> <pre><code> Attaching package: 'dplyr'</code></pre> <pre><code>The following object is masked from 'package:AnnotationDbi': select</code></pre> <pre><code>The following object is masked from 'package:Biobase': combine</code></pre> <pre><code>The following object is masked from 'package:biomaRt': select</code></pre> <pre><code>The following objects are masked from 'package:GenomicRanges': intersect, setdiff, union</code></pre> <pre><code>The following object is masked from 'package:GenomeInfoDb': intersect</code></pre> <pre><code>The following objects are masked from 'package:IRanges': collapse, desc, intersect, setdiff, slice, union</code></pre> <pre><code>The following objects are masked from 'package:S4Vectors': first, intersect, rename, setdiff, setequal, union</code></pre> <pre><code>The following objects are masked from 'package:BiocGenerics': combine, intersect, setdiff, union</code></pre> <pre><code>The following objects are masked from 'package:stats': filter, lag</code></pre> <pre><code>The following objects are masked from 'package:base': intersect, setdiff, setequal, union</code></pre> <pre class="r"><code>library("data.table")</code></pre> <pre><code> Attaching package: 'data.table'</code></pre> <pre><code>The following objects are masked from 'package:dplyr': between, first, last</code></pre> <pre><code>The following object is masked from 'package:GenomicRanges': shift</code></pre> <pre><code>The following object is masked from 'package:IRanges': shift</code></pre> <pre><code>The following objects are masked from 'package:S4Vectors': first, second</code></pre> <pre class="r"><code>library("GenomicAlignments")</code></pre> <pre><code>Loading required package: SummarizedExperiment</code></pre> <pre><code>Loading required package: DelayedArray</code></pre> <pre><code>Loading required package: matrixStats</code></pre> <pre><code> Attaching package: 'matrixStats'</code></pre> <pre><code>The following object is masked from 'package:dplyr': count</code></pre> <pre><code>The following objects are masked from 'package:Biobase': anyMissing, rowMedians</code></pre> <pre><code> Attaching package: 'DelayedArray'</code></pre> <pre><code>The following objects are masked from 'package:matrixStats': colMaxs, colMins, colRanges, rowMaxs, rowMins, rowRanges</code></pre> <pre><code>The following object is masked from 'package:base': apply</code></pre> <pre><code>Loading required package: Biostrings</code></pre> <pre><code>Loading required package: XVector</code></pre> <pre><code> Attaching package: 'Biostrings'</code></pre> <pre><code>The following object is masked from 'package:DelayedArray': type</code></pre> <pre><code>The following object is masked from 'package:base': strsplit</code></pre> <pre><code>Loading required package: Rsamtools</code></pre> <pre><code> Attaching package: 'GenomicAlignments'</code></pre> <pre><code>The following object is masked from 'package:data.table': last</code></pre> <pre><code>The following object is masked from 'package:dplyr': last</code></pre> <p>Upload data:</p> <pre class="r"><code>chr= "chr7" gen= "hg19" merged_data_7= DataTrack(range = "../data/bam_files_chr/merged_Net1_chr.bam", genome = gen, type = "h", name = "Merged", window = -1, chromosome = "chr7") mayer_data_7= DataTrack(range = "../data/bam_files_chr/mayer_chr.bam", genome = gen, type = "h", name = "Mayer", window = -1, chromosome = "chr7") refGenes <- UcscTrack(genome= gen, chromosome=chr, track="RefSeq Genes", from = 5555158, to = 5581854, trackType="GeneRegionTrack", rstarts="exonStarts", rends="exonEnds", gene="name", symbol="name2", transcript="name", strand="strand", fill="#800000", name="RefSeq Genes", showId=TRUE) gtrack = GenomeAxisTrack() itrack= IdeogramTrack(genome = gen, chromosome = chr) #plots plotTracks(list(itrack,gtrack, merged_data_7, mayer_data_7, refGenes), from = 5555158, to = 5581854, background.title="darkblue", background.panel = "#FFFEDB")</code></pre> <p><img src="figure/gviz_plots.Rmd/unnamed-chunk-2-1.png" width="672" style="display: block; margin: auto;" /></p> <pre class="r"><code>
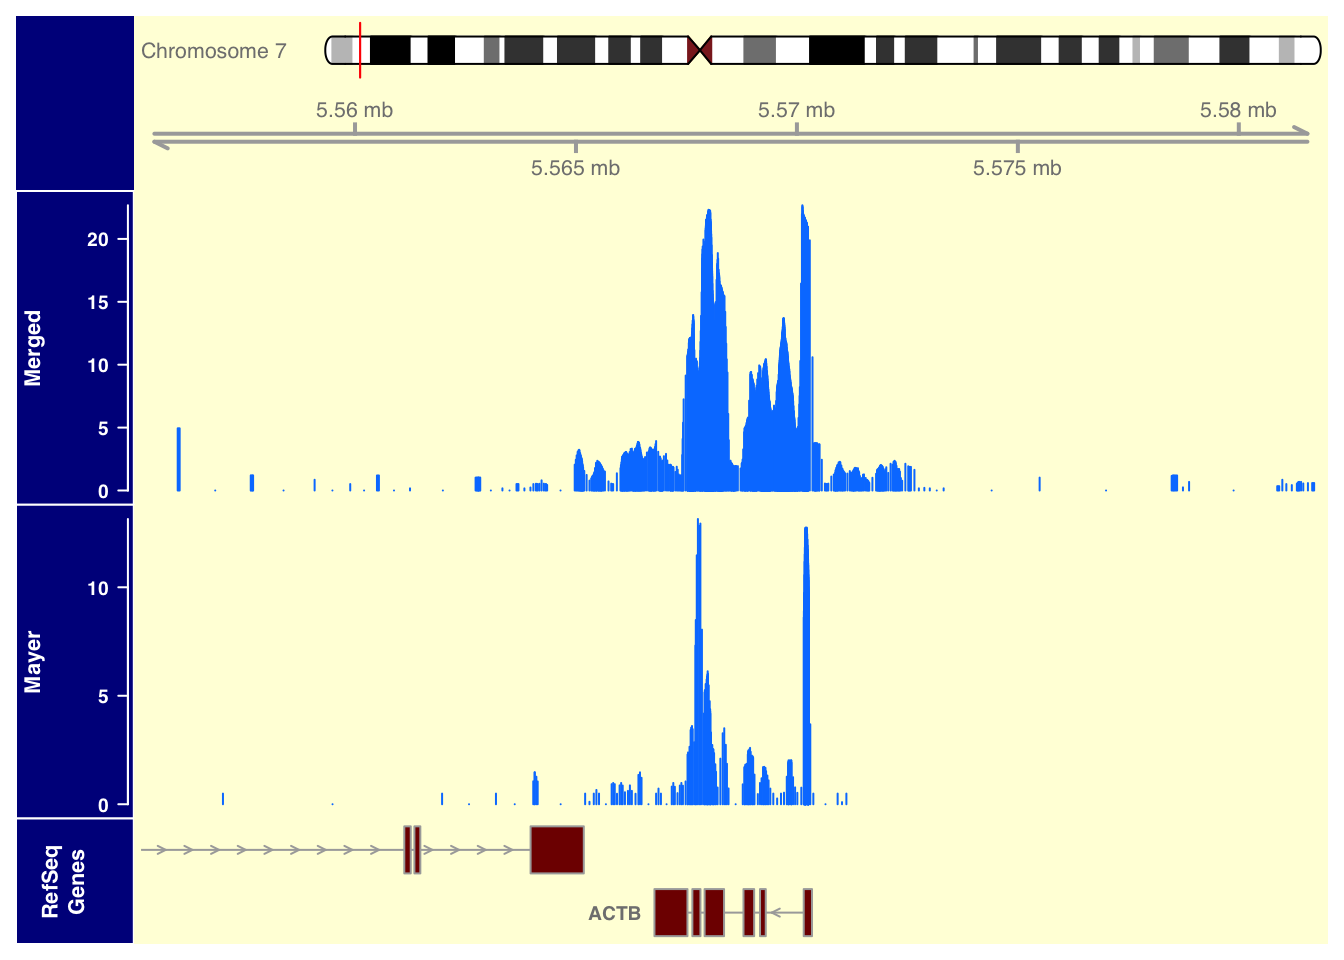
merged_anno_7= AnnotationTrack(range = "../data/bam_files_chr/merged_Net1_chr.bam", genome = gen, name = "Merged", window = -1, chromosome = chr) mayer_anno_7= AnnotationTrack(range = "../data/bam_files_chr/mayer_chr.bam", genome = gen, name = "Mayer", window = -1, chromosome = chr) plotTracks(list(merged_data_7, merged_anno_7), from = 5564779, to = 5572232)</code></pre> <p><img src="figure/gviz_plots.Rmd/unnamed-chunk-3-1.png" width="672" style="display: block; margin: auto;" /></p> <pre class="r"><code>
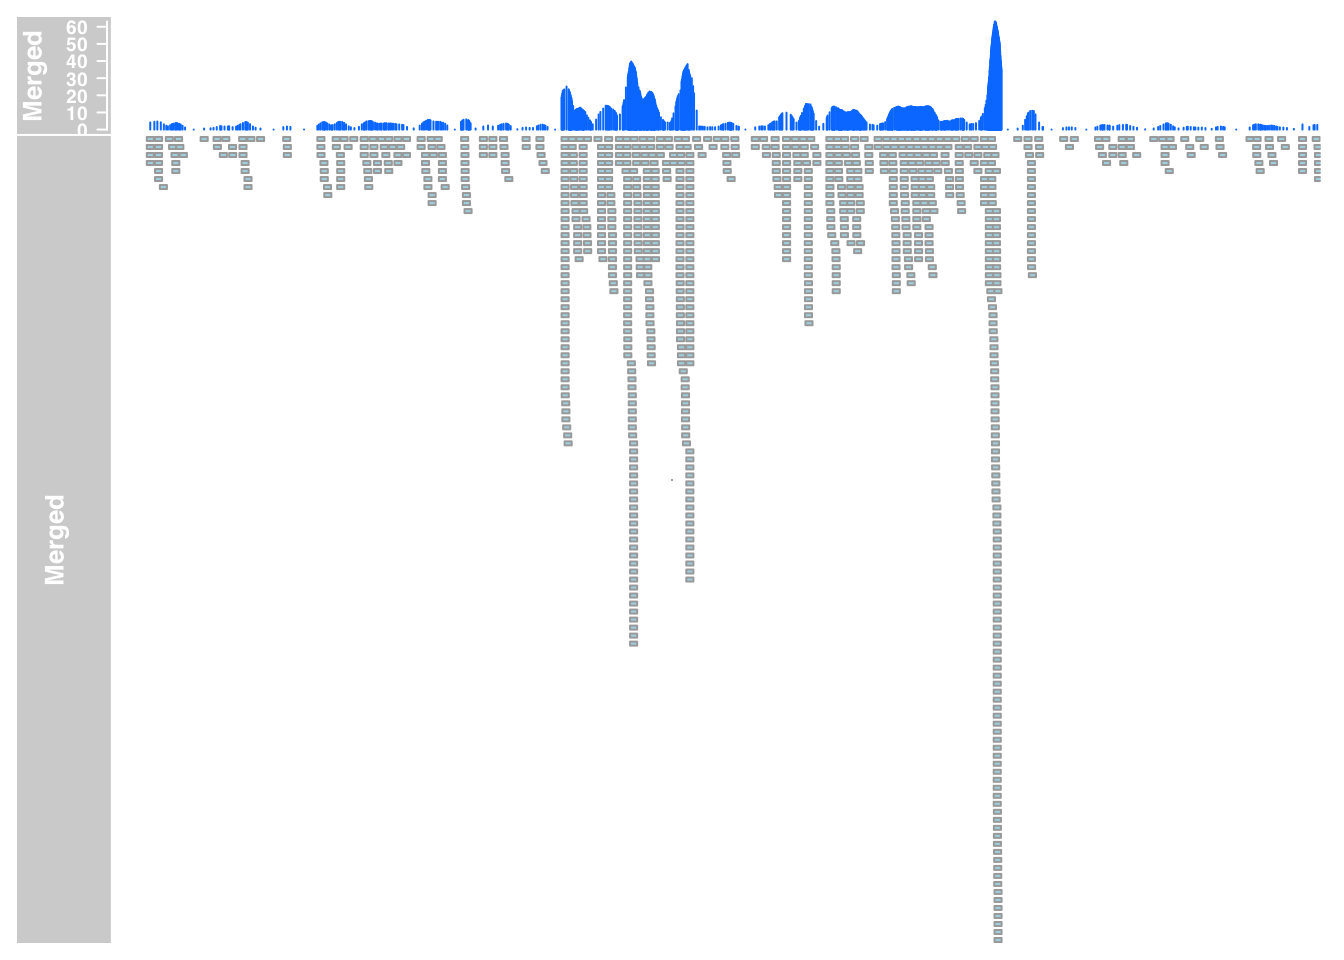
plotTracks(list(mayer_data_7,mayer_anno_7), from = 5564779, to = 5572232)</code></pre> <p><img src="figure/gviz_plots.Rmd/unnamed-chunk-3-2.png" width="672" style="display: block; margin: auto;" /></p> <div id="create-a-function-for-the-plots" class="section level3"> <h3>
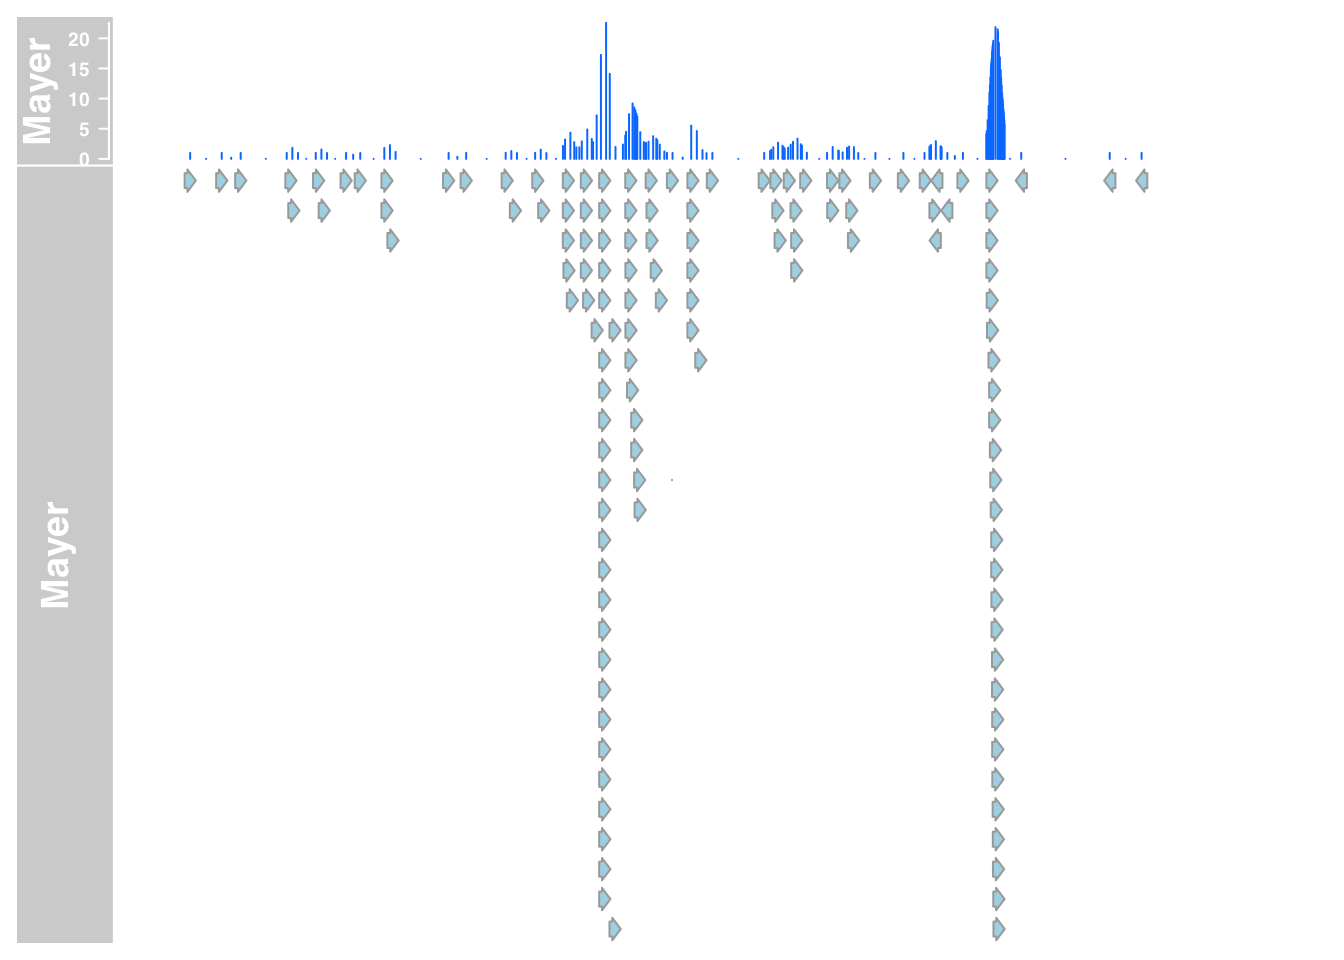
Create a function for the plots</h3> <pre class="r"><code>track_plot=function(chrom, from, to){ gen= "hg19" chr= chrom merged_data= DataTrack(range = "../data/bam_files_chr/merged_Net1_chr.bam", genome = gen, type = "h", name = "Merged", window = -1, chromosome = chr) mayer_data= DataTrack(range = "../data/bam_files_chr/mayer_chr.bam", genome = gen, type = "h", name = "Mayer", window = -1, chromosome = chr) refGenes <- UcscTrack(genome= gen, chromosome=chr, track="RefSeq Genes", from = from, to = to, trackType="GeneRegionTrack", rstarts="exonStarts", rends="exonEnds", gene="name", symbol="name2", transcript="name", strand="strand", fill="#800000", name="RefSeq Genes", showId=TRUE) gtrack = GenomeAxisTrack() itrack= IdeogramTrack(genome = gen, chromosome = chr) plot= plotTracks(list(itrack,gtrack, merged_data, mayer_data, refGenes), from = from, to = to, background.title="darkblue", background.panel = "#FFFEDB") return(plot) }</code></pre> <pre class="r"><code>#plot_SRSF3= track_plot("chr6",36564332,36571507)</code></pre> <pre class="r"><code>#plot_ENO1=track_plot("chr1",8919652,8940558 )</code></pre> <pre class="r"><code>#plot_tars=track_plot("chr5",33438802,33468000)</code></pre> <pre class="r"><code>#plot_CAXN= track_plot("chr5",179123129,179159838) #future: change track size with sizes=c(5,1,5) commpand in plot track #plot_ALDOA= track_plot("chr16",30080421,30082314) #plot_XRCC5= track_plot("chr2", 216968869,217009667) #plot_TUBB= track_plot("chr6",30684274,30698626)</code></pre> <div id="fix-in-terminal" class="section level4"> <h4>Fix in terminal</h4> <p>Add the chr tag to the bam files.</p> <pre class="bash"><code>samtools view -h SRR1575922-sort.bam | awk 'BEGIN{FS=OFS="\t"} (/^@/ && !/@SQ/){print $0} $2~/^SN:[1-9]|^SN:X|^SN:Y|^SN:MT/{print $0} $3~/^[1-9]|X|Y|MT/{$3="chr"$3; print $0} ' | sed 's/SN:/SN:chr/g' | sed 's/chrMT/chrM/g' | samtools view -bS - > mayer_chr.bam samtools view -h merged_Net1.bam | awk 'BEGIN{FS=OFS="\t"} (/^@/ && !/@SQ/){print $0} $2~/^SN:[1-9]|^SN:X|^SN:Y|^SN:MT/{print $0} $3~/^[1-9]|X|Y|MT/{$3="chr"$3; print $0} ' | sed 's/SN:/SN:chr/g' | sed 's/chrMT/chrM/g' | samtools view -bS - > merged_Net1_chr.bam</code></pre> <p>index the bam files:</p> <pre class="bash"><code>samtools index mayer_chr.bam samtools index merged_Net1_chr.bam</code></pre> </div> </div> <div id="session-information" class="section level2"> <h2>Session information</h2> <!-- Insert the session information into the document --> <pre class="r"><code>sessionInfo()</code></pre> <pre><code>R version 3.4.2 (2017-09-28) Platform: x86_64-apple-darwin15.6.0 (64-bit) Running under: macOS Sierra 10.12.6 Matrix products: default BLAS: /Library/Frameworks/R.framework/Versions/3.4/Resources/lib/libRblas.0.dylib LAPACK: /Library/Frameworks/R.framework/Versions/3.4/Resources/lib/libRlapack.dylib locale: [1] en_US.UTF-8/en_US.UTF-8/en_US.UTF-8/C/en_US.UTF-8/en_US.UTF-8 attached base packages: [1] grid parallel stats4 stats graphics grDevices utils [8] datasets methods base other attached packages: [1] GenomicAlignments_1.14.1 [2] Rsamtools_1.30.0 [3] Biostrings_2.46.0 [4] XVector_0.18.0 [5] SummarizedExperiment_1.8.0 [6] DelayedArray_0.4.1 [7] matrixStats_0.52.2 [8] data.table_1.10.4-3 [9] dplyr_0.7.4 [10] TxDb.Hsapiens.UCSC.hg19.knownGene_3.2.2 [11] GenomicFeatures_1.30.0 [12] AnnotationDbi_1.40.0 [13] Biobase_2.38.0 [14] biomaRt_2.34.0 [15] Gviz_1.22.2 [16] GenomicRanges_1.30.0 [17] GenomeInfoDb_1.14.0 [18] IRanges_2.12.0 [19] S4Vectors_0.16.0 [20] BiocGenerics_0.24.0 loaded via a namespace (and not attached): [1] ProtGenerics_1.10.0 bitops_1.0-6 [3] bit64_0.9-7 RColorBrewer_1.1-2 [5] progress_1.1.2 httr_1.3.1 [7] rprojroot_1.2 tools_3.4.2 [9] backports_1.1.2 R6_2.2.2 [11] rpart_4.1-11 Hmisc_4.0-3 [13] DBI_0.7 lazyeval_0.2.1 [15] colorspace_1.3-2 nnet_7.3-12 [17] gridExtra_2.3 prettyunits_1.0.2 [19] RMySQL_0.10.13 bit_1.1-12 [21] curl_3.1 compiler_3.4.2 [23] git2r_0.19.0 htmlTable_1.11.0 [25] rtracklayer_1.38.2 scales_0.5.0 [27] checkmate_1.8.5 stringr_1.2.0 [29] digest_0.6.13 foreign_0.8-69 [31] rmarkdown_1.8 base64enc_0.1-3 [33] dichromat_2.0-0 pkgconfig_2.0.1 [35] htmltools_0.3.6 ensembldb_2.2.0 [37] BSgenome_1.46.0 htmlwidgets_0.9 [39] rlang_0.1.4 rstudioapi_0.7 [41] RSQLite_2.0 BiocInstaller_1.28.0 [43] shiny_1.0.5 bindr_0.1 [45] BiocParallel_1.12.0 acepack_1.4.1 [47] VariantAnnotation_1.24.2 RCurl_1.95-4.8 [49] magrittr_1.5 GenomeInfoDbData_0.99.1 [51] Formula_1.2-2 Matrix_1.2-12 [53] Rcpp_0.12.14 munsell_0.4.3 [55] stringi_1.1.6 yaml_2.1.16 [57] zlibbioc_1.24.0 plyr_1.8.4 [59] AnnotationHub_2.10.1 blob_1.1.0 [61] lattice_0.20-35 splines_3.4.2 [63] knitr_1.17 XML_3.98-1.9 [65] glue_1.2.0 evaluate_0.10.1 [67] biovizBase_1.26.0 latticeExtra_0.6-28 [69] httpuv_1.3.5 gtable_0.2.0 [71] purrr_0.2.4 tidyr_0.7.2 [73] assertthat_0.2.0 ggplot2_2.2.1 [75] mime_0.5 xtable_1.8-2 [77] AnnotationFilter_1.2.0 survival_2.41-3 [79] tibble_1.3.4 memoise_1.1.0 [81] bindrcpp_0.2 cluster_2.0.6 [83] interactiveDisplayBase_1.16.0</code></pre> </div> <hr> <p> This <a href="http://rmarkdown.rstudio.com">R Markdown</a> site was created with <a href="https://github.com/jdblischak/workflowr">workflowr</a> </p> <hr> <!-- To enable disqus, uncomment the section below and provide your disqus_shortname --> <!-- disqus <div id="disqus_thread"></div> <script type="text/javascript"> /* * * CONFIGURATION VARIABLES: EDIT BEFORE PASTING INTO YOUR WEBPAGE * * */ var disqus_shortname = 'rmarkdown'; // required: replace example with your forum shortname /* * * DON'T EDIT BELOW THIS LINE * * */ (function() { var dsq = document.createElement('script'); dsq.type = 'text/javascript'; dsq.async = true; dsq.src = '//' + disqus_shortname + '.disqus.com/embed.js'; (document.getElementsByTagName('head')[0] || document.getElementsByTagName('body')[0]).appendChild(dsq); })(); </script> <noscript>Please enable JavaScript to view the <a href="http://disqus.com/?ref_noscript">comments powered by Disqus.</a></noscript> <a href="http://disqus.com" class="dsq-brlink">comments powered by <span class="logo-disqus">Disqus</span></a> --> </div> </div> </div> <script> // add bootstrap table styles to pandoc tables function bootstrapStylePandocTables() { $('tr.header').parent('thead').parent('table').addClass('table table-condensed'); } $(document).ready(function () { bootstrapStylePandocTables(); }); </script> <!-- dynamically load mathjax for compatibility with self-contained --> <script> (function () { var script = document.createElement("script"); script.type = "text/javascript"; script.src = "https://mathjax.rstudio.com/latest/MathJax.js?config=TeX-AMS-MML_HTMLorMML"; document.getElementsByTagName("head")[0].appendChild(script); })(); </script> </body> </html>