Initial Data exploration of Net-3
Briana Mittleman
2018-02-14
Last updated: 2018-02-14
Code version: d48ffe2
This analysis is to look at the quality of the library net-3. This has the first 8 libraries from the 16 pilot libraries.
18505
18508
18486
19239
19141
19193
19257
19128
The first step is to run the raw reads through my snakefile. To do this I have to change the project directory in the /project2/gilad/briana/net_seq_pipeline/config.yaml to /project2/gilad/briana/Net-seq/Net-seq3/ .
The reads will go in: /project2/gilad/briana/Net-seq/Net-seq3/data/fastq/
I first use gunzip to unzip all of the fastq files then I submit the snakemake file from /project2/gilad/briana/net_seq_pipeline with nohup scripts/submit-snakemake.sh
Look at number of reads, mapped reads, deduplicated reads.
‘samtools view -c -F 4’
libraries=c("18486", "18505", "18508", "19128", "19141", "19193", "19239", '19257')
fastq=c( 34342214,42959246,205654644, 51413661,211367408,52841852,54253650,45506210)
mapped=c(14018943,23607050,26532568,38084941,28165596,37084191,37095436,26636660)
dedup= c(1446379, 1032174,1642314,2469438,1926300,2717515, 2361238, 1377712 )

read_count=rbind(fastq,mapped,dedup)
colnames(read_count)=libraries
total_reads= sum(fastq)
total_reads[1] 698338885total_map= sum(mapped)
total_map[1] 231225385total_dedup= sum(dedup)
total_dedup[1] 14973070total_map/total_reads[1] 0.3311077total_dedup/total_map[1] 0.0647553Make a plot to look at this by line:
count_plot=barplot(as.matrix(read_count), main="Counts for coverage and complexity",
  xlab="Library", col=c("lightskyblue2","dodgerblue1","navy"),
    ylab="Read counts")
legend("topright", legend = c("total", "mapped", "UMI"), col=c("lightskyblue2","dodgerblue1","navy"), pch=20, cex = .75)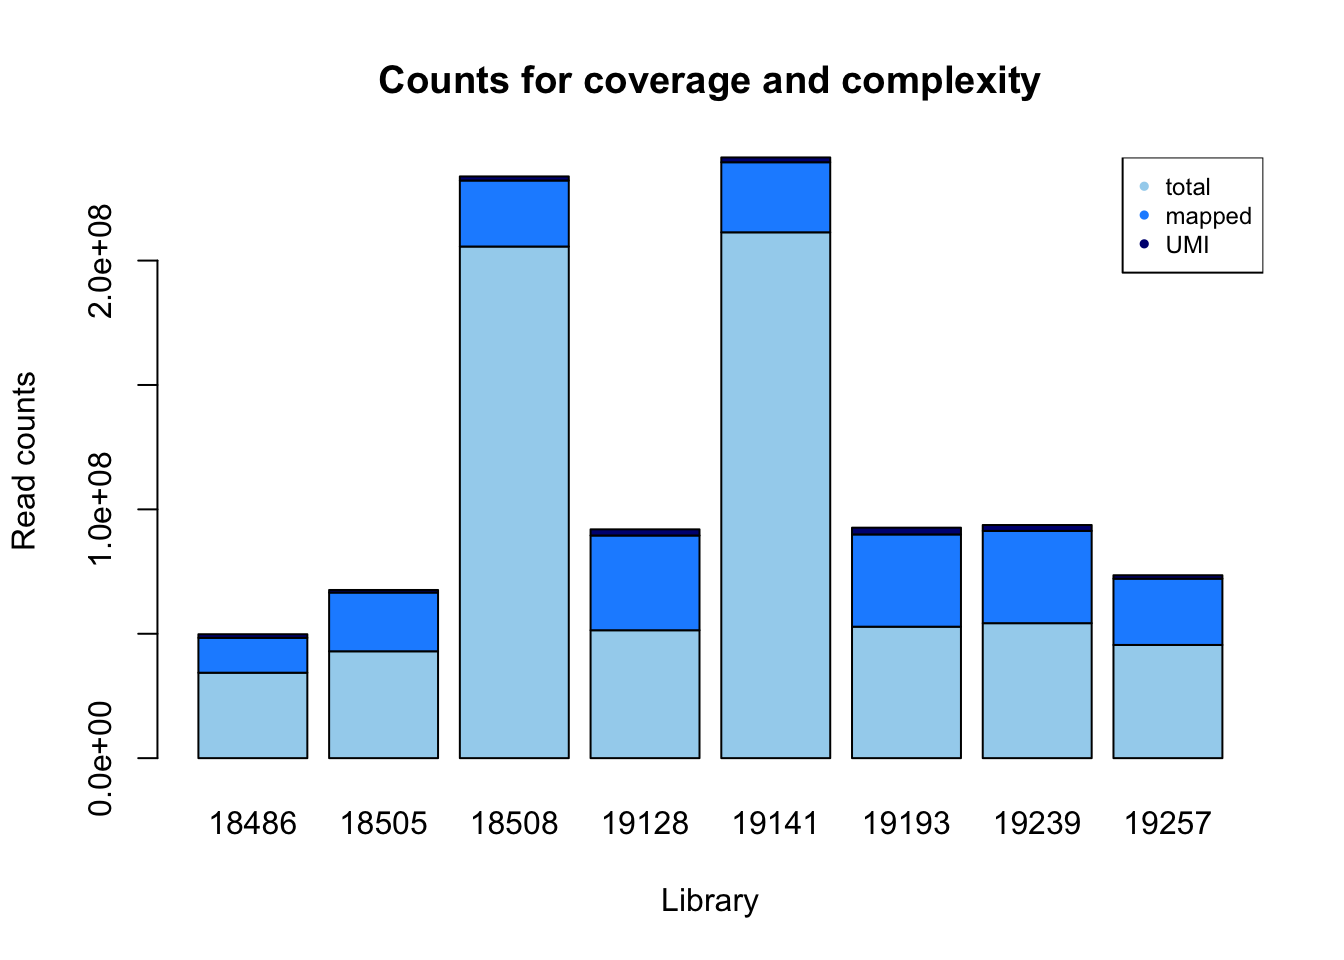
Look at this by proportions:
percent_mapped= mapped/fastq
percent_mapped
[1] 0.4082131 0.5495220 0.1290152 0.7407553 0.1332542 0.7017958 0.6837408
[8] 0.5853412percent_UMI= dedup/fastq
percent_not_mapped= 1- percent_mapped - percent_UMI
prop=rbind(percent_not_mapped, percent_mapped, percent_UMI)
colnames(prop)= libraries
prop_plot=barplot(as.matrix(prop), main="Proportions for coverage and complexity",
xlab="Library", col=c("lightskyblue2","dodgerblue1","navy"),
ylab="Proportion of sequenced reads")
legend("bottomright", legend = c("un-mapped", "mapped", "UMI"), col=c("lightskyblue2","dodgerblue1","navy"), pch=20, cex = 0.75)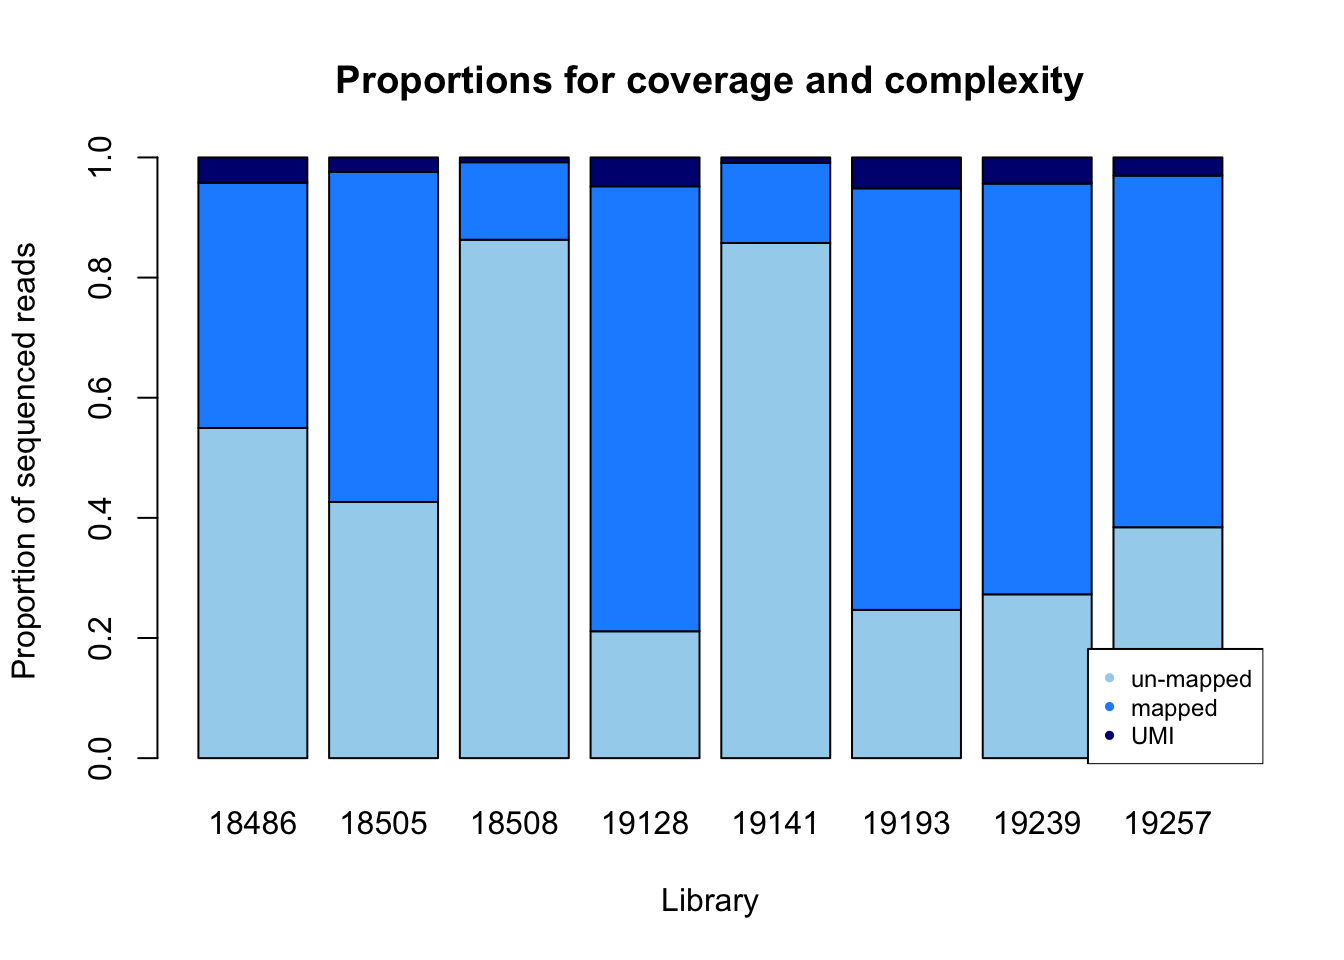
Session information
sessionInfo()R version 3.4.2 (2017-09-28)
Platform: x86_64-apple-darwin15.6.0 (64-bit)
Running under: macOS Sierra 10.12.6
Matrix products: default
BLAS: /Library/Frameworks/R.framework/Versions/3.4/Resources/lib/libRblas.0.dylib
LAPACK: /Library/Frameworks/R.framework/Versions/3.4/Resources/lib/libRlapack.dylib
locale:
[1] en_US.UTF-8/en_US.UTF-8/en_US.UTF-8/C/en_US.UTF-8/en_US.UTF-8
attached base packages:
[1] stats graphics grDevices utils datasets methods base
loaded via a namespace (and not attached):
[1] compiler_3.4.2 backports_1.1.2 magrittr_1.5 rprojroot_1.3-2
[5] tools_3.4.2 htmltools_0.3.6 yaml_2.1.16 Rcpp_0.12.15
[9] stringi_1.1.6 rmarkdown_1.8.5 knitr_1.18 git2r_0.21.0
[13] stringr_1.2.0 digest_0.6.14 evaluate_0.10.1This R Markdown site was created with workflowr