Check read counts in binned genome
Briana Mittleman
2017-11-30
Last updated: 2017-12-04
Code version: a63bb5f
Bash script
Split genome into 200bp windows and run the coverage command:
/project2/gilad/briana/Net-seq/genome_bed/hg19_200bp_window.bed
/project2/gilad/briana/Net-seq/ref_genes/windows_200
make window_200_cov.sh
#!/bin/bash

#SBATCH --job-name=window_200_cov
#SBATCH --time=8:00:00
#SBATCH --partition=broadwl
#SBATCH --mem=50G
#SBATCH --tasks-per-node=4
#SBATCH --mail-type=END


bedtools coverage -counts -a /project2/gilad/briana/Net-seq/genome_bed/hg19_200bp_window.bed -b /project2/gilad/briana/Net-seq/Net-seq1/data/bed_sort/net1_18486_dep_chr_sort.bed  > /project2/gilad/briana/Net-seq/ref_genes/windows_200/window_200_cov_18486.txt


bedtools coverage -counts -a /project2/gilad/briana/Net-seq/genome_bed/hg19_200bp_window.bed -b /project2/gilad/briana/Net-seq/Net-seq1/data/bed_sort/net1_18508_dep_chr_sort.bed  > /project2/gilad/briana/Net-seq/ref_genes/windows_200/window_200_cov_18508_dep.txt

bedtools coverage -counts -a /project2/gilad/briana/Net-seq/genome_bed/hg19_200bp_window.bed -b /project2/gilad/briana/Net-seq/Net-seq1/data/bed_sort/net1_18508_nondep_chr_sort.bed   > /project2/gilad/briana/Net-seq/ref_genes/windows_200/window_200_cov_18508_nondep.txt

bedtools coverage -counts -a /project2/gilad/briana/Net-seq/genome_bed/hg19_200bp_window.bed -b /project2/gilad/briana/Net-seq/Net-seq1/data/bed_sort/net1_19238_dep_chr_sort.bed   > /project2/gilad/briana/Net-seq/ref_genes/windows_200/window_200_cov_19238.txt

bedtools coverage -counts -a /project2/gilad/briana/Net-seq/genome_bed/hg19_200bp_window.bed  -b /project2/gilad/briana/Net-seq/data/bed_sort/mayer_SRR1575922_chr_sort.bed   > /project2/gilad/briana/Net-seq/ref_genes/windows_200/window_200_cov_mayer.txt


#bedtools coverage -counts -a /project2/gilad/briana/Net-seq/genome_bed/hg19_200bp_window.bed   -b /project2/gilad/briana/Net-seq/Net-seq1/data/bed/merged_Net1.chr.bed   > /project2/gilad/briana/Net-seq/ref_genes/windows_200/window_200_cov_merged.txt
#step memory exceeded!
Import data
window_200_18486=read.csv("../data/windows_200/window_200_cov_18486.txt", header=FALSE, sep="\t")
window_200_18508_dep=read.csv("../data/windows_200/window_200_cov_18508_dep.txt", header=FALSE, sep="\t")
window_200_18508_nondep=read.csv("../data/windows_200/window_200_cov_18508_nondep.txt", header=FALSE, sep="\t")
window_200_19238=read.csv("../data/windows_200/window_200_cov_19238.txt", header=FALSE, sep="\t")
window_200_mayer= read.csv("../data/windows_200/window_200_cov_mayer.txt", header=FALSE, sep="\t")
Add col labels to each file:
colnames(window_200_18486) = c("chr", "start", "end", "count")
colnames(window_200_18508_dep) = c("chr", "start", "end", "count")
colnames(window_200_18508_nondep) = c("chr", "start", "end", "count")
colnames(window_200_19238) = c("chr", "start", "end", "count")
colnames(window_200_mayer) = c("chr", "start", "end", "count")
Plot data
Data I want to look at:
- summary per library
summary(window_200_18486$count) Min. 1st Qu. Median Mean 3rd Qu. Max.
0 0 0 1 0 4076520 summary(window_200_18508_dep$count) Min. 1st Qu. Median Mean 3rd Qu. Max.
0 0 0 21 0 27069584 summary(window_200_18508_nondep$count) Min. 1st Qu. Median Mean 3rd Qu. Max.
0 0 0 23 0 30571781 summary(window_200_19238$count) Min. 1st Qu. Median Mean 3rd Qu. Max.
0 0 0 4 0 13033253 summary(window_200_mayer$count) Min. 1st Qu. Median Mean 3rd Qu. Max.
0.0 0.0 0.0 113.3 0.0 701170.0 Use a plot to see the distribution:
- summaries not including zero
Make dataframe excluding the zeros:
window_200_18486_non0= window_200_18486[window_200_18486$count!=0,]
window_200_18508_dep_non0= window_200_18508_dep[window_200_18508_dep$count!=0,]
window_200_18508_nondep_non0= window_200_18508_nondep[window_200_18508_nondep$count!=0,]
window_200_19238_non0= window_200_19238[window_200_19238$count!=0,]
window_200_mayer_non0= window_200_mayer[window_200_mayer$count!=0,]
summarise
summary(window_200_18486_non0$count) Min. 1st Qu. Median Mean 3rd Qu. Max.
1 1 1 45 3 4076520 summary(window_200_18508_dep_non0$count) Min. 1st Qu. Median Mean 3rd Qu. Max.
1 1 1 624 3 27069584 summary(window_200_18508_nondep_non0$count) Min. 1st Qu. Median Mean 3rd Qu. Max.
1 1 1 633 3 30571781 summary(window_200_19238_non0$count) Min. 1st Qu. Median Mean 3rd Qu. Max.
1 1 1 149 3 13033253 summary(window_200_mayer_non0$count) Min. 1st Qu. Median Mean 3rd Qu. Max.
1 1 1 2200 2 701170 plot(sort(log(window_200_19238_non0$count), decreasing=TRUE))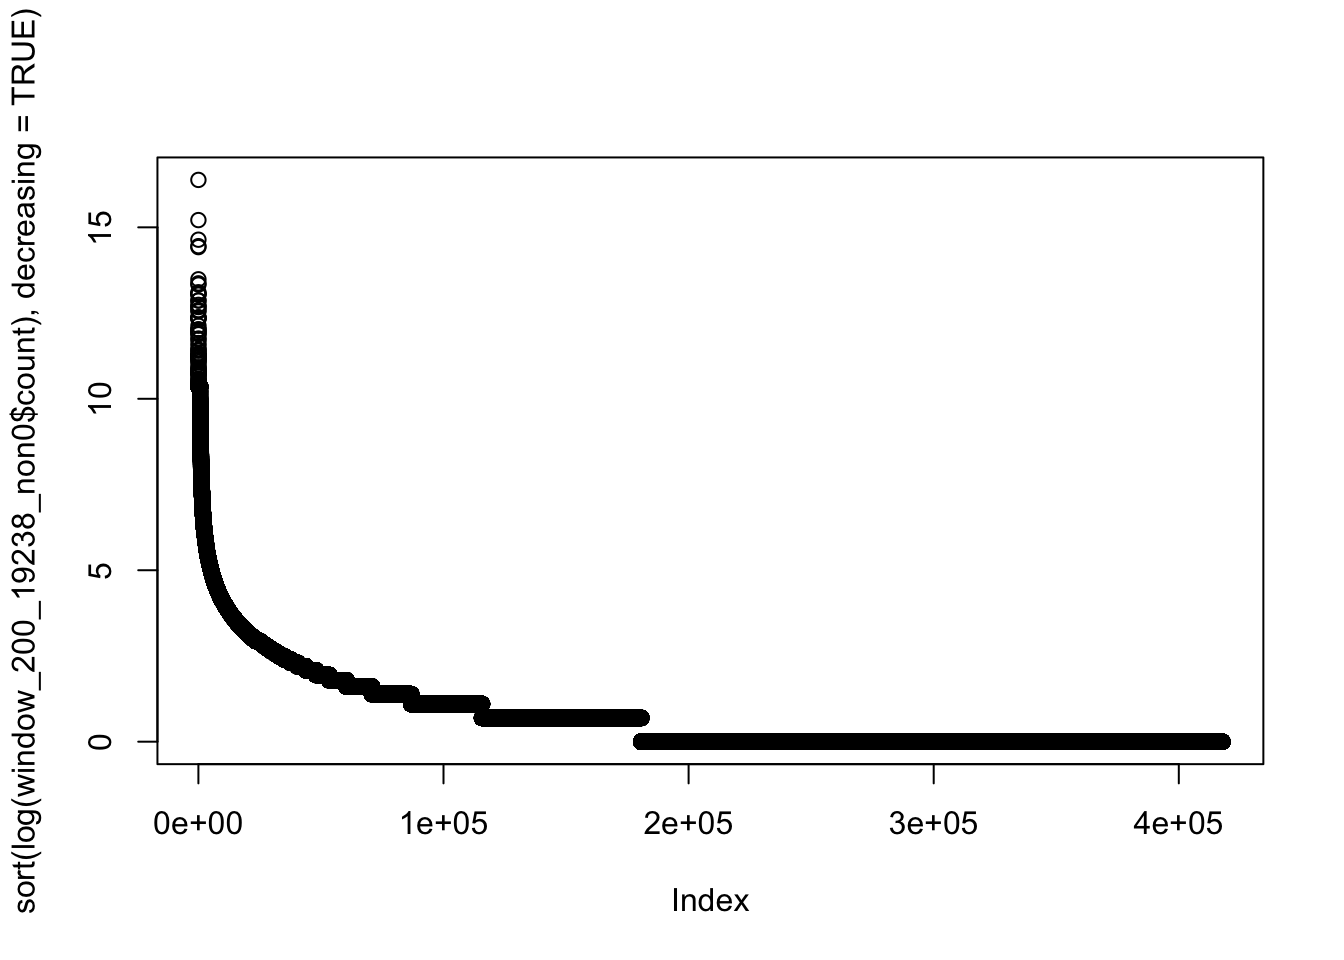
- number of entries that are non zero
x= nrow(window_200_18486)
barplot(c(nrow(window_200_18486_non0)/x,nrow(window_200_18508_dep_non0)/x,nrow(window_200_18508_nondep_non0)/x, nrow(window_200_19238_non0)/x), main="Proportion of detected bins", names=c("18486", "18508 \n dep", "18508 \n nondep", "19238"))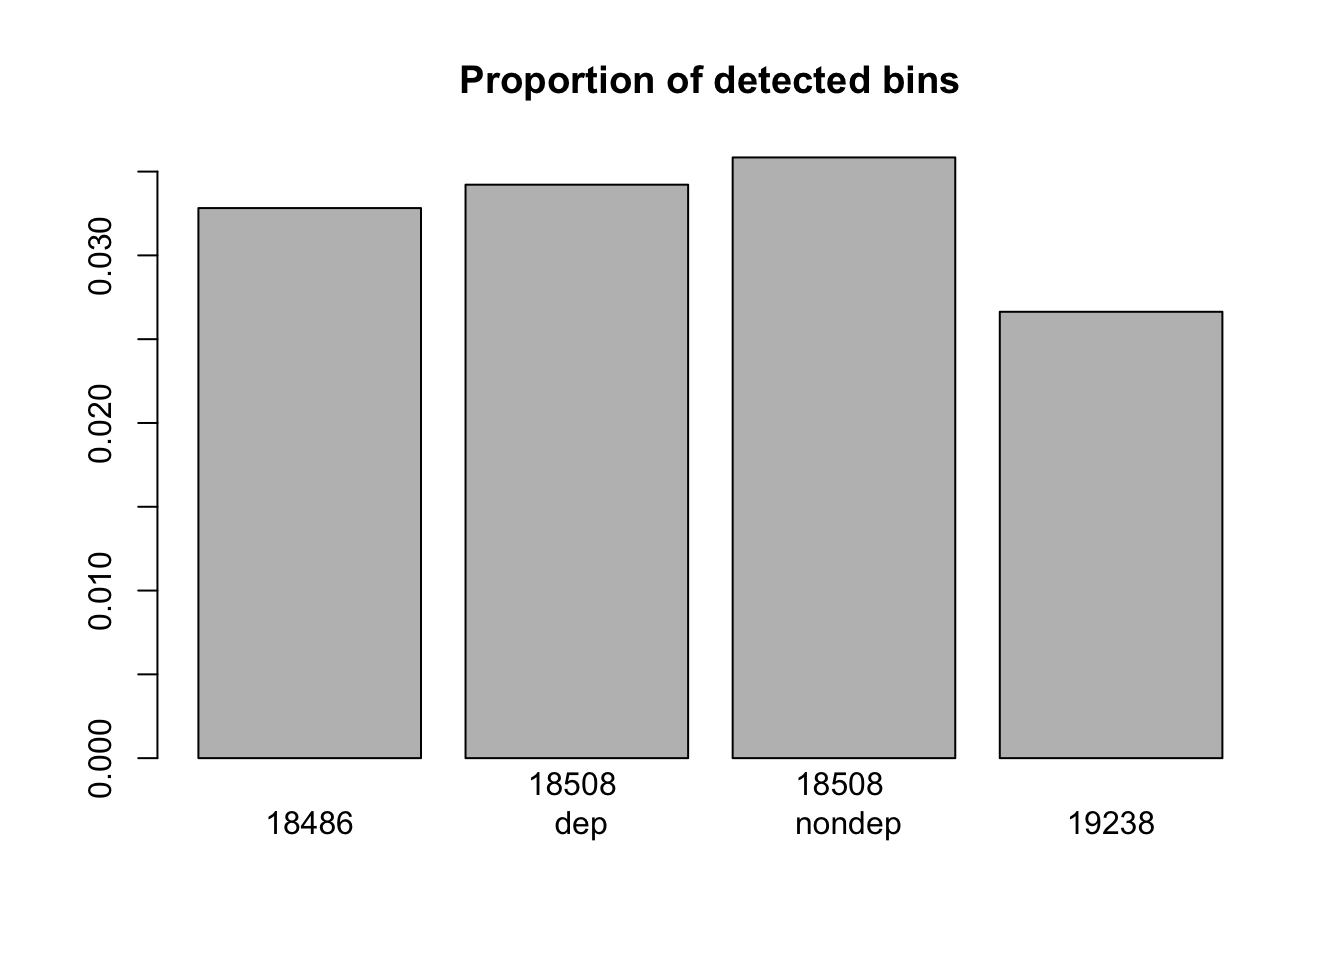
nrow(window_200_mayer_non0)/x[1] 0.05149546Integrate sets:
window_non_0_all= nrow(window_200_18486[window_200_18486$count!=0 | window_200_18508_dep$count!=0 | window_200_18486$count!=0,] )
prop_window_non0= window_non_0_all/x
prop_window_non0
[1] 0.05416194window_non_0_2= nrow(window_200_18486[window_200_18486$count!=0 | window_200_18508_dep$count!=0,] )
prop_window_non0_2= window_non_0_2/x
prop_window_non0_2[1] 0.05416194window_non_0_2b= nrow(window_200_18486[window_200_18486$count!=0 |window_200_18486$count!=0,] )
prop_window_non0_2b= window_non_0_2b/x
prop_window_non0_2b[1] 0.03282309Explore bin overlap
I will combine the depleted samples counts in one data frame:
window_200_3lib= cbind(window_200_18486, window_200_18508_dep$count, window_200_19238$count)
colnames(window_200_3lib)= c("chr", "start", "end", "18486", "18508", "19238")
Make a vector with how many of the libraries have coverage for each bin
sum_vec= apply(window_200_3lib[,4:6],1,function(x)sum(x>=1))
window_200_3lib= cbind(window_200_3lib, sum_vec)
Explore the results:
bin_0= sum(sum_vec==0)
bin_1= sum(sum_vec==1)
bin_2= sum(sum_vec==2)
bin_3= sum(sum_vec==3)

prop0=bin_0/x
prop1=bin_1/x
prop2=bin_2/x
prop3=bin_3/x

barplot_prop=(barplot(c(prop1, prop2, prop3),names = c("1 bin", "2 bins", "3 bins"), main="Proportion of bins with coverage in 3 libaries", ylab="proportion", xlab="library" ))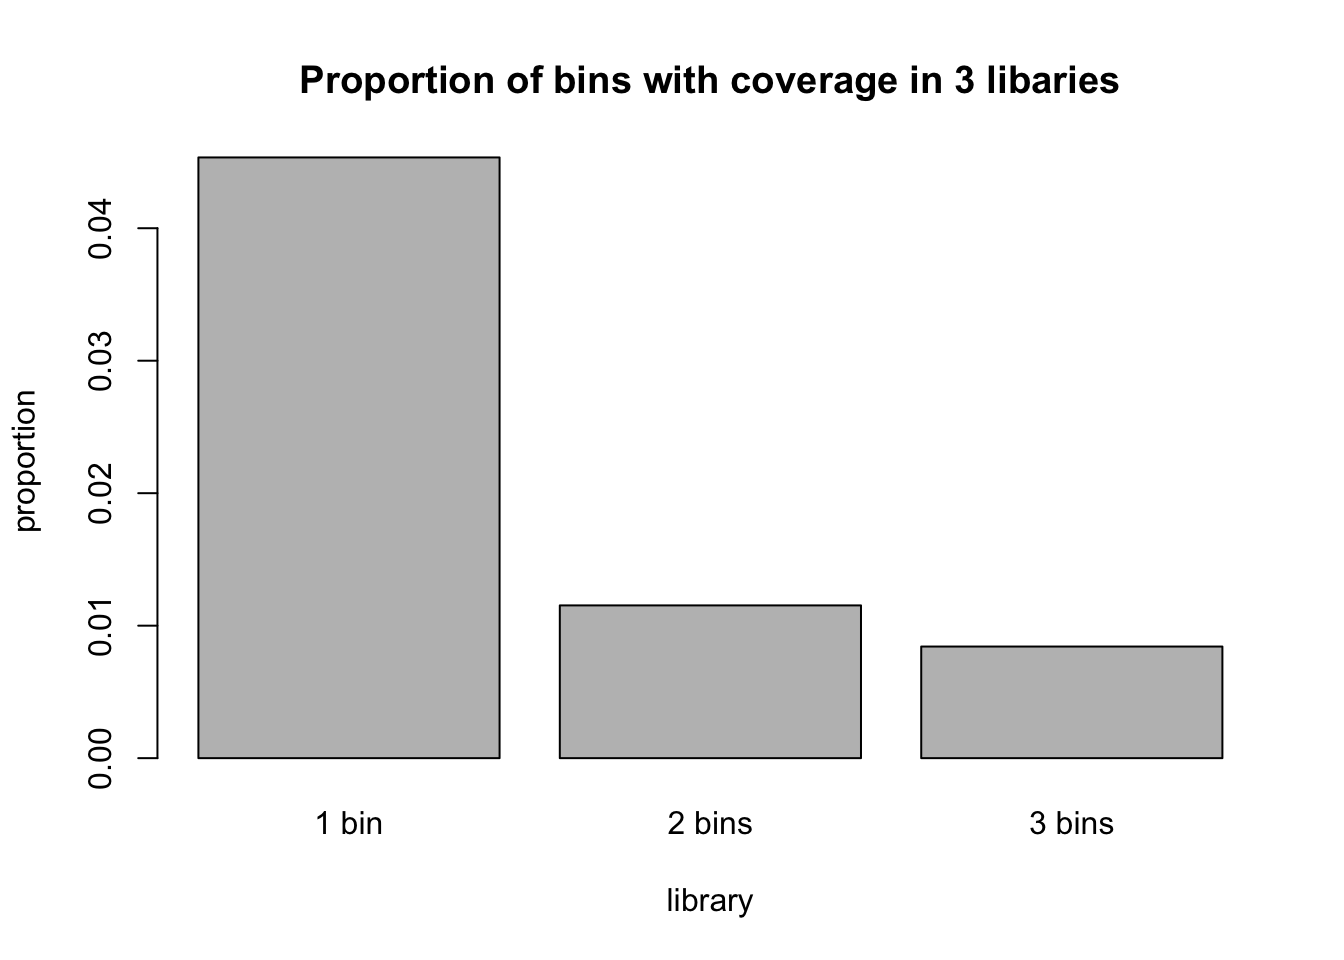
prop_vec=c(prop0,prop1, prop2, prop3)
names_vec= c("0 bins","1 bin", "2 bins", "3 bins")

prop_table=rbind(names_vec,prop_vec)
prop_table
[,1] [,2] [,3]
names_vec "0 bins" "1 bin" "2 bins"
prop_vec "0.934702546224945" "0.0453430987382321" "0.0115298190107529"
[,4]
names_vec "3 bins"
prop_vec "0.00842453602607038"Perform on mayer data or multiple lanes
#!/bin/bash

#SBATCH --job-name=window_200_cov_mayer
#SBATCH --time=8:00:00
#SBATCH --partition=broadwl
#SBATCH --mem=50G
#SBATCH --tasks-per-node=4
#SBATCH --mail-type=END

module load bedtools

bedtools coverage -counts -a /project2/gilad/briana/Net-seq/genome_bed/hg19_200bp_window.bed -b /project2/gilad/briana/mayer.data/mayer_hek/data/bed/mayer_hek-sort.chr.bed > /project2/gilad/briana/mayer.data/mayer_hek/data/window_200_cov_mayer_hek.txt
Not enough memory
Bin the gene file:
bedtools makewindows -b ref_seq_gene_hg19 -w 200 > ref_seq_gene_hg16_bins.bedMake a bash script to get coverage in these bins. This is in /project2/gilad/briana/Net-seq/ref_genes/gene_windows_200/gene_window_200.sh
#!/bin/bash

#SBATCH --job-name=gene_window_200_cov
#SBATCH --time=8:00:00
#SBATCH --partition=broadwl
#SBATCH --mem=30G
#SBATCH --tasks-per-node=4
#SBATCH --mail-type=END


bedtools coverage -counts -a /project2/gilad/briana/Net-seq/ref_genes/ref_seq_gene_hg16_bins.bed -b /project2/gilad/briana/Net-seq/Net-seq1/data/bed_sort/net1_18486_dep_chr_sort.bed  > /project2/gilad/briana/Net-seq/ref_genes/gene_windows_200/gene_window_cov_18486.txt

bedtools coverage -counts -a /project2/gilad/briana/Net-seq/ref_genes/ref_seq_gene_hg16_bins.bed -b /project2/gilad/briana/Net-seq/Net-seq1/data/bed_sort/net1_18508_dep_chr_sort.bed  > /project2/gilad/briana/Net-seq/ref_genes/gene_windows_200/gene_window_cov_18508_dep.txt

bedtools coverage -counts -a /project2/gilad/briana/Net-seq/ref_genes/ref_seq_gene_hg16_bins.bed -b /project2/gilad/briana/Net-seq/Net-seq1/data/bed_sort/net1_19238_dep_chr_sort.bed   > /project2/gilad/briana/Net-seq/ref_genes/gene_windows_200/gene_window_cov_19238.txt

bedtools coverage -counts -a /project2/gilad/briana/Net-seq/ref_genes/ref_seq_gene_hg16_bins.bed  -b /project2/gilad/briana/Net-seq/data/bed_sort/mayer_SRR1575922_chr_sort.bed   > /project2/gilad/briana/Net-seq/ref_genes/gene_windows_200/gene_window_cov_mayer.txt
This file has 22071951 bins. This is not a good representation because some locations in the genome are in multiple genes. I need to think about this more. Maybe I can only keep unique windows.
``ref_seq_gene_hg16_bins.bed | uniq -u | wc -l```
This leaves 5023160 lines. Still not right because the genes start at different positions but overlap then the lines wouldnt be unique.
Use bedtools intersect -a genome -b genes -wa:
a is the genome windows
b is the gene file
This should keep the windows of a that intersect b. This means I will only have windows that contain a gene.
bedtools intersect -a /project2/gilad/briana/Net-seq/genome_bed/hg19_windows_sort_2.bed -b /project2/gilad/briana/Net-seq/ref_genes/ref_seq_gene_hg19_small.bed -wa > /project2/gilad/briana/Net-seq/genome_bed/hg19_windows_with_gene.bed
ERROR:
ERROR: Received illegal bin number 262143 from getBin call.
ERROR: Unable to add record to tree
Potential problem: hg19 file starts with chrom 10 and the gene file starts with chr1. Maybe try sorting the gene file the way I sorted the hg19 file.
Get the chr# list from the genes file using:
cut -f 1 | uniq /project2/gilad/briana/Net-seq/ref_genes/ref_seq_gene_hg19_small.bed > names.txt
#!/bin/bash


#SBATCH --job-name=sortgene
#SBATCH --time=8:00:00
#SBATCH --partition=broadwl
#SBATCH --mem=20G
#SBATCH --tasks-per-node=4
#SBATCH --mail-type=END

module load bedtools

cd /project2/gilad/briana/Net-seq/genome_bed

bedtools sort -faidx names_uniq.txt  -i  hg19_200bp_window.bed -o hg19_windows_sort.bed
ERROR: Chromosome “chr1” undefined in names_uniq.txt
Try:
sort -k 1,1 -k2,2n hg19_200bp_window.bed > hg19_windows_sort_2.bed
Cut the gene file to only have the first 3 columns with:
cut -f 1,2,3 ref_seq_gene_hg19 > ref_seq_gene_hg19_3col.bed
Run intersect:
bedtools intersect -a /project2/gilad/briana/Net-seq/genome_bed/hg19_windows_sort_2.bed -b /project2/gilad/briana/Net-seq/ref_genes/ref_seq_gene_hg19_3col.bed -wa > /project2/gilad/briana/Net-seq/genome_bed/hg19_windows_with_gene.bed This worked but you still have multiples. I will take the unique lines of this with:
cat hg19_windows_with_gene.bed | uniq > hg19_windows_with_gene_uniq.bed
Now I can run the coverage counts on this file to see the how many of the genome bins that had at least one gene have coverage.
Call this script. uniq_gene_window.sh in /project2/gilad/briana/Net-seq/ref_genes/uniq_gene_windows_200
#!/bin/bash

#SBATCH --job-name=uniq_gene_window
#SBATCH --time=8:00:00
#SBATCH --partition=broadwl
#SBATCH --mem=30G
#SBATCH --tasks-per-node=4
#SBATCH --mail-type=END


bedtools coverage -counts -a /project2/gilad/briana/Net-seq/genome_bed/hg19_windows_with_gene_uniq.bed -b /project2/gilad/briana/Net-seq/Net-seq1/data/bed_sort/net1_18486_dep_chr_sort.bed  > /project2/gilad/briana/Net-seq/ref_genes/uniq_gene_windows_200/uniq_gene_window_cov_18486.txt

bedtools coverage -counts -a /project2/gilad/briana/Net-seq/genome_bed/hg19_windows_with_gene_uniq.bed -b /project2/gilad/briana/Net-seq/Net-seq1/data/bed_sort/net1_18508_dep_chr_sort.bed  > /project2/gilad/briana/Net-seq/ref_genes/uniq_gene_windows_200/uniq_gene_window_cov_18508_dep.txt

bedtools coverage -counts -a /project2/gilad/briana/Net-seq/genome_bed/hg19_windows_with_gene_uniq.bed -b /project2/gilad/briana/Net-seq/Net-seq1/data/bed_sort/net1_19238_dep_chr_sort.bed   > /project2/gilad/briana/Net-seq/ref_genes/uniq_gene_windows_200/uniq_gene_window_cov_19238.txt

bedtools coverage -counts -a /project2/gilad/briana/Net-seq/genome_bed/hg19_windows_with_gene_uniq.bed -b /project2/gilad/briana/Net-seq/data/bed_sort/mayer_SRR1575922_chr_sort.bed   > /project2/gilad/briana/Net-seq/ref_genes/uniq_gene_windows_200/uniq_gene_window_cov_mayer.txt
Load uniq gene files:
These are the uniq bind in the genome 200bp window file that include a gene.
uniq_gene_window_18486=read.csv("../data/uniq_genes/uniq_gene_window_cov_18486.txt", header=FALSE, sep="\t")
uniq_gene_window_18508=read.csv("../data/uniq_genes/uniq_gene_window_cov_18508_dep.txt", header=FALSE, sep="\t")
uniq_gene_window_19238=read.csv("../data/uniq_genes/uniq_gene_window_cov_19238.txt", header=FALSE, sep="\t")
uniq_gene_window_mayer=read.csv("../data/uniq_genes/uniq_gene_window_cov_mayer.txt", header=FALSE, sep="\t")
colnames(uniq_gene_window_mayer)= c("chr", "start", "end", "count")
colnames(uniq_gene_window_19238)= c("chr", "start", "end", "count")
colnames(uniq_gene_window_18486)= c("chr", "start", "end", "count")
colnames(uniq_gene_window_18508)= c("chr", "start", "end", "count")Look at the number of windows with coverage:
uniq_gene_window_18486_no0= uniq_gene_window_18486[uniq_gene_window_18486$count!=0,]
uniq_gene_window_18508_no0= uniq_gene_window_18508[uniq_gene_window_18508$count!=0,]
uniq_gene_window_19238_no0= uniq_gene_window_19238[uniq_gene_window_19238$count!=0,]
uniq_gene_window_mayer_no0= uniq_gene_window_mayer[uniq_gene_window_mayer$count!=0,]
Bar plot for coverage:
gene_windows= nrow(uniq_gene_window_mayer)

barplot(c(nrow(uniq_gene_window_18486_no0)/gene_windows, nrow(uniq_gene_window_18508_no0)/gene_windows, nrow(uniq_gene_window_19238_no0)/gene_windows, nrow(uniq_gene_window_mayer_no0)/gene_windows), main="Coverage for windows with genes", names= c("18486", "18508", "19238", "Mayer"), xlab="Library")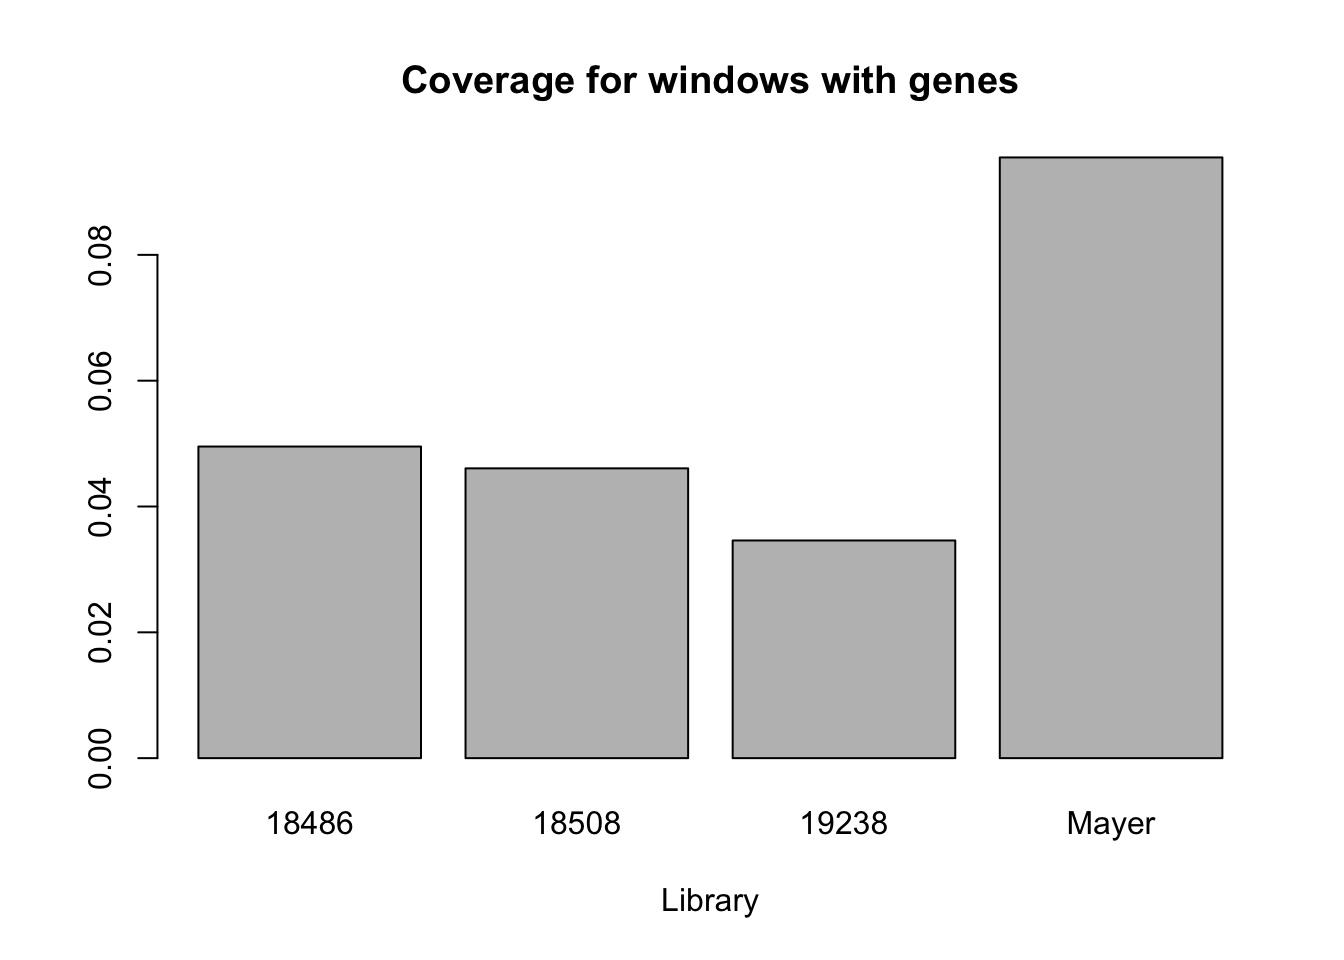
mayer_gene_coverage=nrow(uniq_gene_window_mayer_no0)/gene_windowsMayer has more coverage for this parameter. Their library has 0.0954862.
Ours:
18486: 0.0495328
18508: 0.0460654
19238: 0.0346009
Session information
sessionInfo()R version 3.4.2 (2017-09-28)
Platform: x86_64-apple-darwin15.6.0 (64-bit)
Running under: macOS Sierra 10.12.6
Matrix products: default
BLAS: /Library/Frameworks/R.framework/Versions/3.4/Resources/lib/libRblas.0.dylib
LAPACK: /Library/Frameworks/R.framework/Versions/3.4/Resources/lib/libRlapack.dylib
locale:
[1] en_US.UTF-8/en_US.UTF-8/en_US.UTF-8/C/en_US.UTF-8/en_US.UTF-8
attached base packages:
[1] stats graphics grDevices utils datasets methods base
loaded via a namespace (and not attached):
[1] compiler_3.4.2 backports_1.1.1 magrittr_1.5 rprojroot_1.2
[5] tools_3.4.2 htmltools_0.3.6 yaml_2.1.14 Rcpp_0.12.13
[9] stringi_1.1.5 rmarkdown_1.6 knitr_1.17 git2r_0.19.0
[13] stringr_1.2.0 digest_0.6.12 evaluate_0.10.1This R Markdown site was created with workflowr