


Docs • Gallery • Changelog • Migration

 ```javascript
import React from 'react';
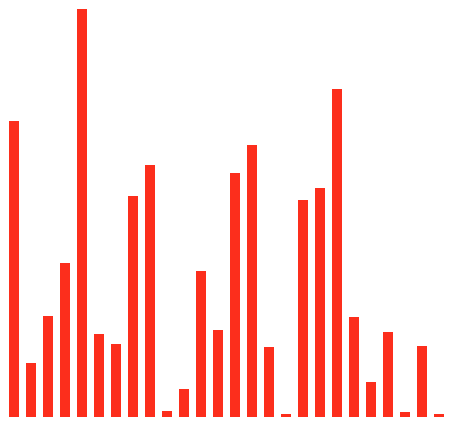
import { letterFrequency } from '@visx/mock-data';
import { Group } from '@visx/group';
import { Bar } from '@visx/shape';
import { scaleLinear, scaleBand } from '@visx/scale';
// We'll use some mock data from `@visx/mock-data` for this.
const data = letterFrequency;
// Define the graph dimensions and margins
const width = 500;
const height = 500;
const margin = { top: 20, bottom: 20, left: 20, right: 20 };
// Then we'll create some bounds
const xMax = width - margin.left - margin.right;
const yMax = height - margin.top - margin.bottom;
// Accessors
const getLetter = (d) => d.letter;
const getFrequency = (d) => d.frequency * 100;
// And then scale the graph by our data
const xScale = scaleBand({
range: [0, xMax],
round: true,
domain: data.map(getLetter),
padding: 0.4,
});
const yScale = scaleLinear({
range: [yMax, 0],
round: true,
domain: [0, Math.max(...data.map(getFrequency))],
});
// Finally we'll embed it all in an SVG
function BarGraph() {
return (
);
}
```
For more examples using `visx`, check out the [gallery](https://airbnb.io/visx/gallery).
## Motivation
**Goal**
The goal is to create a library of components you can use to make both your own reusable chart
library or your slick custom one-off chart. visx is largely unopinionated and is meant to be built
upon. Keep your bundle sizes down and use only the packages you need.
**How?**
Under the hood, visx is using d3 for the calculations and math. If you're creating your own awesome
chart library on top of visx, it's easy to create a component api that hides d3 entirely. Meaning
your team could create charts as easily as using reusable react components.
**But why?**
Mixing two mental models for updating the DOM is never a good time. Copy and pasting d3 code into
`useEffect()` is just that. This collection of components lets you easily build your own reusable
visualization charts or library without having to learn d3. No more selections or
`enter()`/`exit()`/`update()`.
## FAQ
1. What does `visx` stand for?
> visx stands for visualization components.
1. Do you plan on supporting animation/transitions?
> A common criticism of visx is it doesn't have animation baked in, but this was a conscious
> choice. It's a powerful feature to not bake it in.
>
> Imagine your app already bundles `react-motion`, adding a hypothetical `@visx/animation` is
> bloat. Since visx is react, it already supports all react animation libs.
>
> Charting libraries are like style guides. Each org or app will eventually want full control
> over their own implementation.
>
> visx makes this easier for everyone. No need to reinvent the wheel each time.
>
> more info:
```javascript
import React from 'react';
import { letterFrequency } from '@visx/mock-data';
import { Group } from '@visx/group';
import { Bar } from '@visx/shape';
import { scaleLinear, scaleBand } from '@visx/scale';
// We'll use some mock data from `@visx/mock-data` for this.
const data = letterFrequency;
// Define the graph dimensions and margins
const width = 500;
const height = 500;
const margin = { top: 20, bottom: 20, left: 20, right: 20 };
// Then we'll create some bounds
const xMax = width - margin.left - margin.right;
const yMax = height - margin.top - margin.bottom;
// Accessors
const getLetter = (d) => d.letter;
const getFrequency = (d) => d.frequency * 100;
// And then scale the graph by our data
const xScale = scaleBand({
range: [0, xMax],
round: true,
domain: data.map(getLetter),
padding: 0.4,
});
const yScale = scaleLinear({
range: [yMax, 0],
round: true,
domain: [0, Math.max(...data.map(getFrequency))],
});
// Finally we'll embed it all in an SVG
function BarGraph() {
return (
);
}
```
For more examples using `visx`, check out the [gallery](https://airbnb.io/visx/gallery).
## Motivation
**Goal**
The goal is to create a library of components you can use to make both your own reusable chart
library or your slick custom one-off chart. visx is largely unopinionated and is meant to be built
upon. Keep your bundle sizes down and use only the packages you need.
**How?**
Under the hood, visx is using d3 for the calculations and math. If you're creating your own awesome
chart library on top of visx, it's easy to create a component api that hides d3 entirely. Meaning
your team could create charts as easily as using reusable react components.
**But why?**
Mixing two mental models for updating the DOM is never a good time. Copy and pasting d3 code into
`useEffect()` is just that. This collection of components lets you easily build your own reusable
visualization charts or library without having to learn d3. No more selections or
`enter()`/`exit()`/`update()`.
## FAQ
1. What does `visx` stand for?
> visx stands for visualization components.
1. Do you plan on supporting animation/transitions?
> A common criticism of visx is it doesn't have animation baked in, but this was a conscious
> choice. It's a powerful feature to not bake it in.
>
> Imagine your app already bundles `react-motion`, adding a hypothetical `@visx/animation` is
> bloat. Since visx is react, it already supports all react animation libs.
>
> Charting libraries are like style guides. Each org or app will eventually want full control
> over their own implementation.
>
> visx makes this easier for everyone. No need to reinvent the wheel each time.
>
> more info: