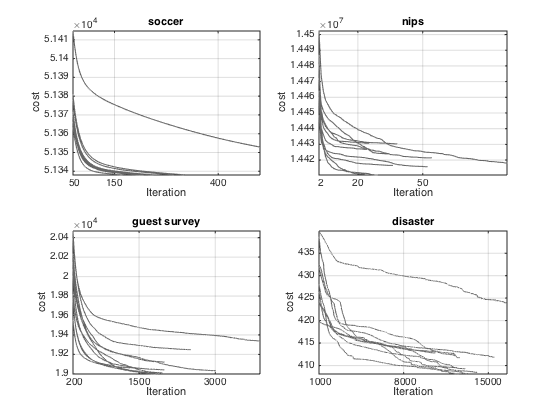
Plot convergence curves for PAA
Additional info: Figures 9 in article Probabilistic Archetypal Analysis by Seth and Eugster in Machine Learning Journal
Copyright Sohan Seth sohan.seth@hiit.fi
verbose = false;
figure('papertype', 'a4', 'paperposition', [0 0 7 3.5])
datasetList = {'soccer', 'nips', 'guest survey', 'disaster'};
for dataset = datasetList
    switch char(dataset)
        case 'soccer'
            filePath = '../../examples/archeplayers/result_soccer/result_arch_4_trial_';
            MIN = 50;
            XTICK = [MIN, 150, 400];
        case 'nips'
            filePath = '../../examples/NIPS/resultEM/result_arch_10_trial_';
            MIN = 2;
            XTICK = [MIN, 20, 50];
        case 'guest survey'
            filePath = '../../examples/GSAW97/result/result_arch_6_trial_';
            MIN = 200;
            XTICK = [MIN, 1500, 3000];
        case 'disaster'
            filePath = '../../examples/Disaster/results/resultDisaster_arch_10_trial_';
            MIN = 1000;
            XTICK = [MIN, 8000, 15000];
    end
    if 0 %exist('data_Covergence')
        objList = cell(10, 1);
        for countTrial = 1:10
            load(sprintf('%s%d.mat', filePath, countTrial));
            if strcmp(char(dataset), 'nips') | strcmp(char(dataset), 'soccer')
                obj = -obj;
            end

            obj([false; abs((obj(1:end-1) - obj(2:end))./obj(1:end-1)) < 10^-6.5]) = [];
            objList{countTrial}.x = MIN:length(obj);
            objList{countTrial}.y = obj(MIN:end);
            if verbose
                fprintf('threshold reached? %d\n', ...
                    abs((obj(end) - obj(end-1)) / obj(end - 1)) < 10^-6)
            end
        end
        save(sprintf('data_Convergence/%s', char(dataset)), 'objList')

    else
        load(sprintf('data_Convergence/%s', char(dataset)), 'objList')
    end


    subplot(2, 2, find(strcmp(dataset, datasetList))),
    hold on
    for countTrial = 1:10
        plot(objList{countTrial}.x, objList{countTrial}.y, ...
            'color', [1 1 1] * 0.4)
    end
    axis tight
    set(gca, 'fontsize', 10, 'xtick', XTICK, ...
        'xticklabel', num2str(XTICK'))%, 'yscale', 'log')
    xlabel('Iteration'), ylabel('cost');
    title(dataset)
    box on, grid on
end
% print('-dpng','-r400','../../Paper-NIPS-ICML-arXiv-KDD-ML/convergence.png')
% saveas(gca, '../../Paper-NIPS-ICML-arXiv-KDD-ML/convergence.eps', 'epsc')
close all