Diagnostic Plot for ASH
Lei Sun
2017-05-05
Last updated: 2017-12-21
Code version: 6e42447
Introduction
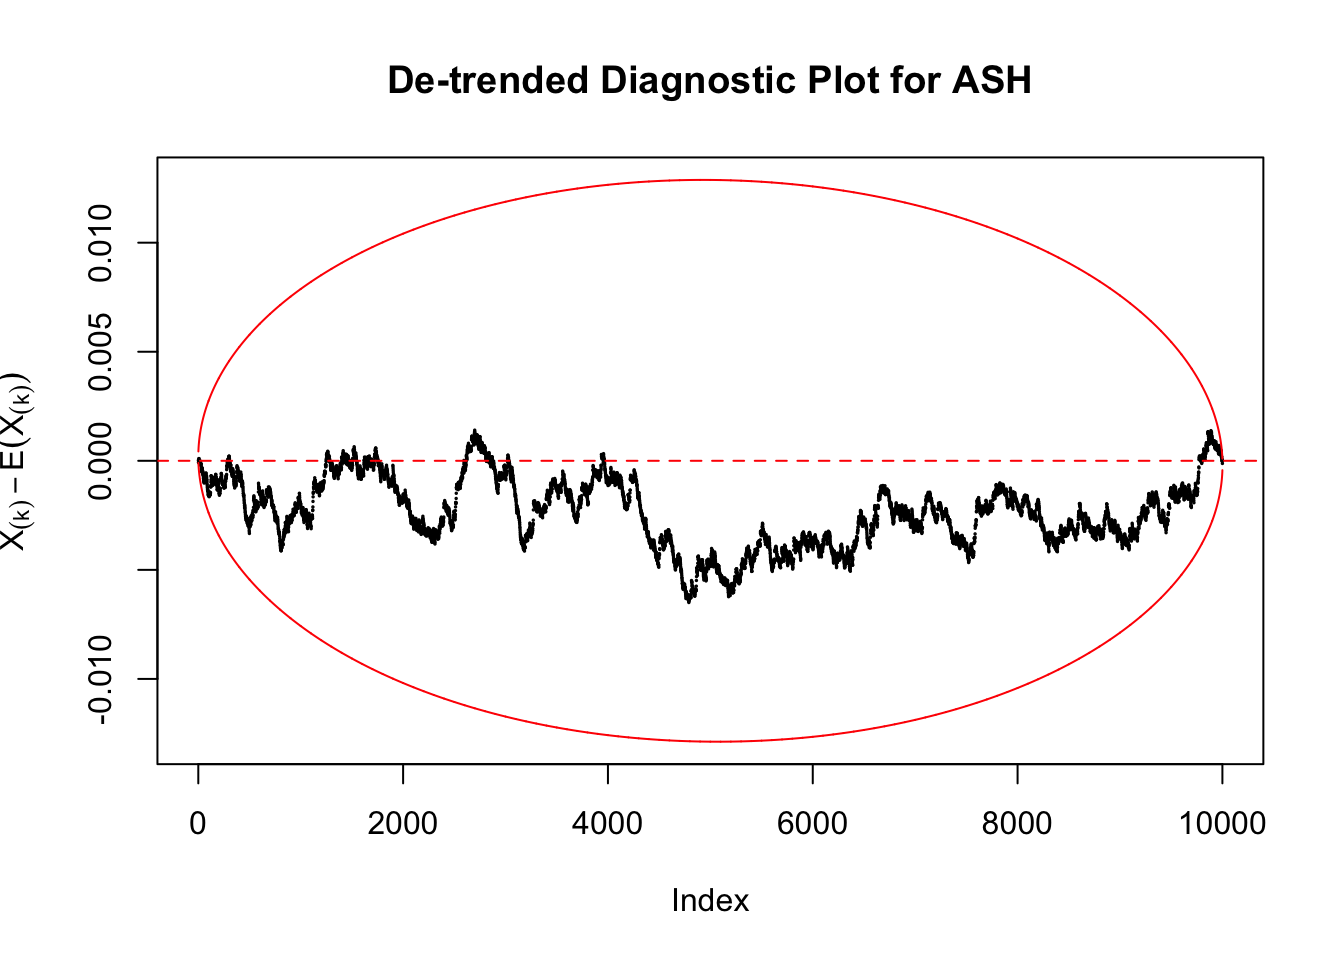
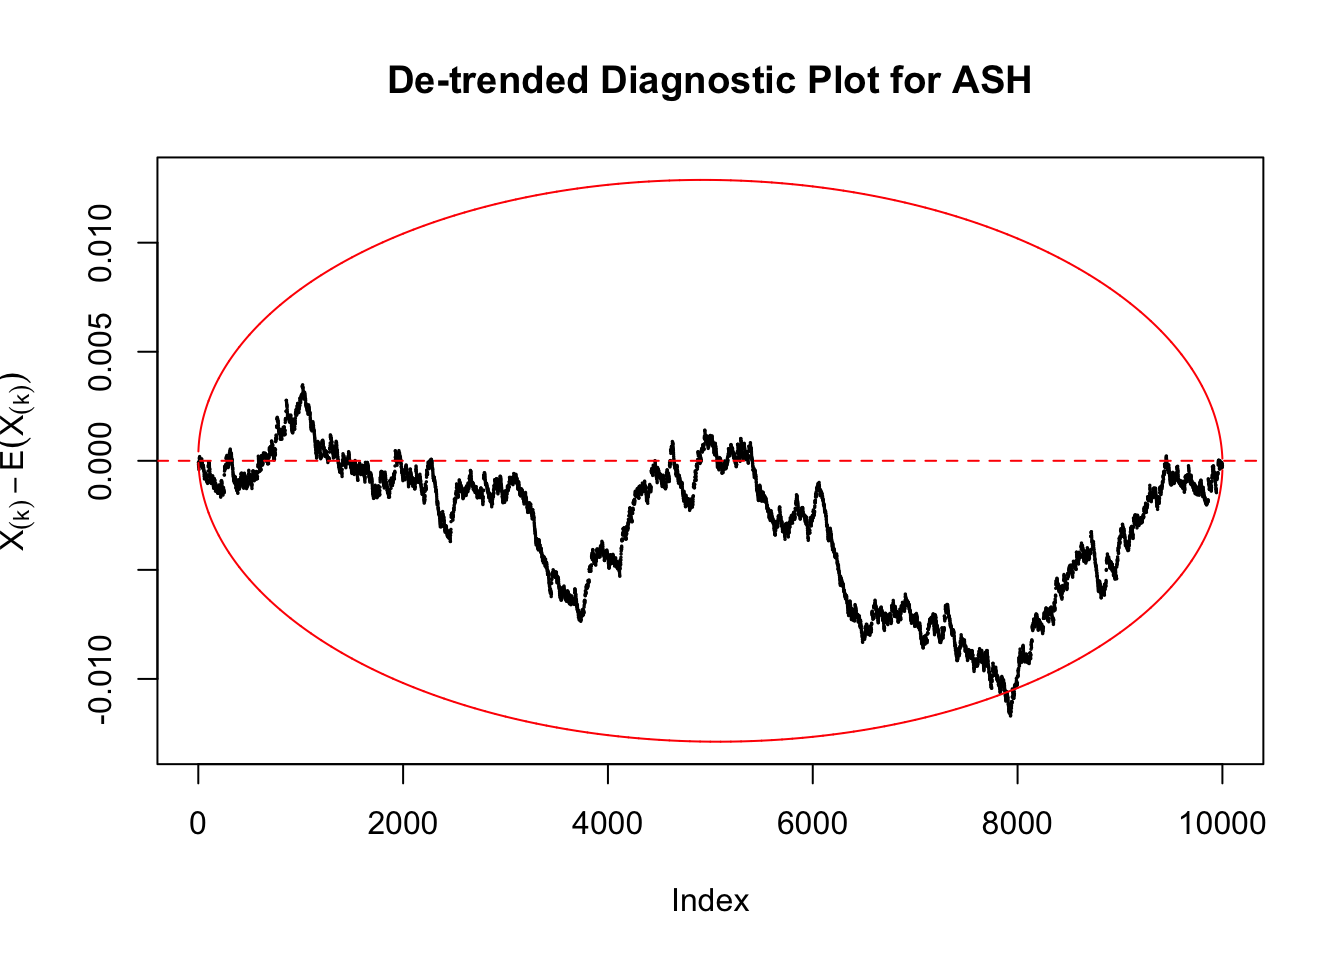
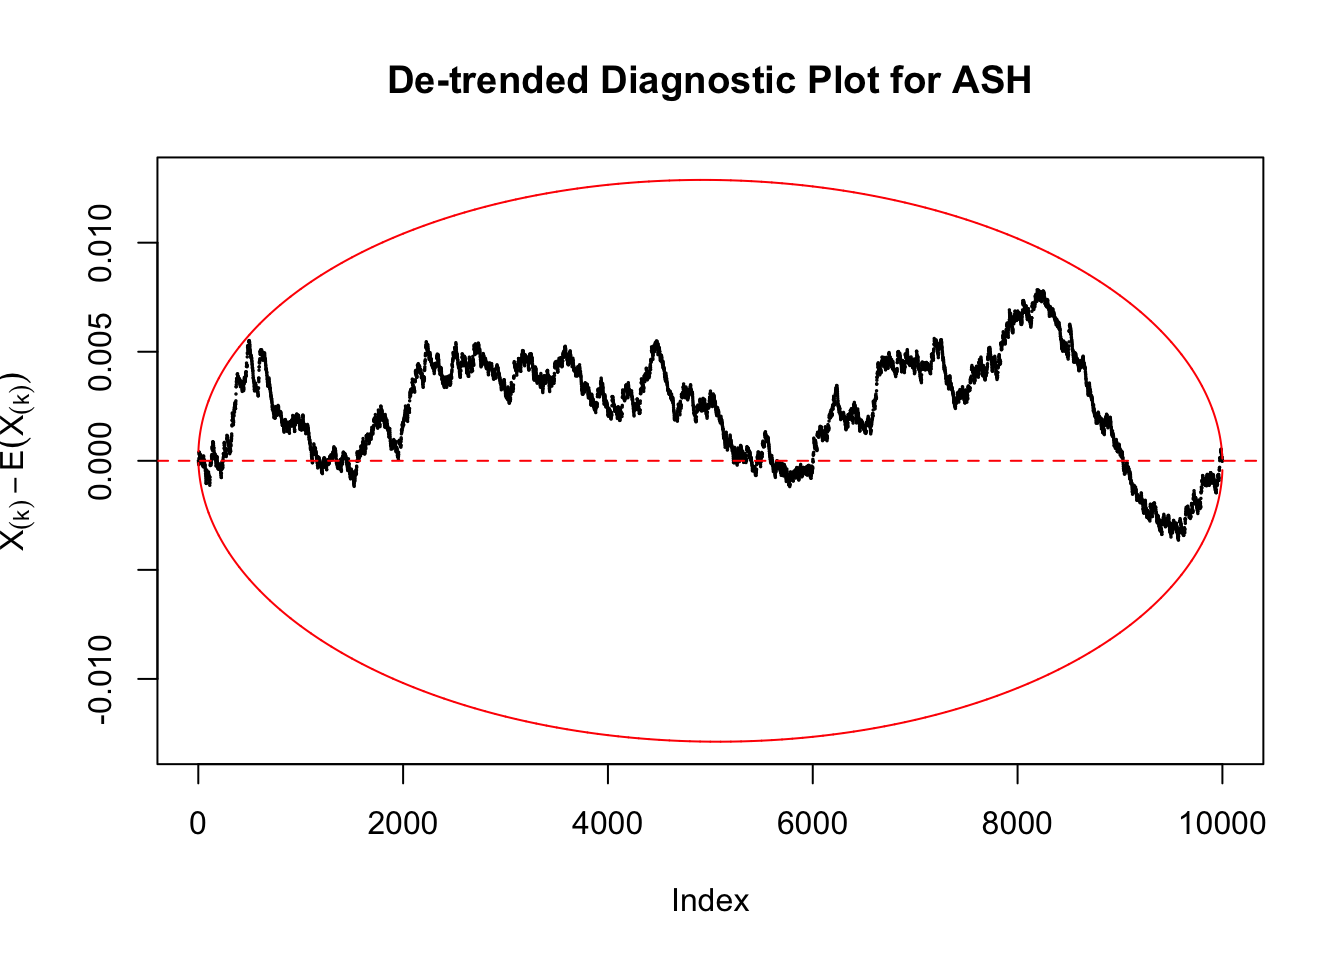
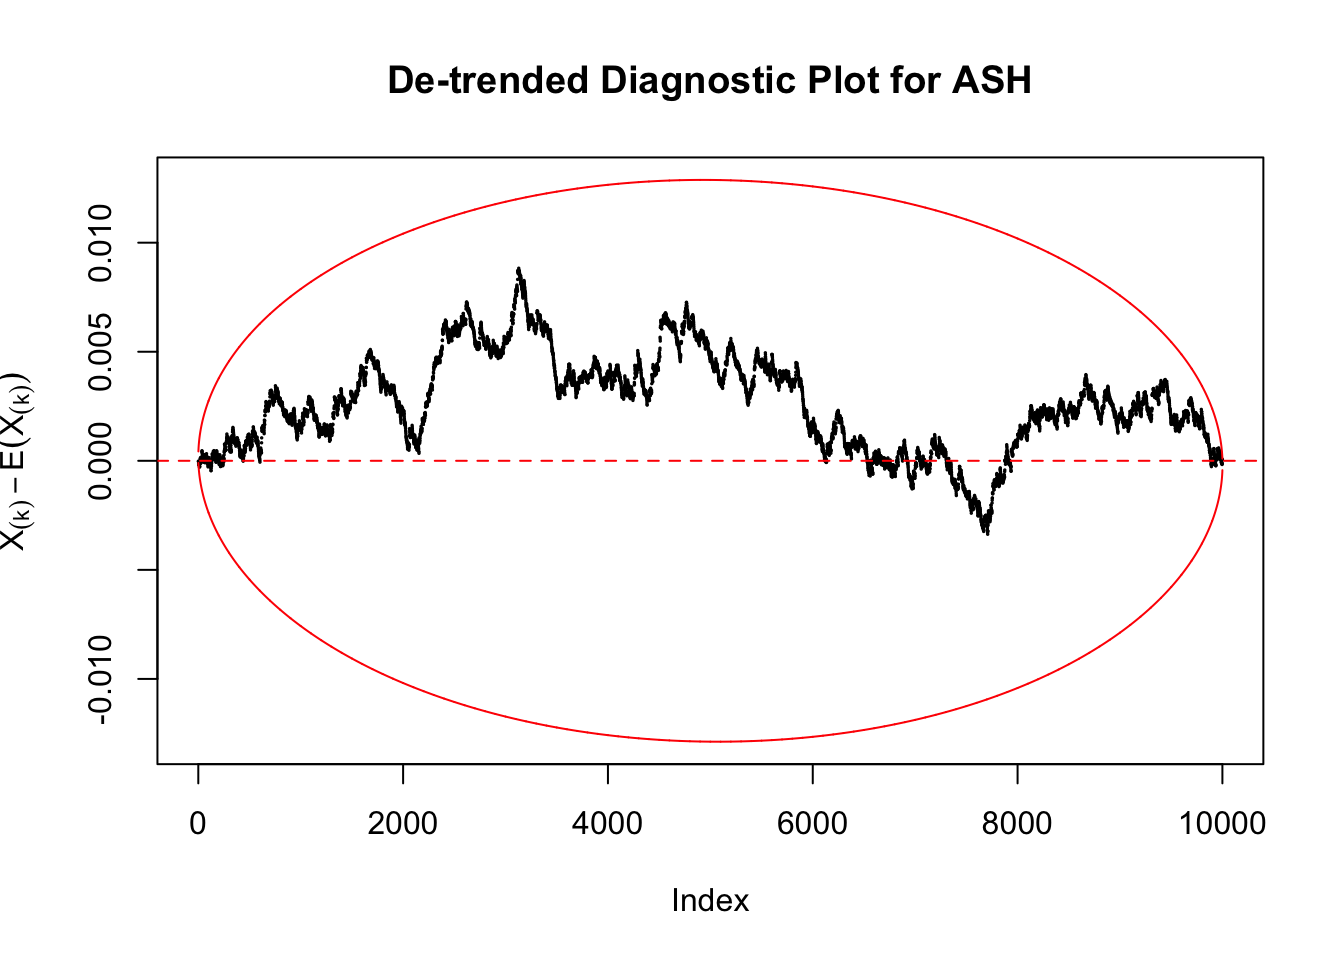
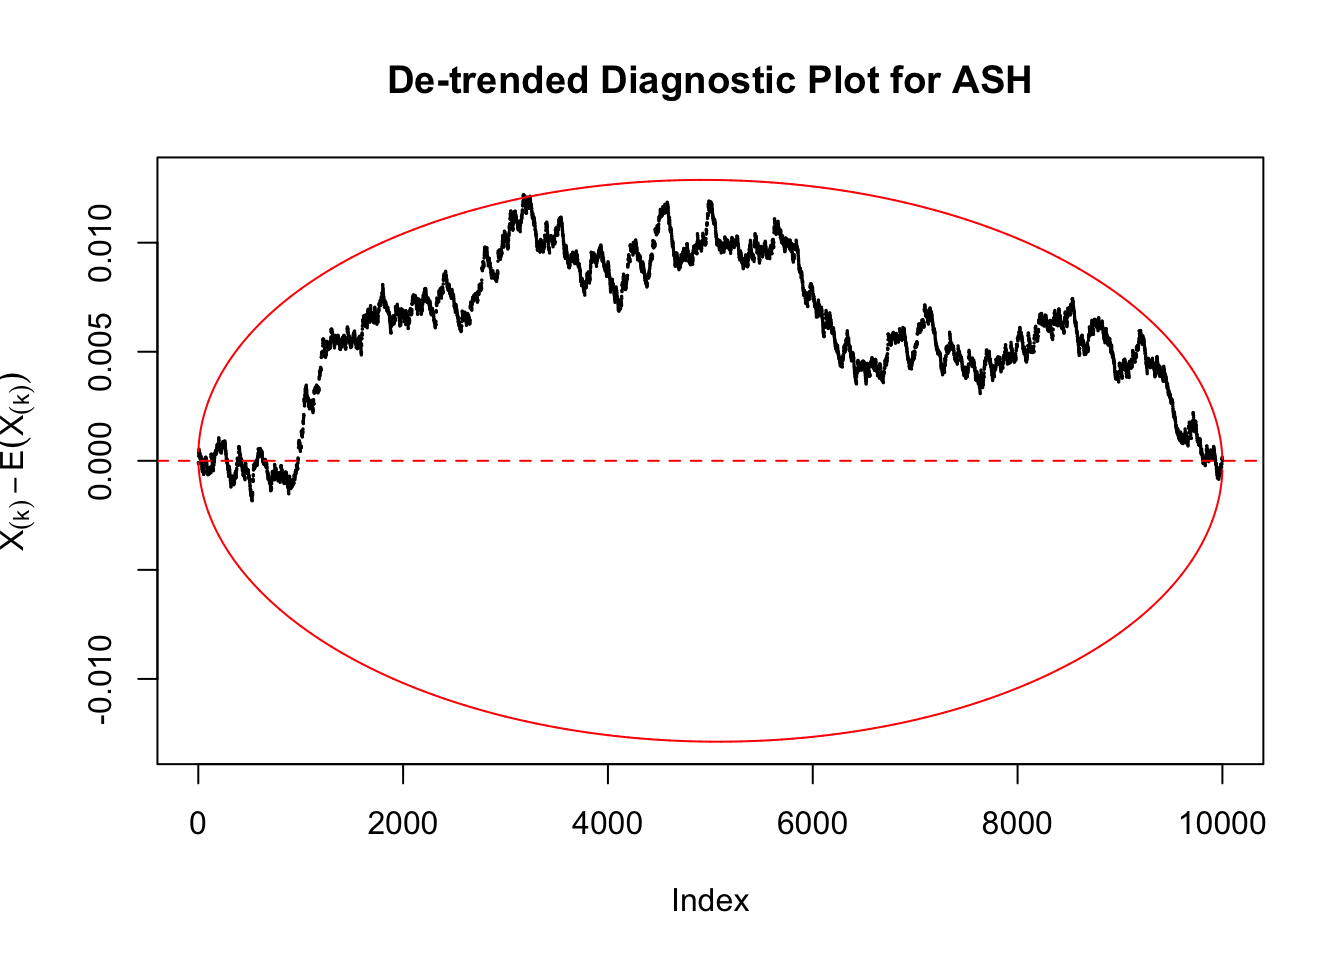
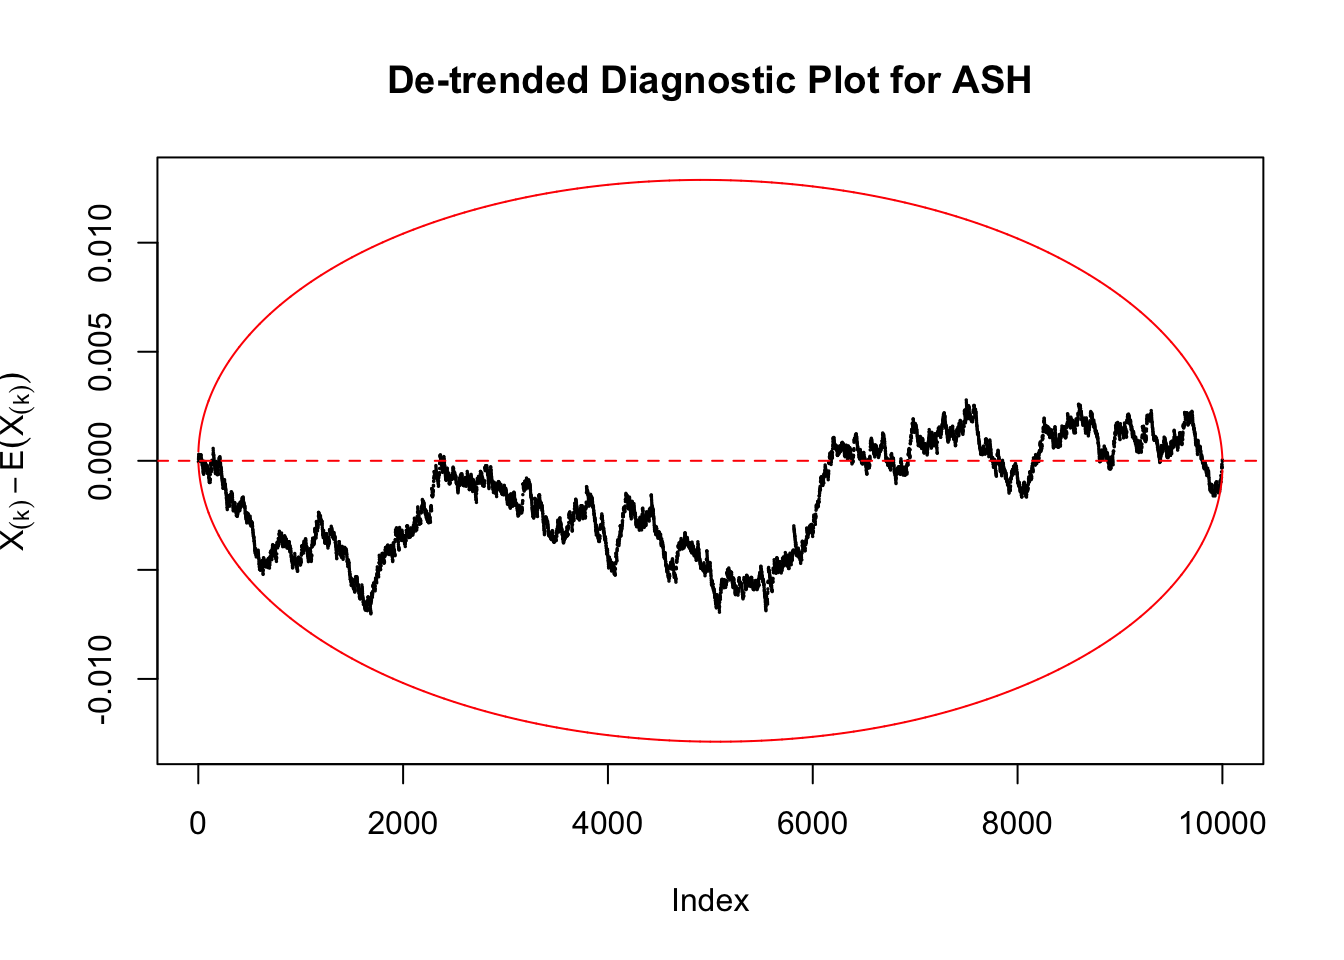
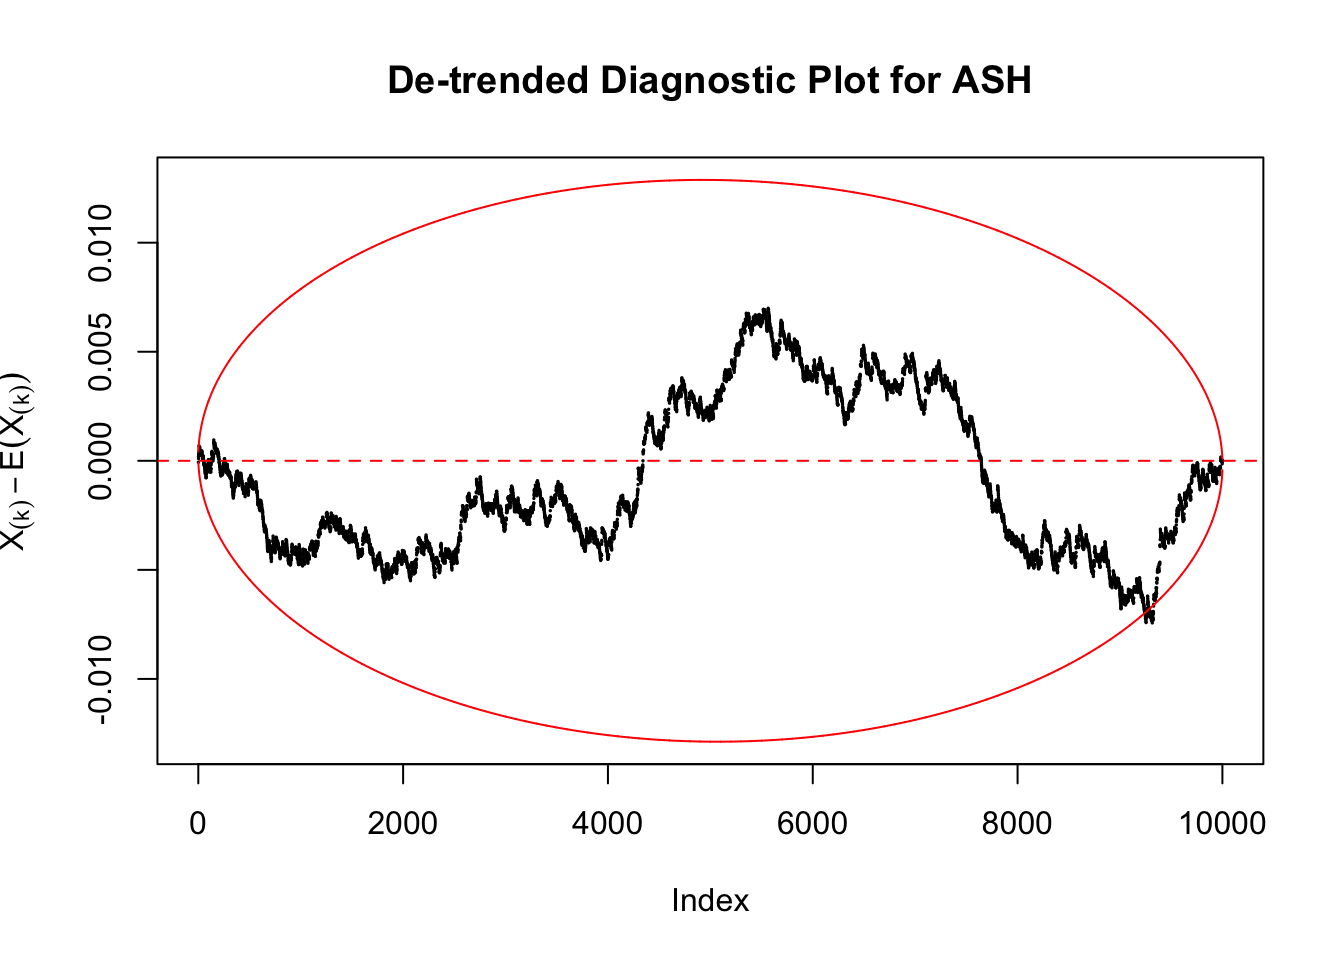
Based on discussion with Matthew on several ideas to improve the diagnostic plot for ASH, this file documents the latest version of plot_diagnostic function in ashr.
library(ashr)\(\alpha = 0.01\) rather than \(0.05\).
The idea is to “reduce the number of crossings some, but still give a good idea of what is expected without being too conservative.”
Other ideas
All have been put into the ashr::plot_diagnostic function.
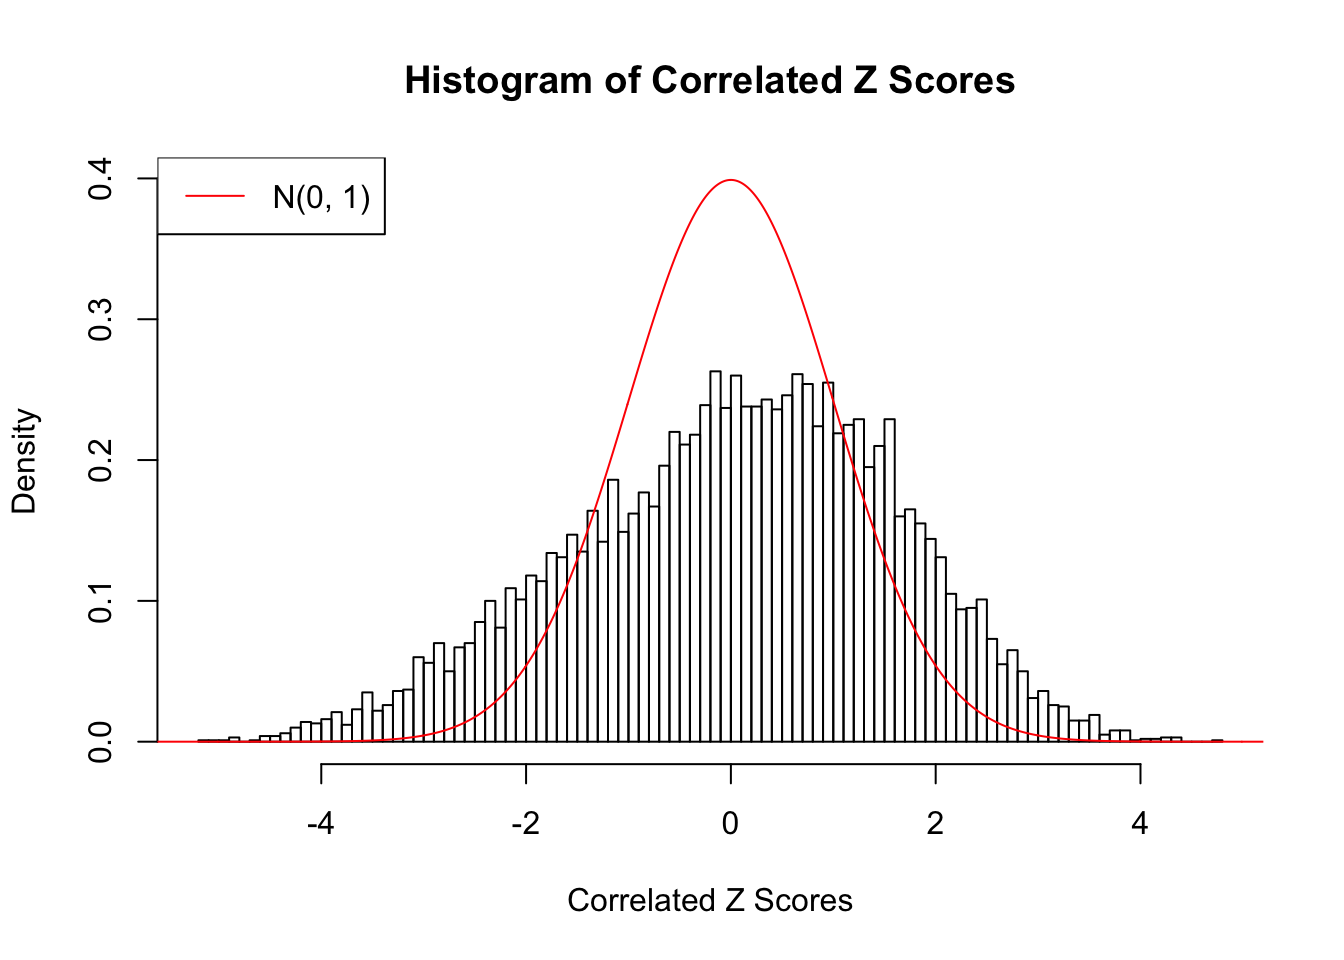
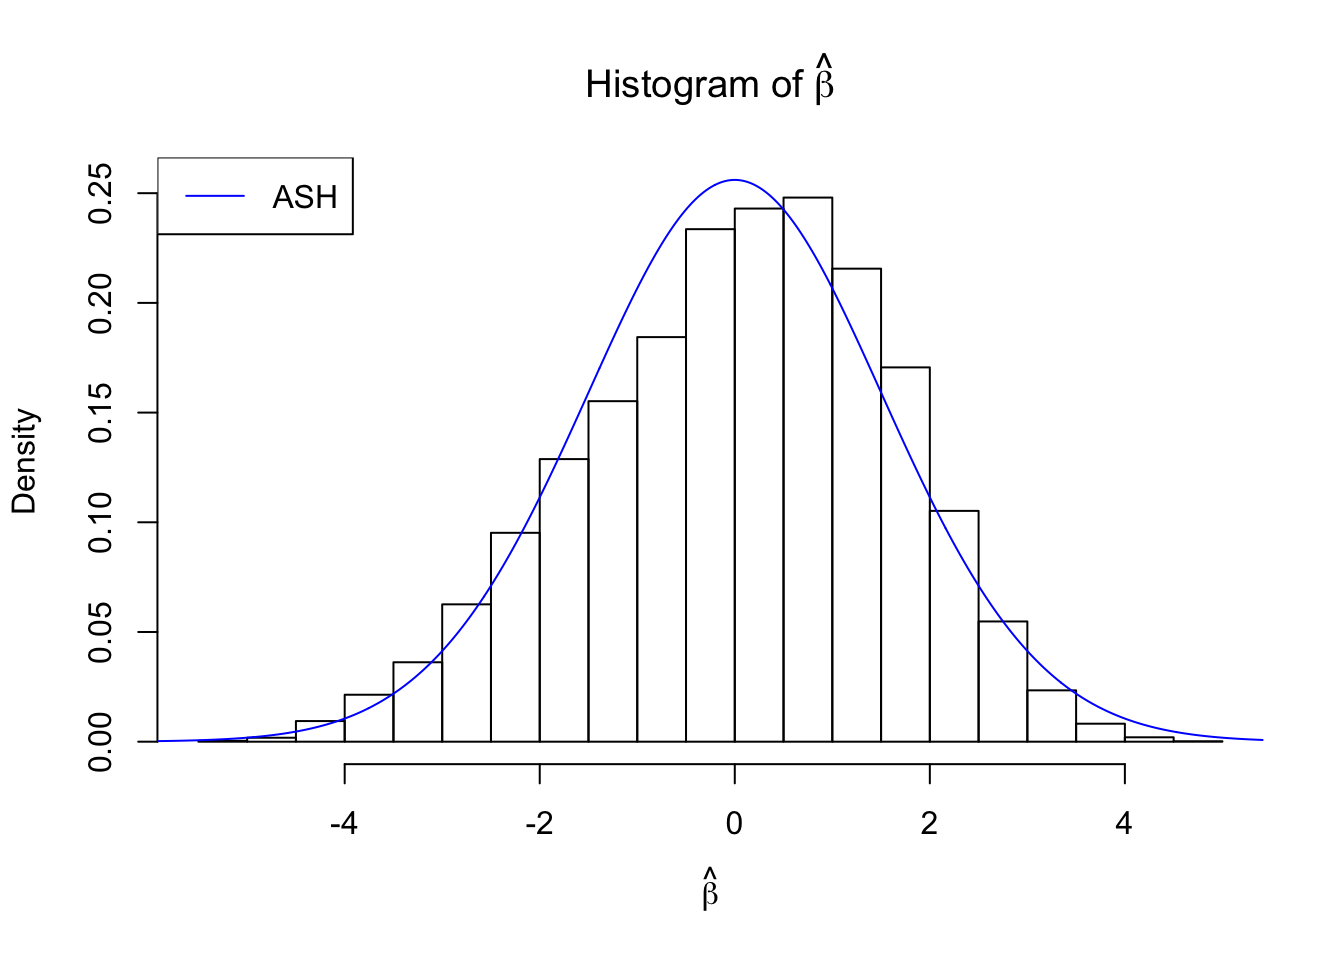
Illustration
Press [enter] to see next plot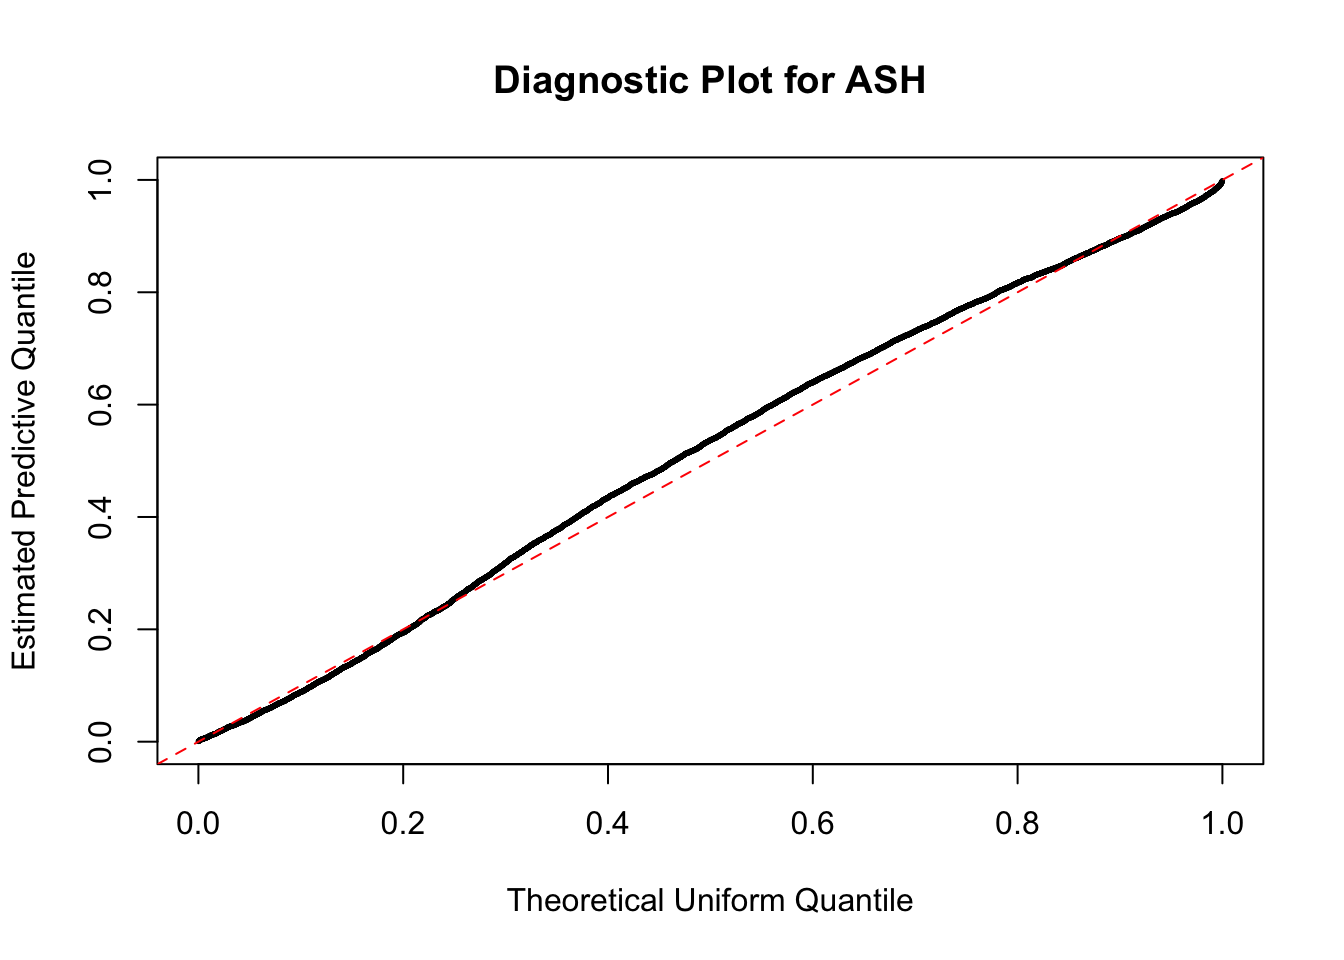
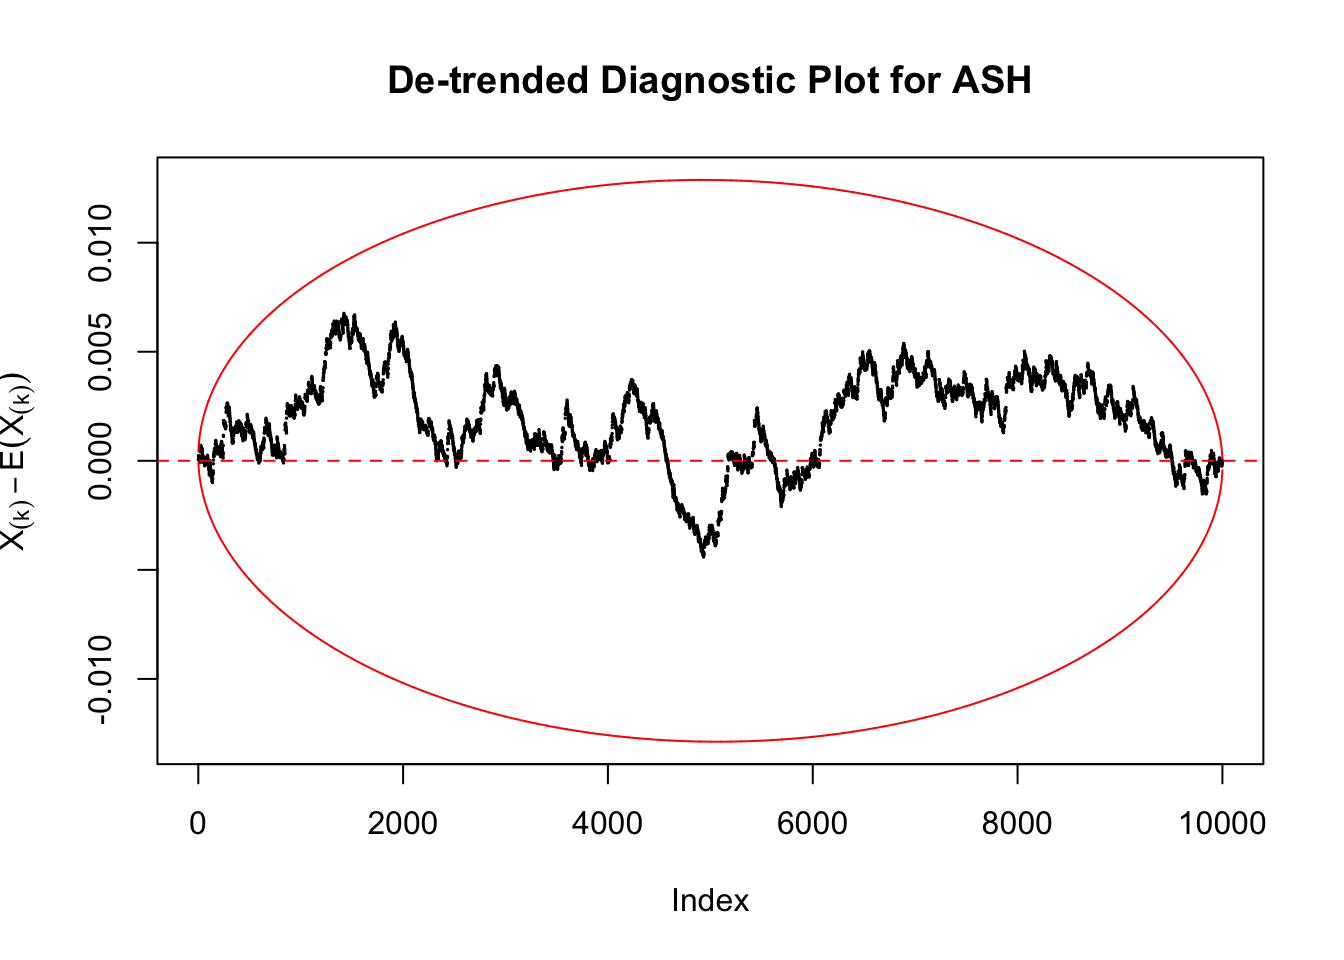
Press [enter] to see next plot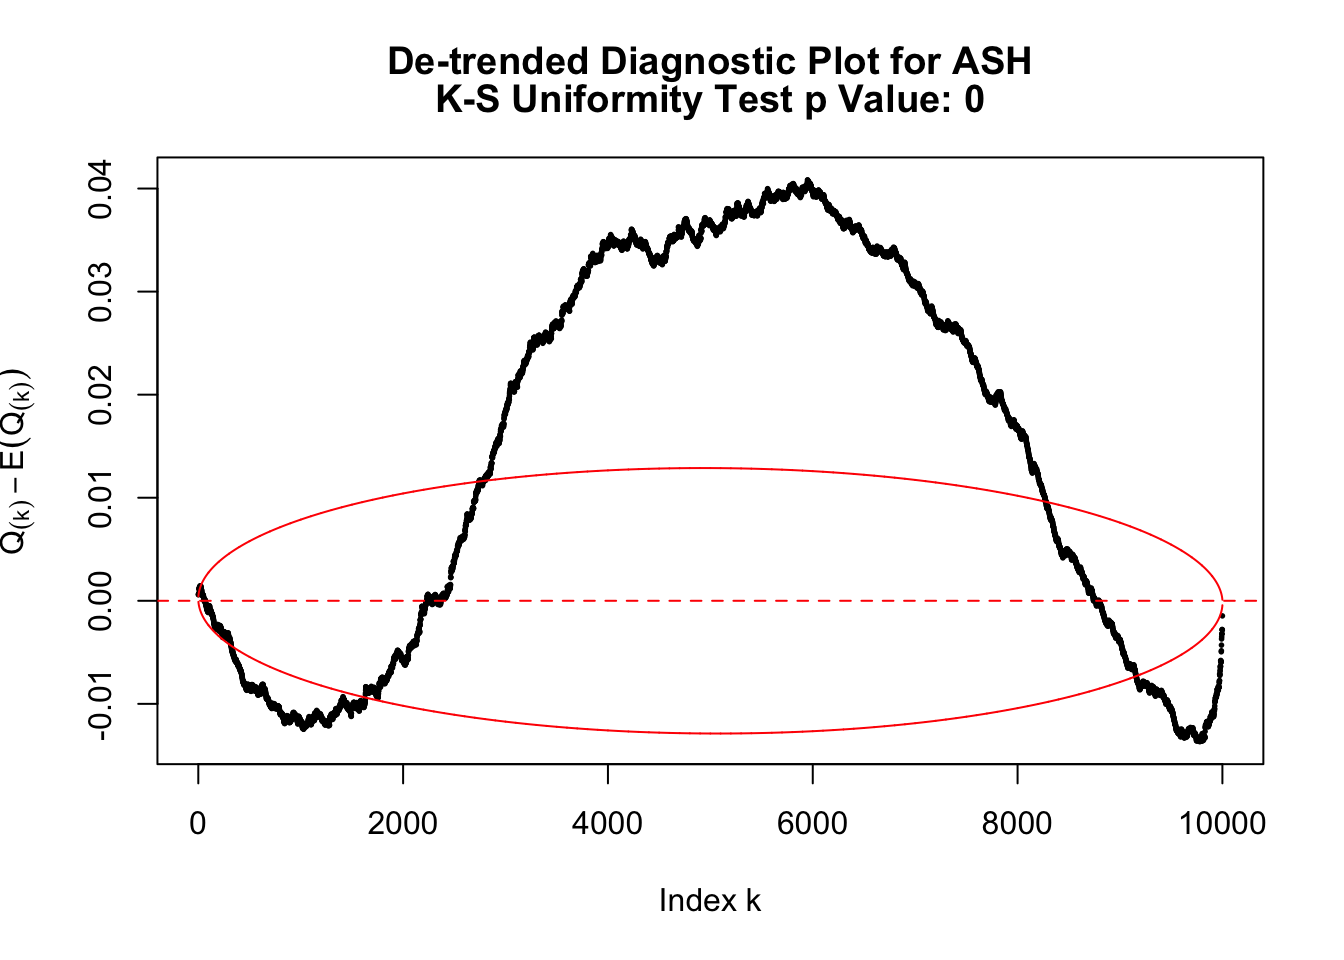
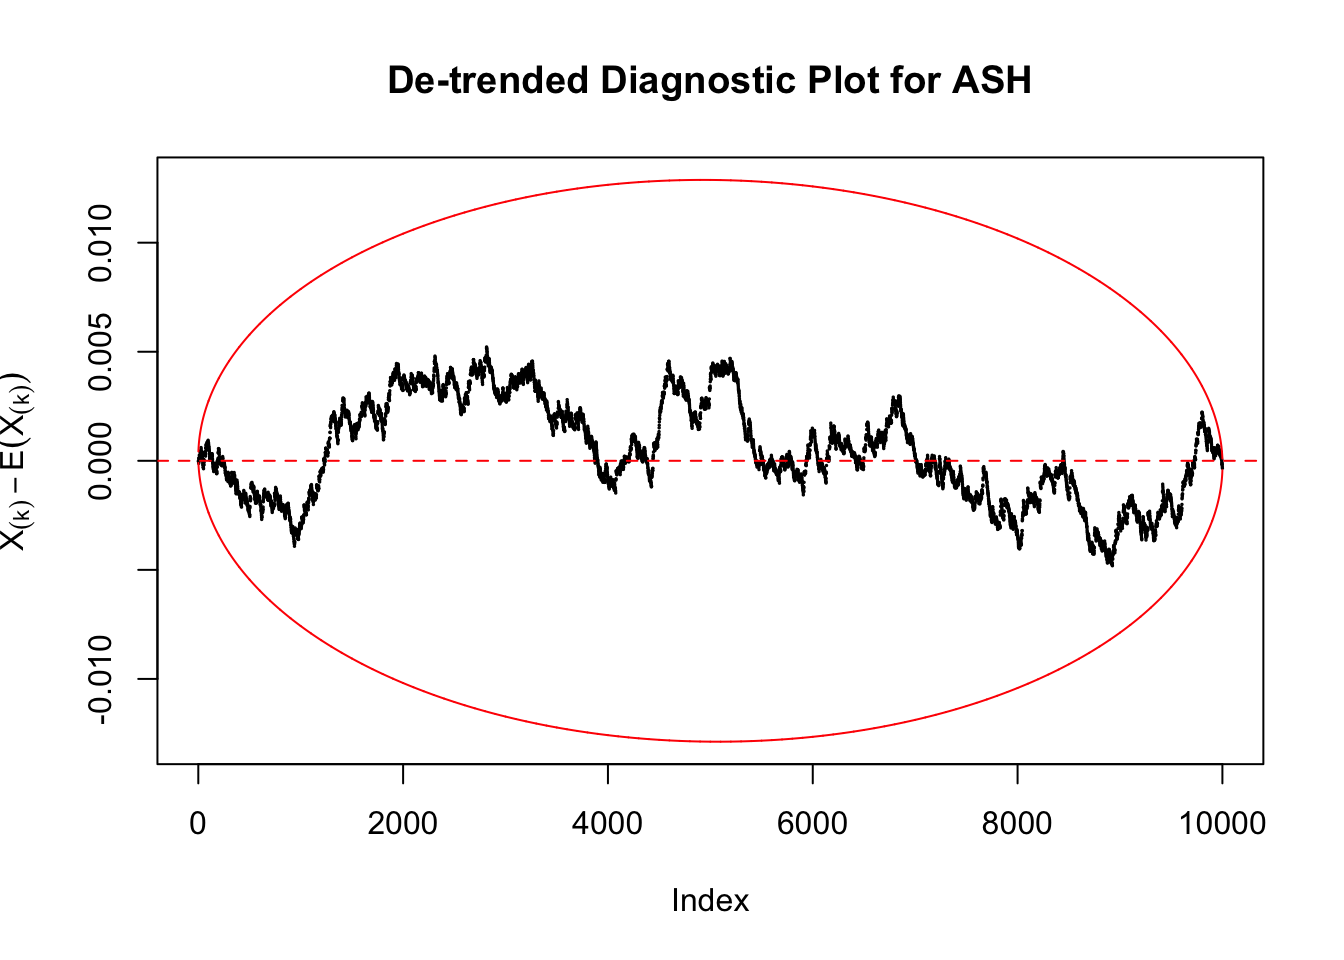
Press [enter] to see next plot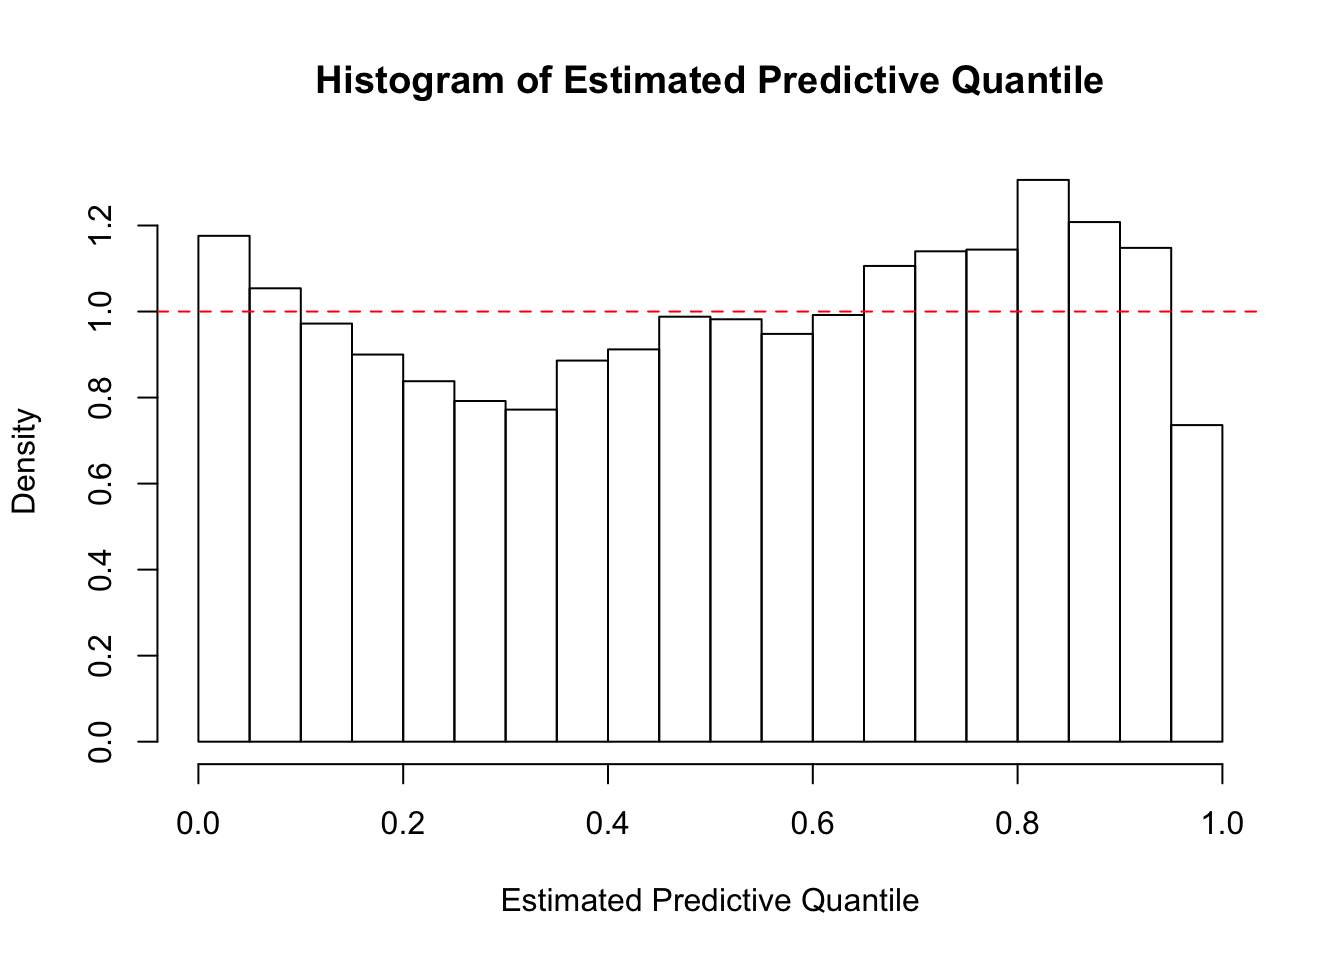
Session information
sessionInfo()R version 3.4.3 (2017-11-30)
Platform: x86_64-apple-darwin15.6.0 (64-bit)
Running under: macOS High Sierra 10.13.2
Matrix products: default
BLAS: /Library/Frameworks/R.framework/Versions/3.4/Resources/lib/libRblas.0.dylib
LAPACK: /Library/Frameworks/R.framework/Versions/3.4/Resources/lib/libRlapack.dylib
locale:
[1] en_US.UTF-8/en_US.UTF-8/en_US.UTF-8/C/en_US.UTF-8/en_US.UTF-8
attached base packages:
[1] stats graphics grDevices utils datasets methods base
loaded via a namespace (and not attached):
[1] compiler_3.4.3 backports_1.1.2 magrittr_1.5 rprojroot_1.3-1
[5] tools_3.4.3 htmltools_0.3.6 yaml_2.1.16 Rcpp_0.12.14
[9] stringi_1.1.6 rmarkdown_1.8 knitr_1.17 git2r_0.20.0
[13] stringr_1.2.0 digest_0.6.13 evaluate_0.10.1This R Markdown site was created with workflowr