True Signal vs Correlated Null: Larger Effects
Lei Sun
2017-03-30
Last updated: 2017-11-07
Code version: 2c05d59
Introduction
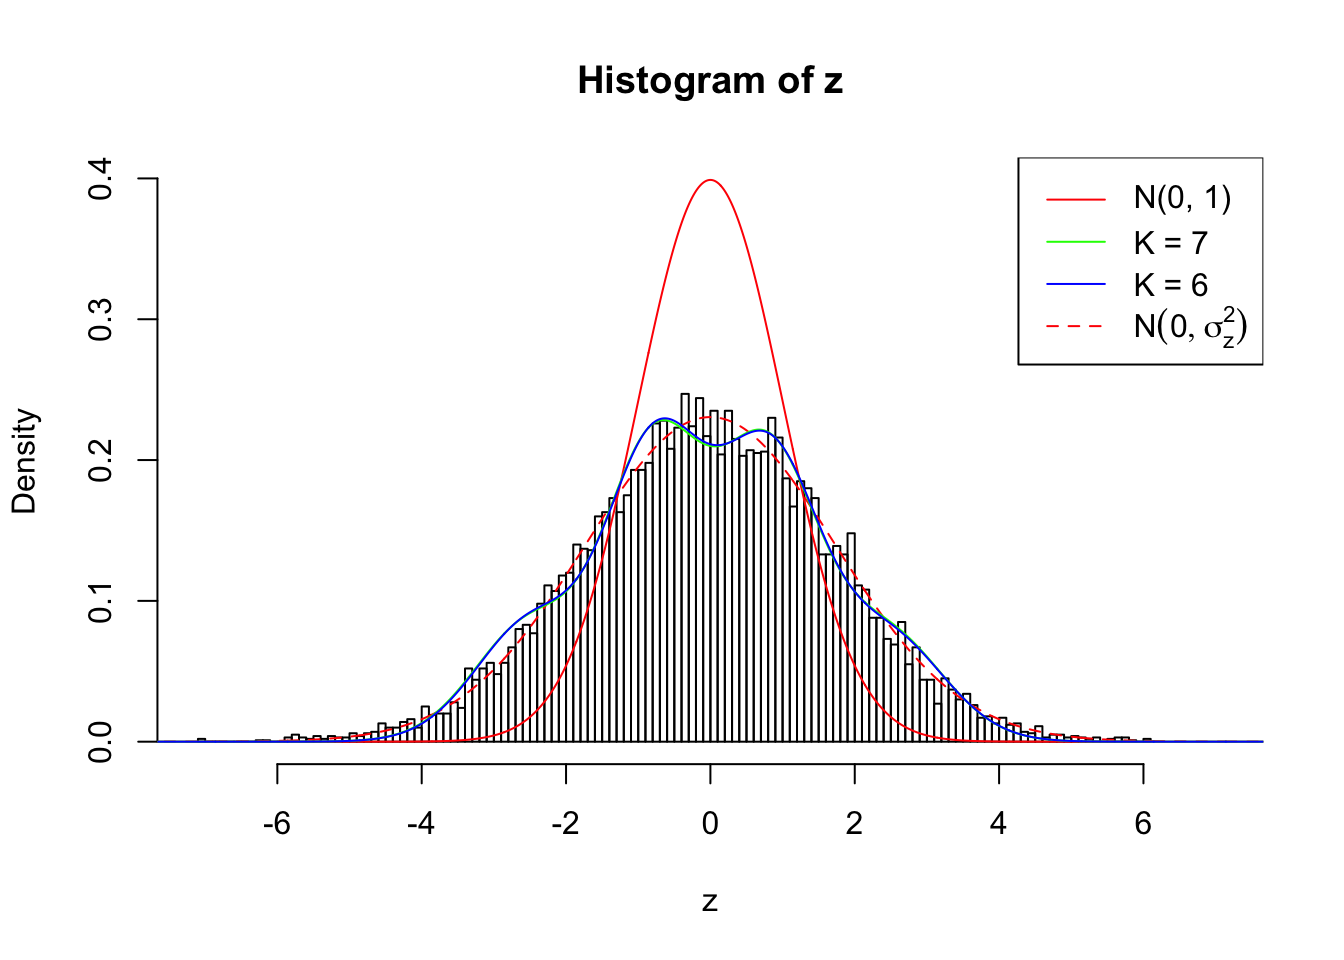
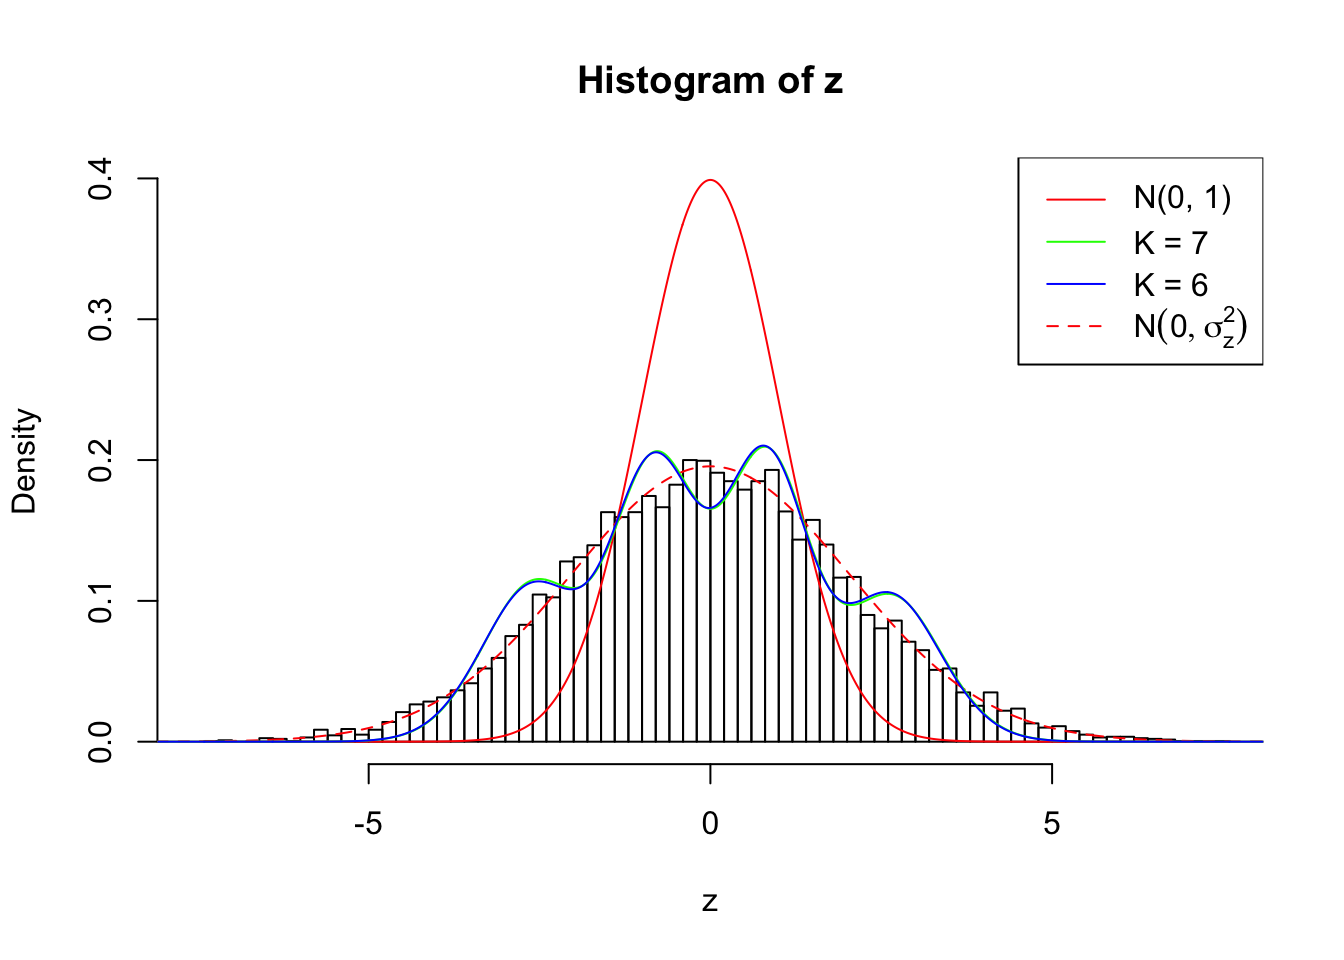
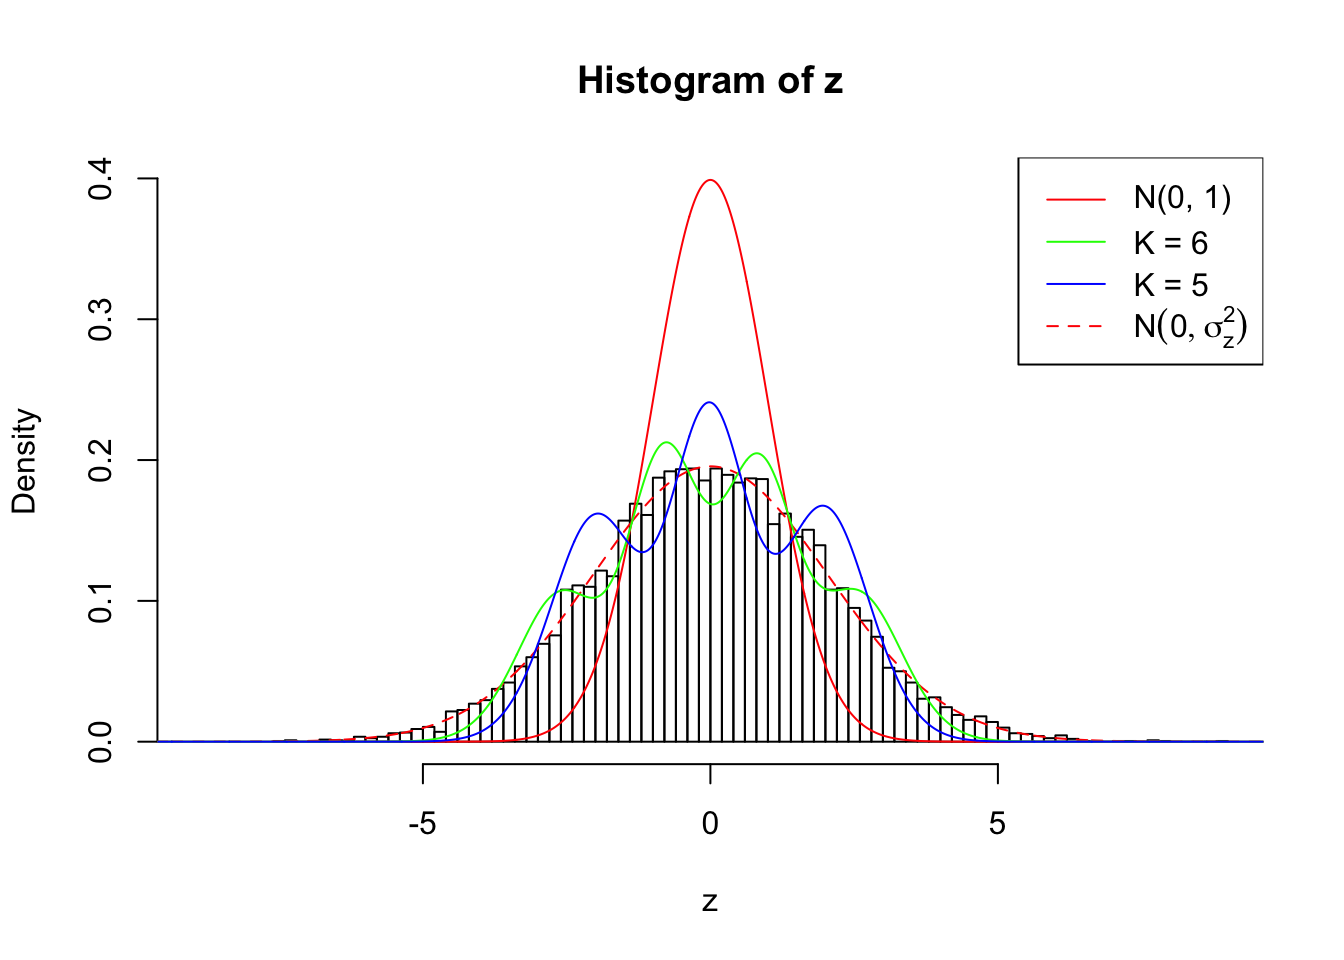
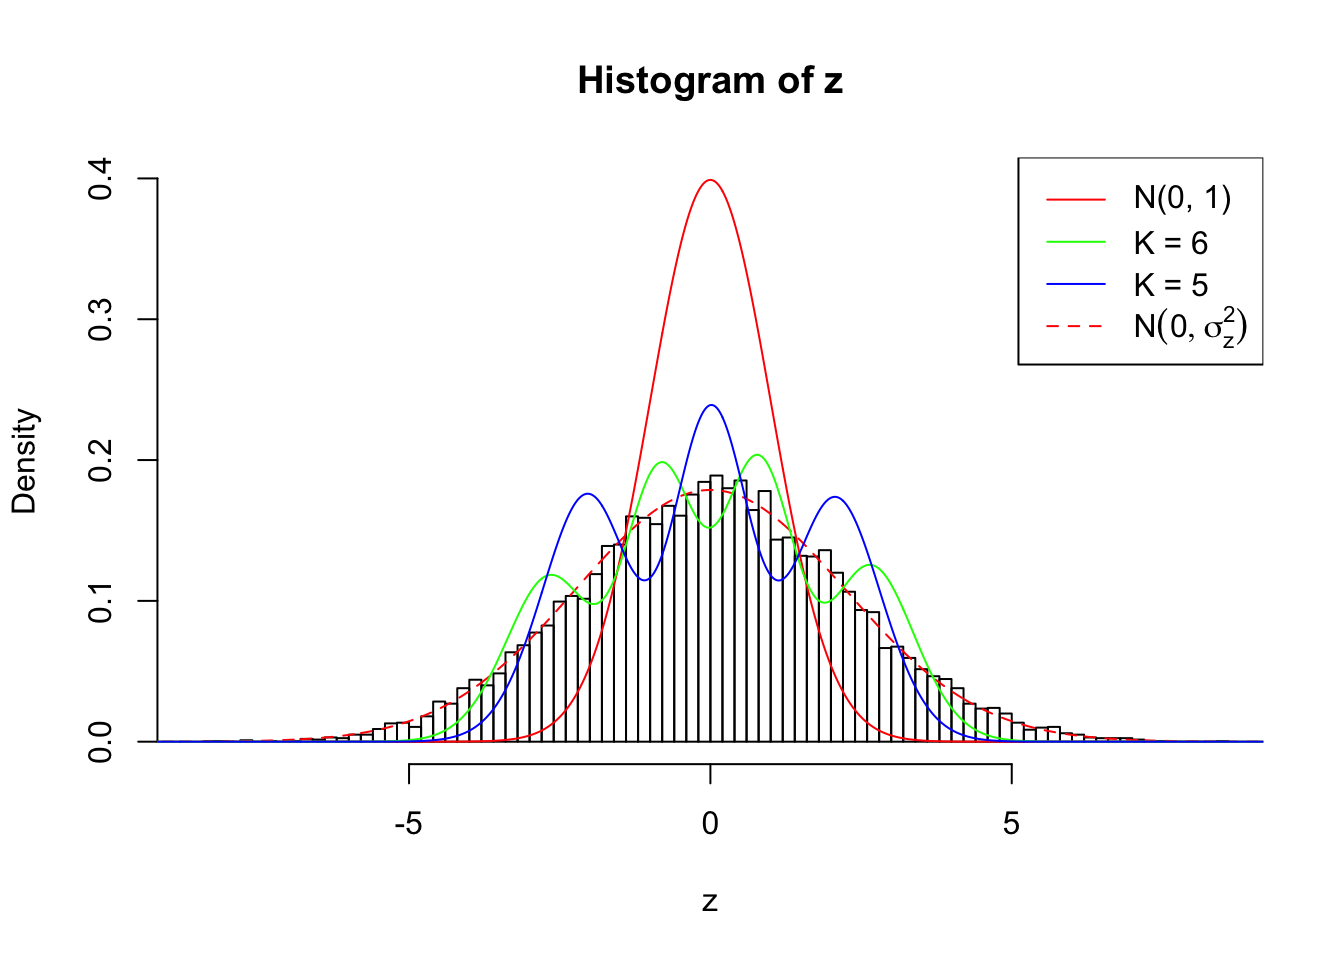
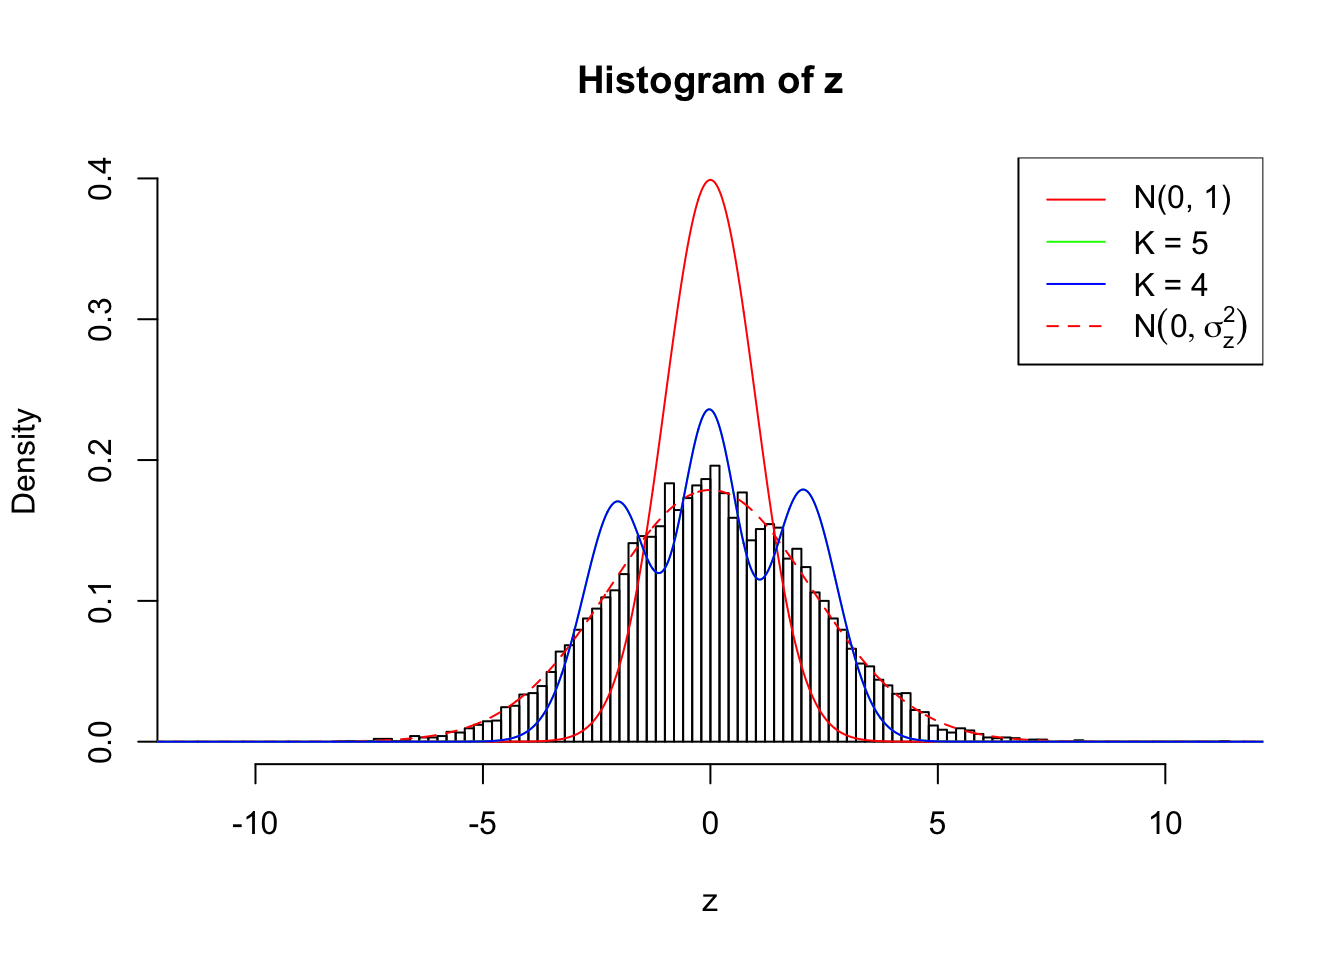
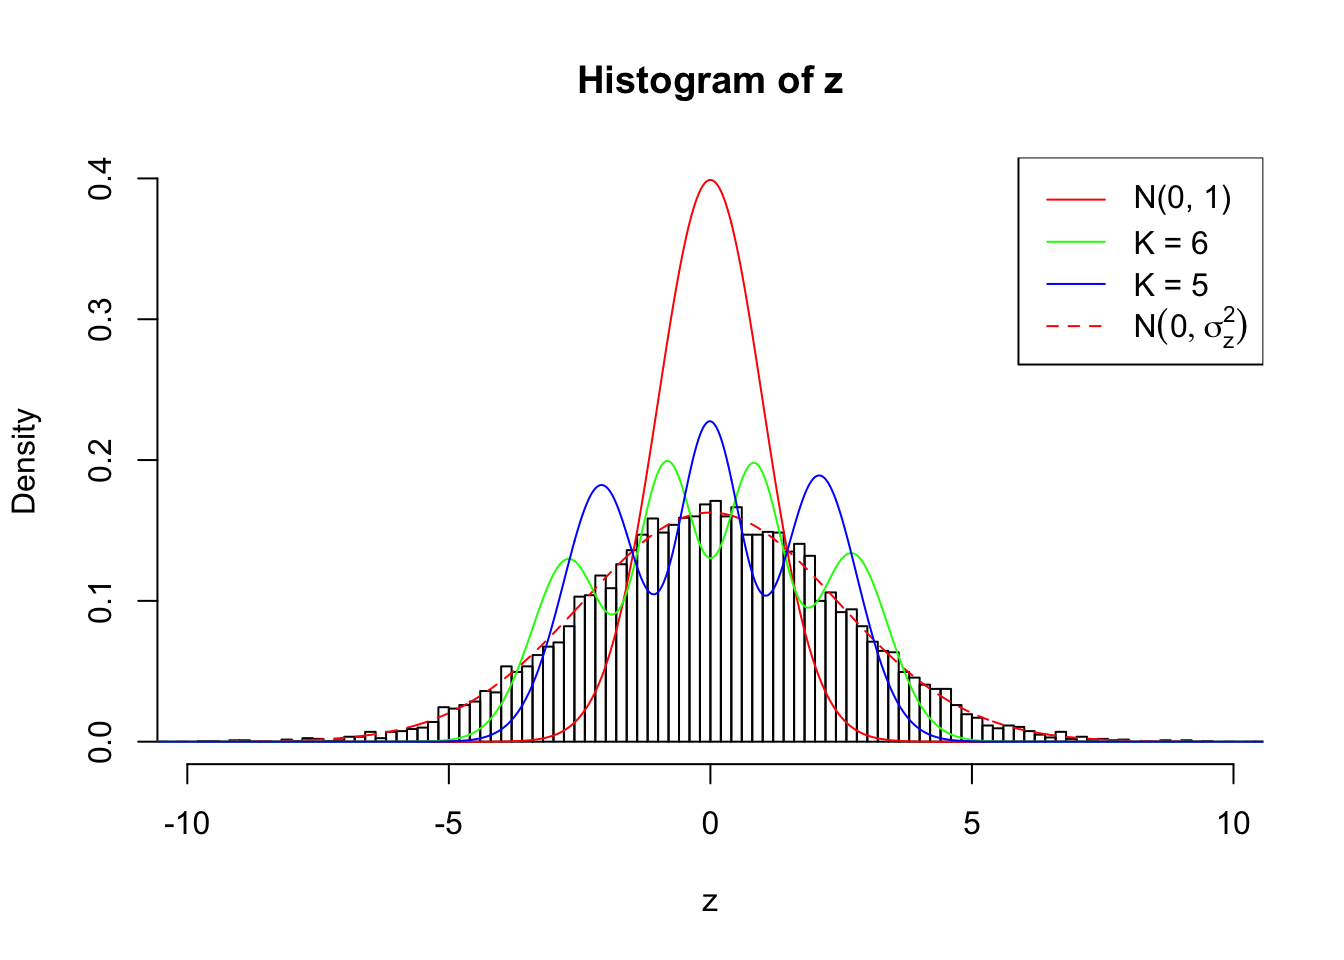
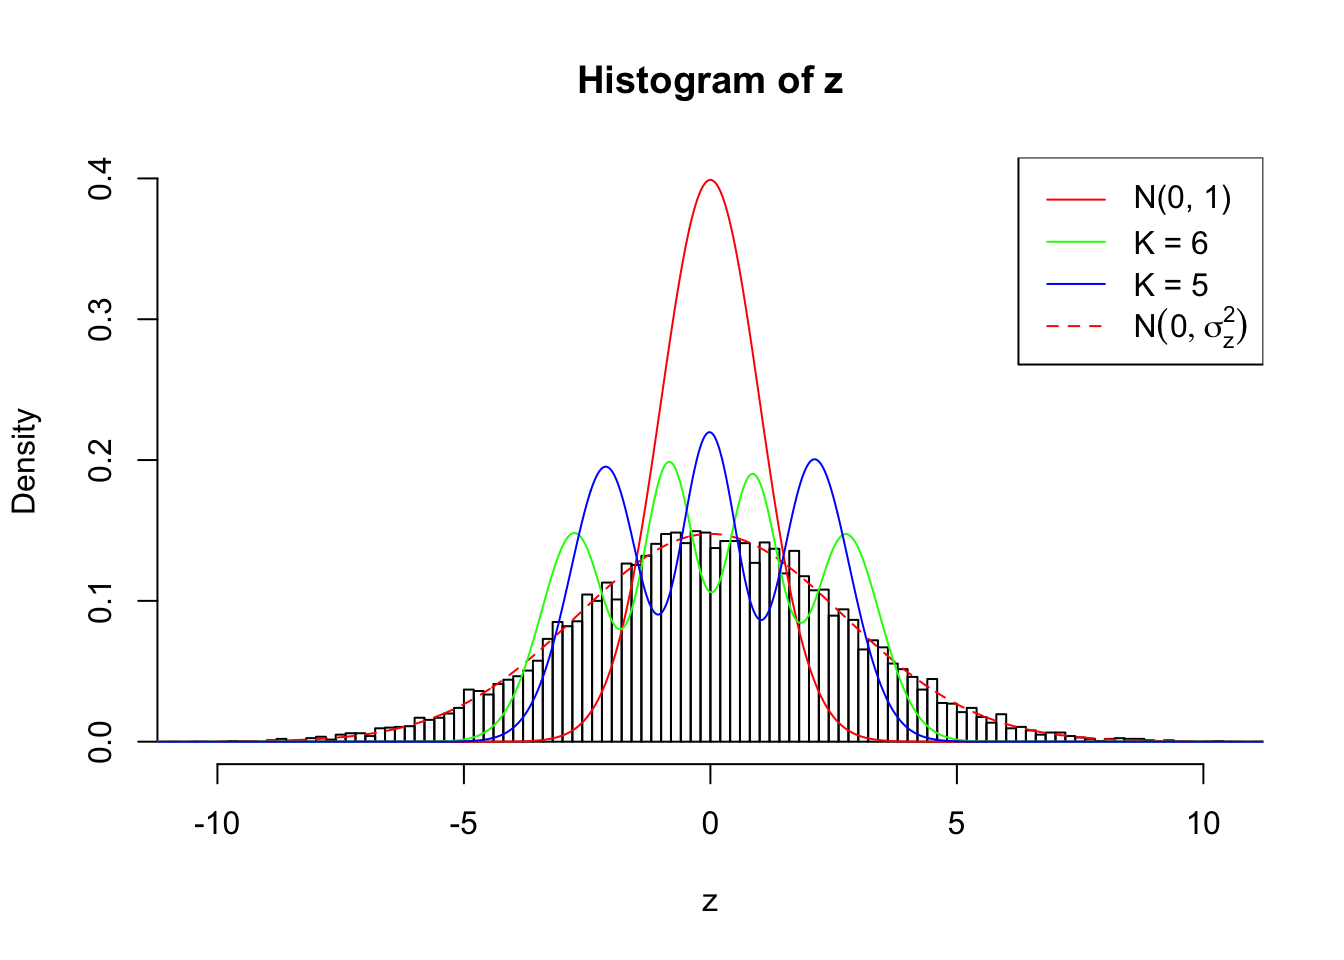
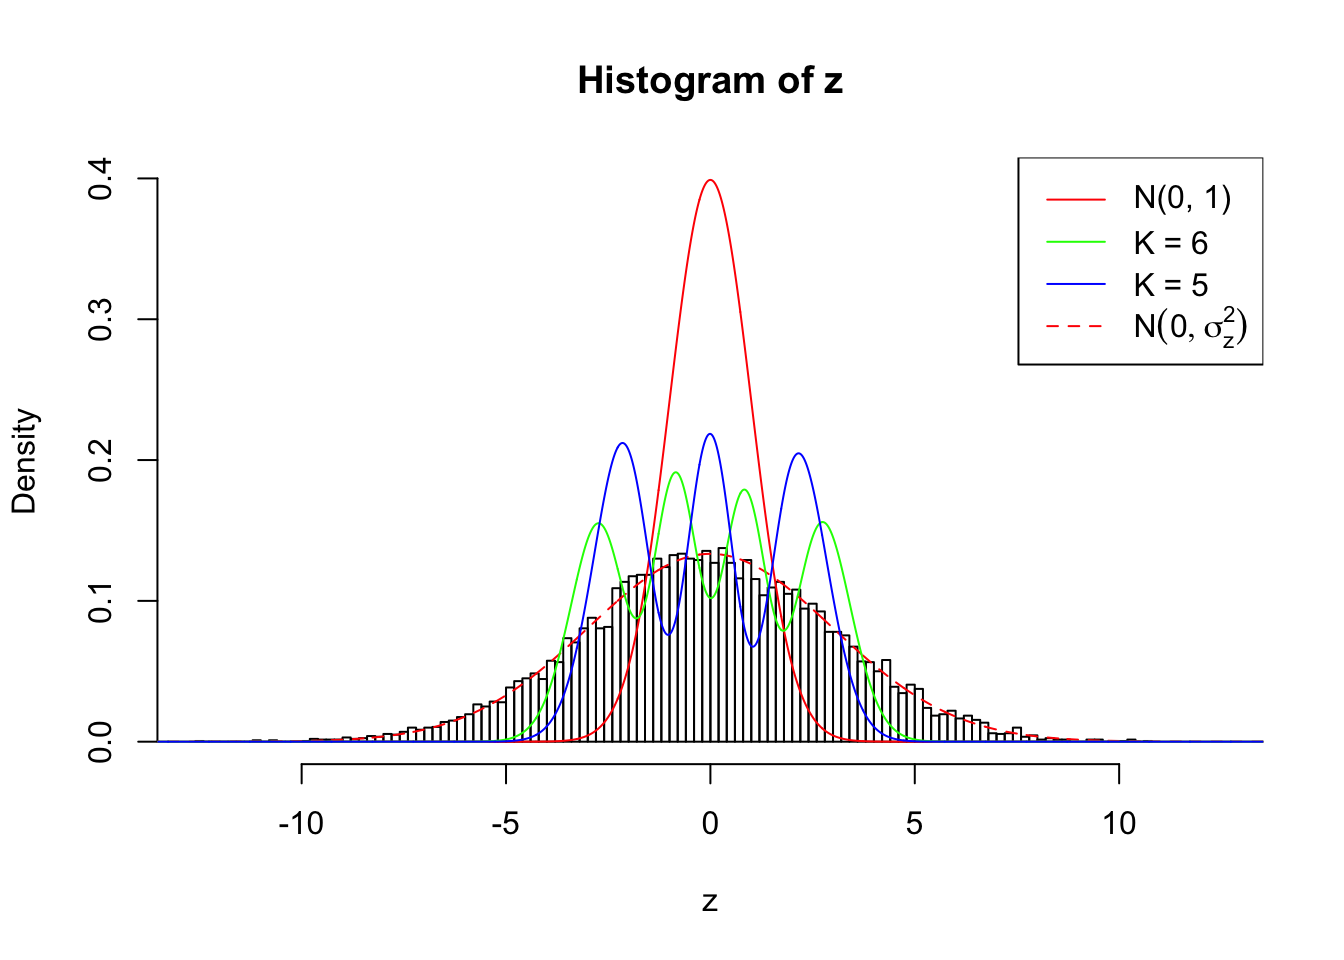
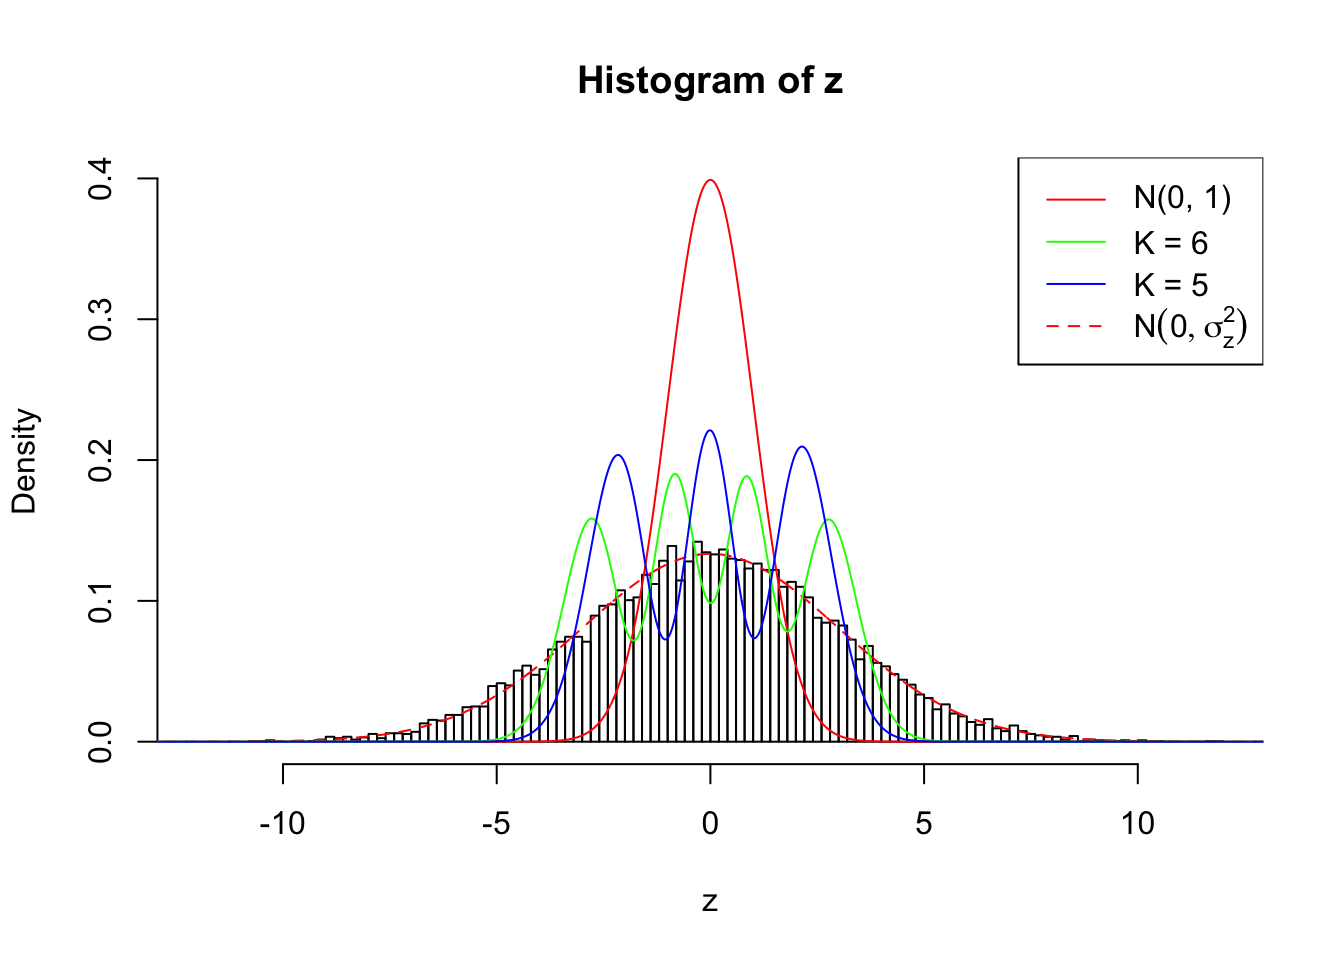
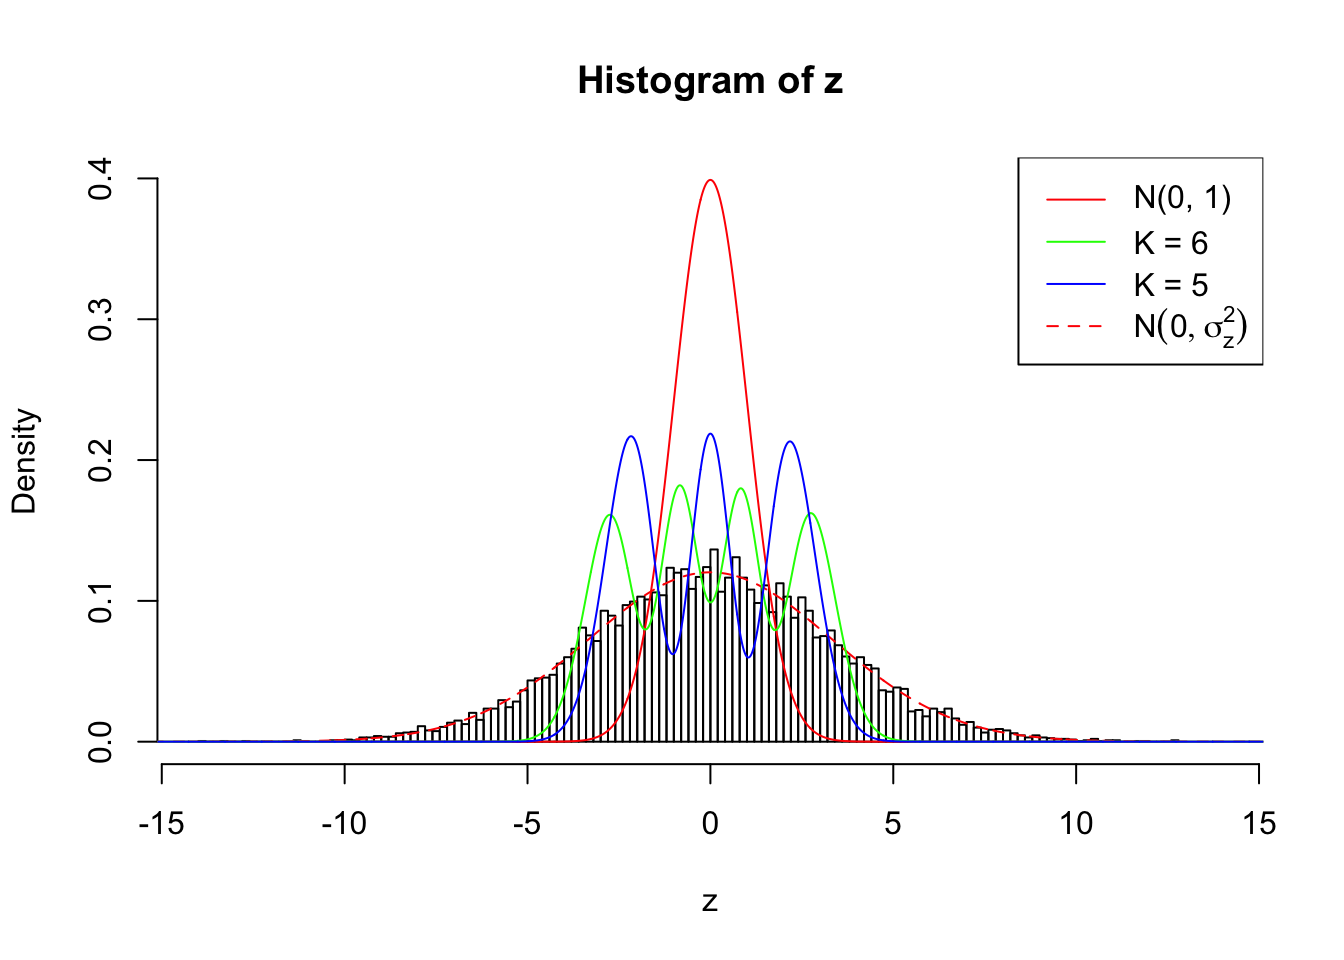
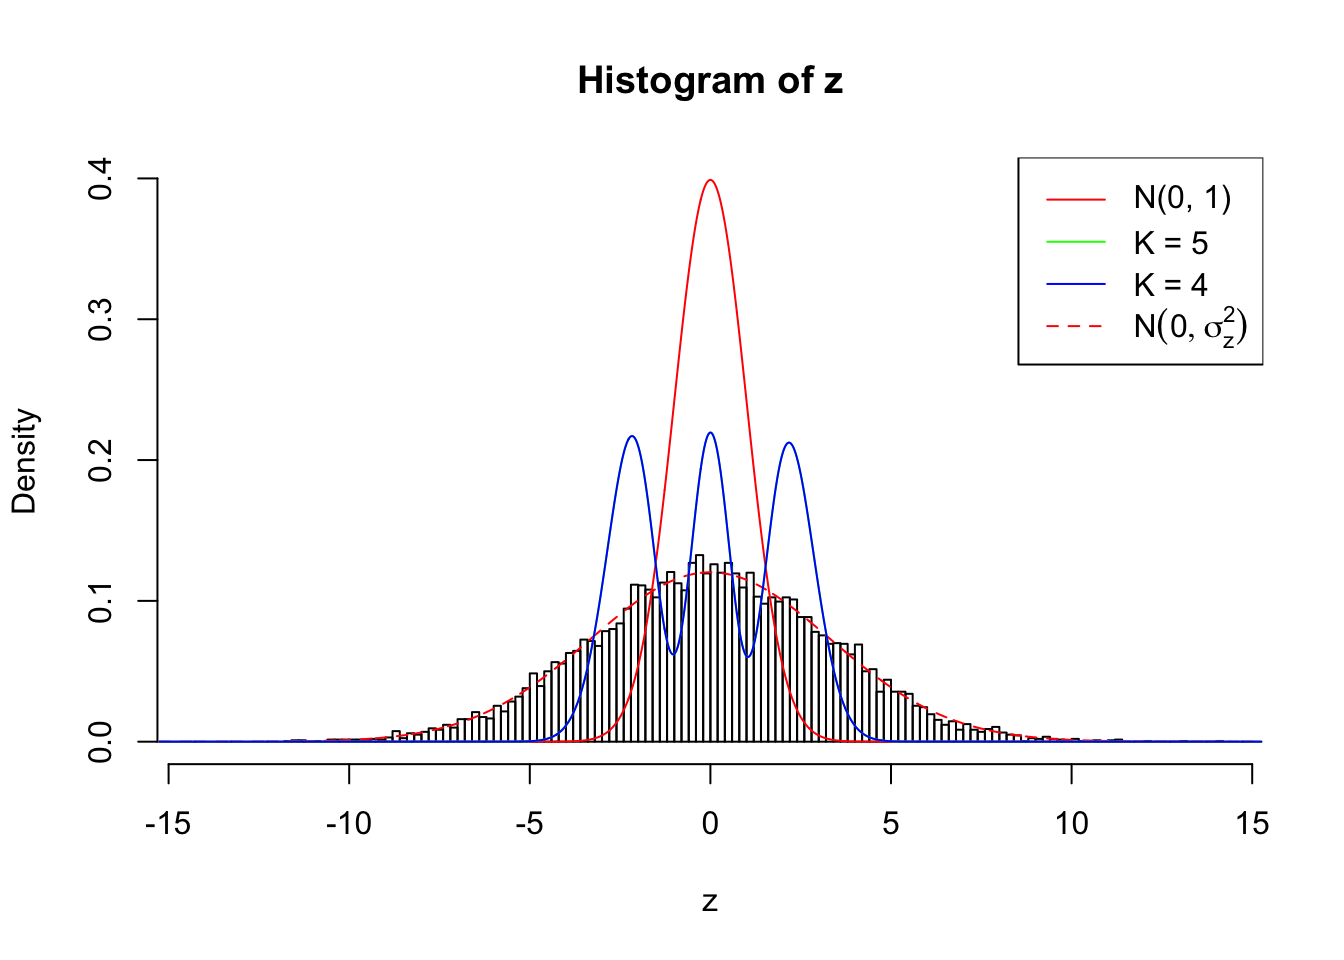
We’ve shown that independent \(N(0, 2)\) samples can be fitted by Gaussian derivatives relatively reasonably. As previously noted, that is an SNR = 0 case. Now we want to show how Gaussian derivatives work on cases with increasing SNRs.
Here SNR in db is defined as \(10\log_{10}\left(\frac{\sigma_\beta^2}{\sigma_e^2}\right)\), where in our setting \(\sigma_e^2 = 1\), \(\sigma_z^2 = \sigma_\beta^2 + \sigma_e^2\).
Simulation and plots
library(ashr)
source("../code/ecdfz.R")
Warning: replacing previous import 'Matrix::crossprod' by 'gmp::crossprod'
when loading 'cvxr'Warning: replacing previous import 'Matrix::tcrossprod' by
'gmp::tcrossprod' when loading 'cvxr'n = 1e4
m = 5
SNR.min = 1
SNR.max = 10
res = list()
set.seed(777)
for (SNR in SNR.min : SNR.max) {
z.sd = sqrt(10^(SNR / 10) + 1)
zmat = matrix(rnorm(n * m, 0, sd = z.sd), nrow = m, byrow = TRUE)
res[[SNR]] = list()
for (i in 1:m) {
z = zmat[i, ]
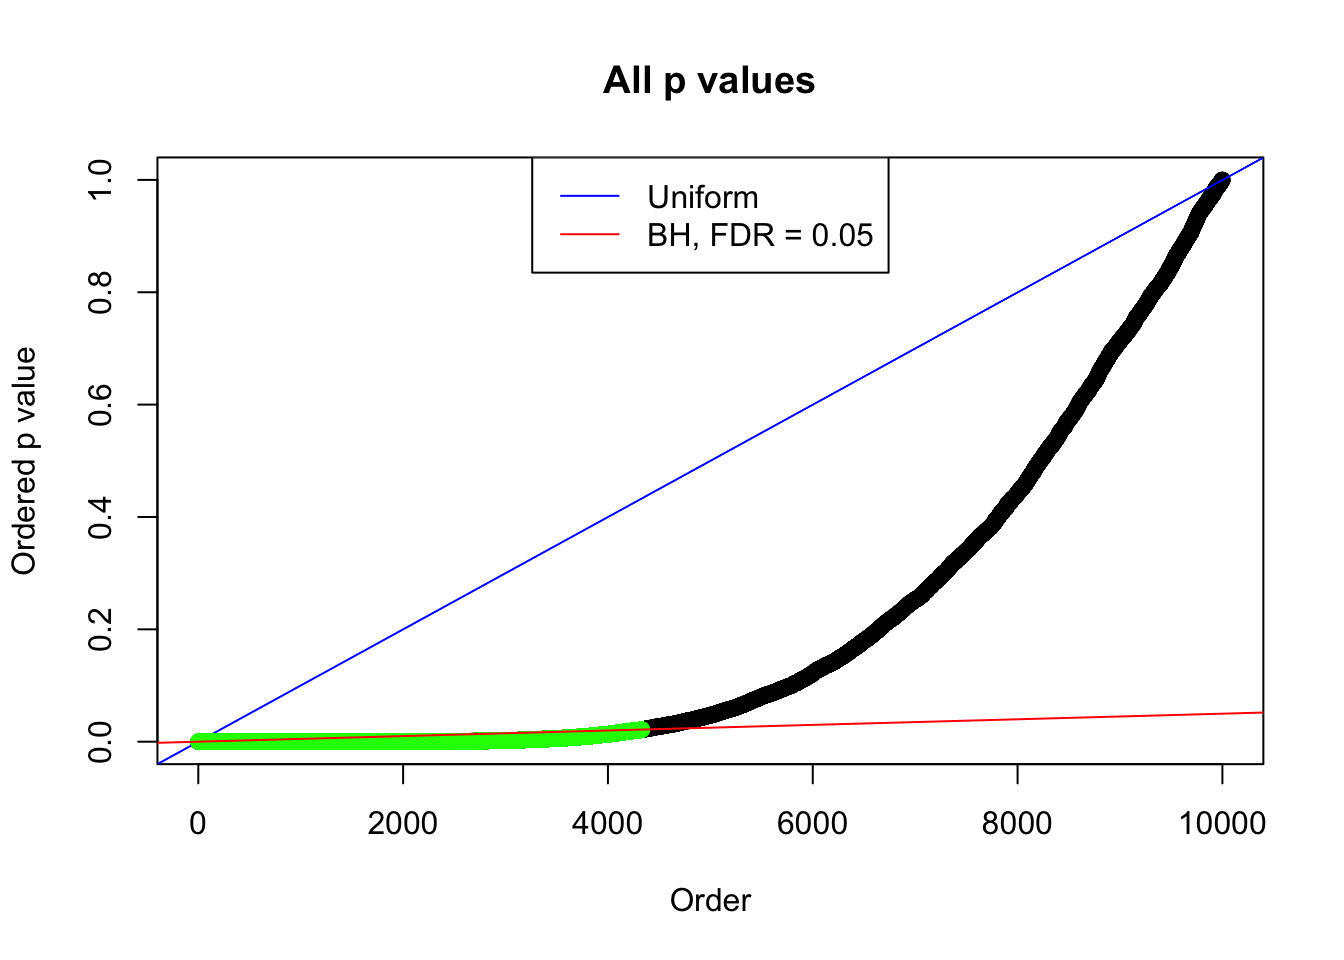
p = (1 - pnorm(abs(z))) * 2
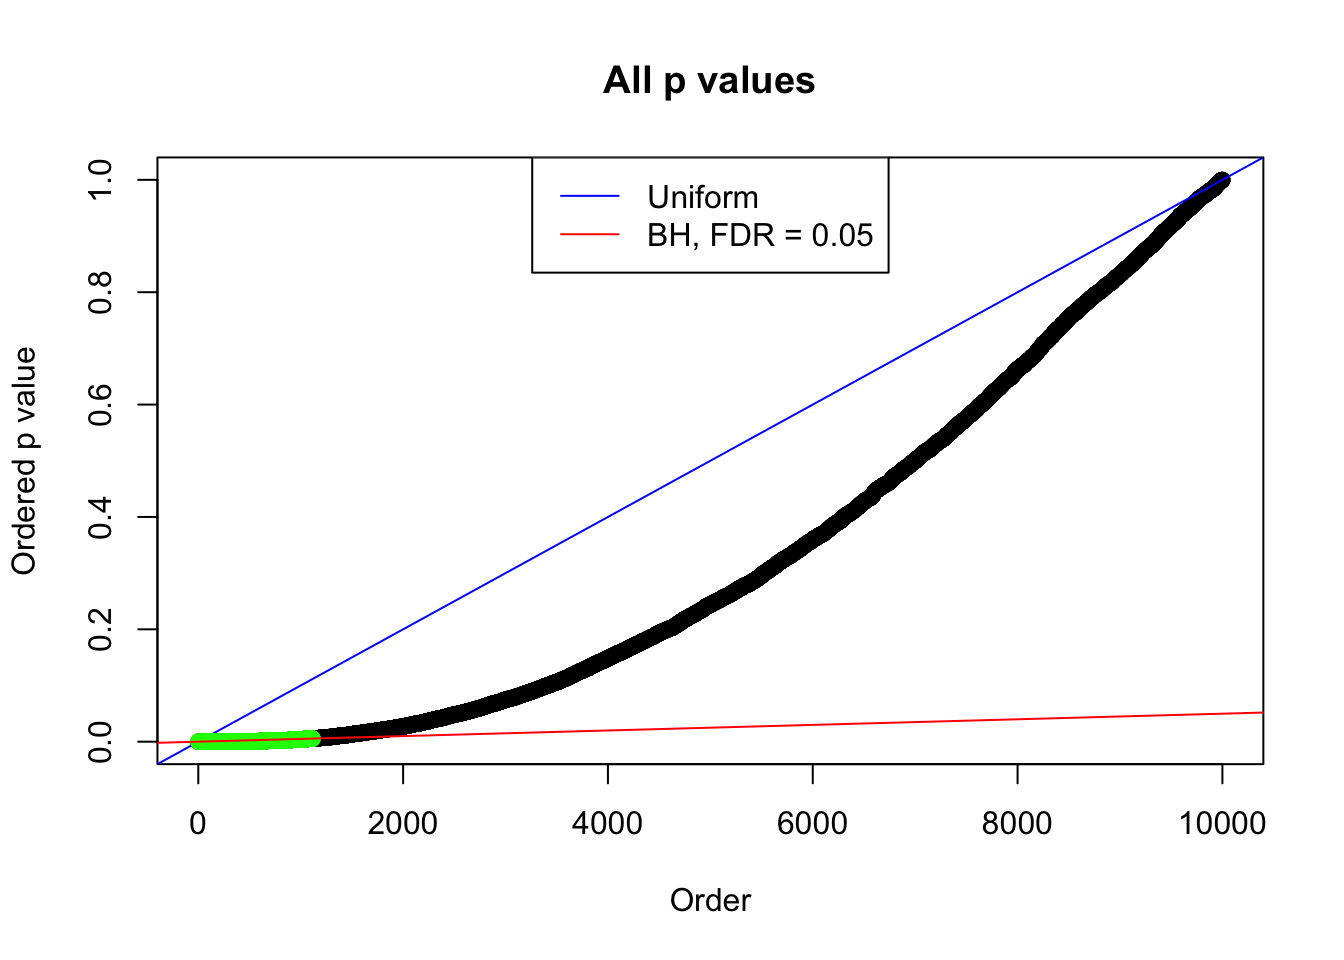
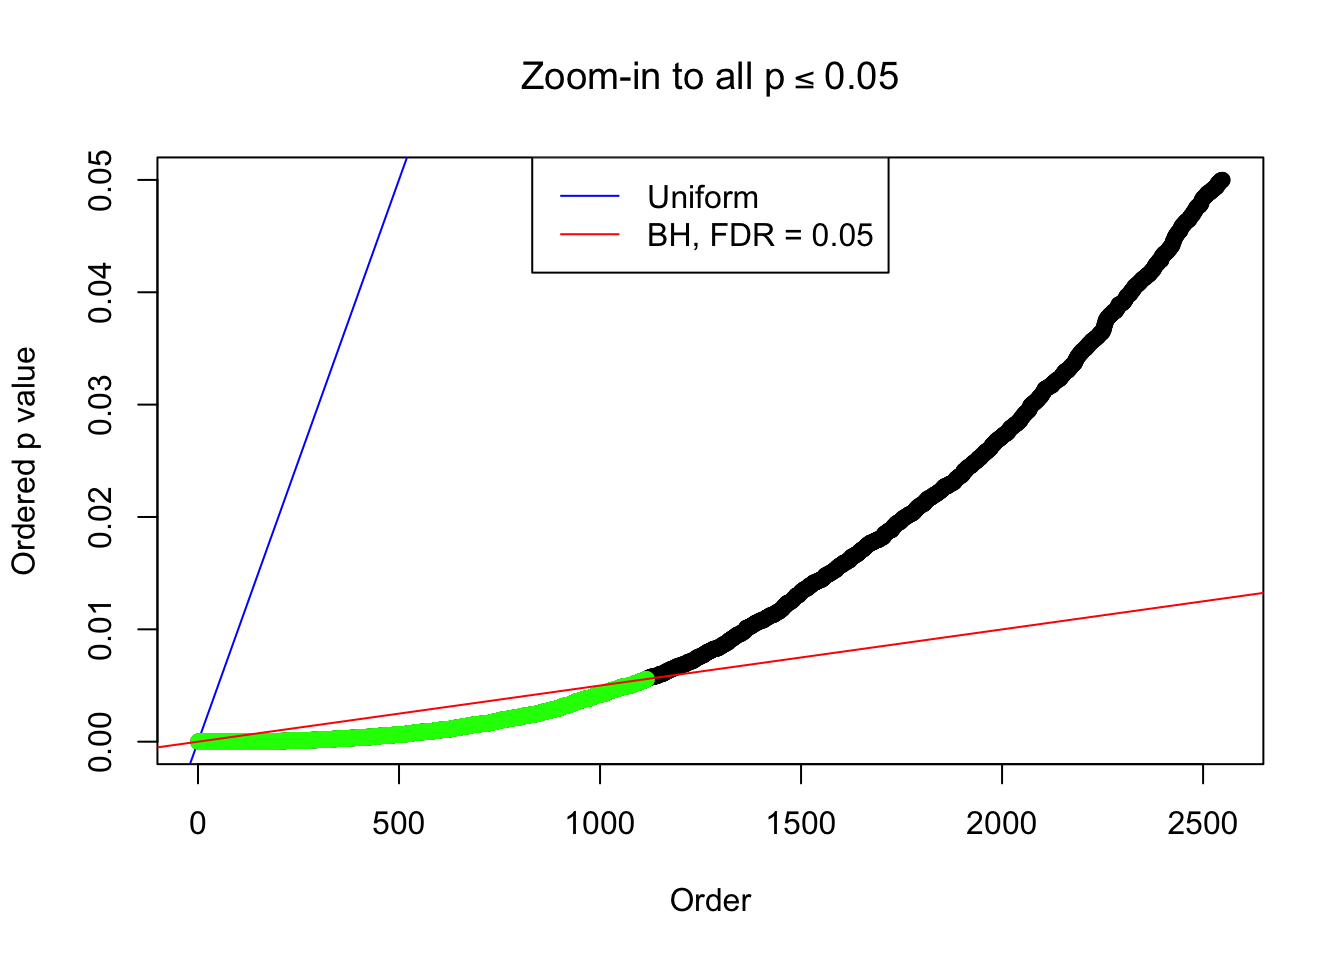
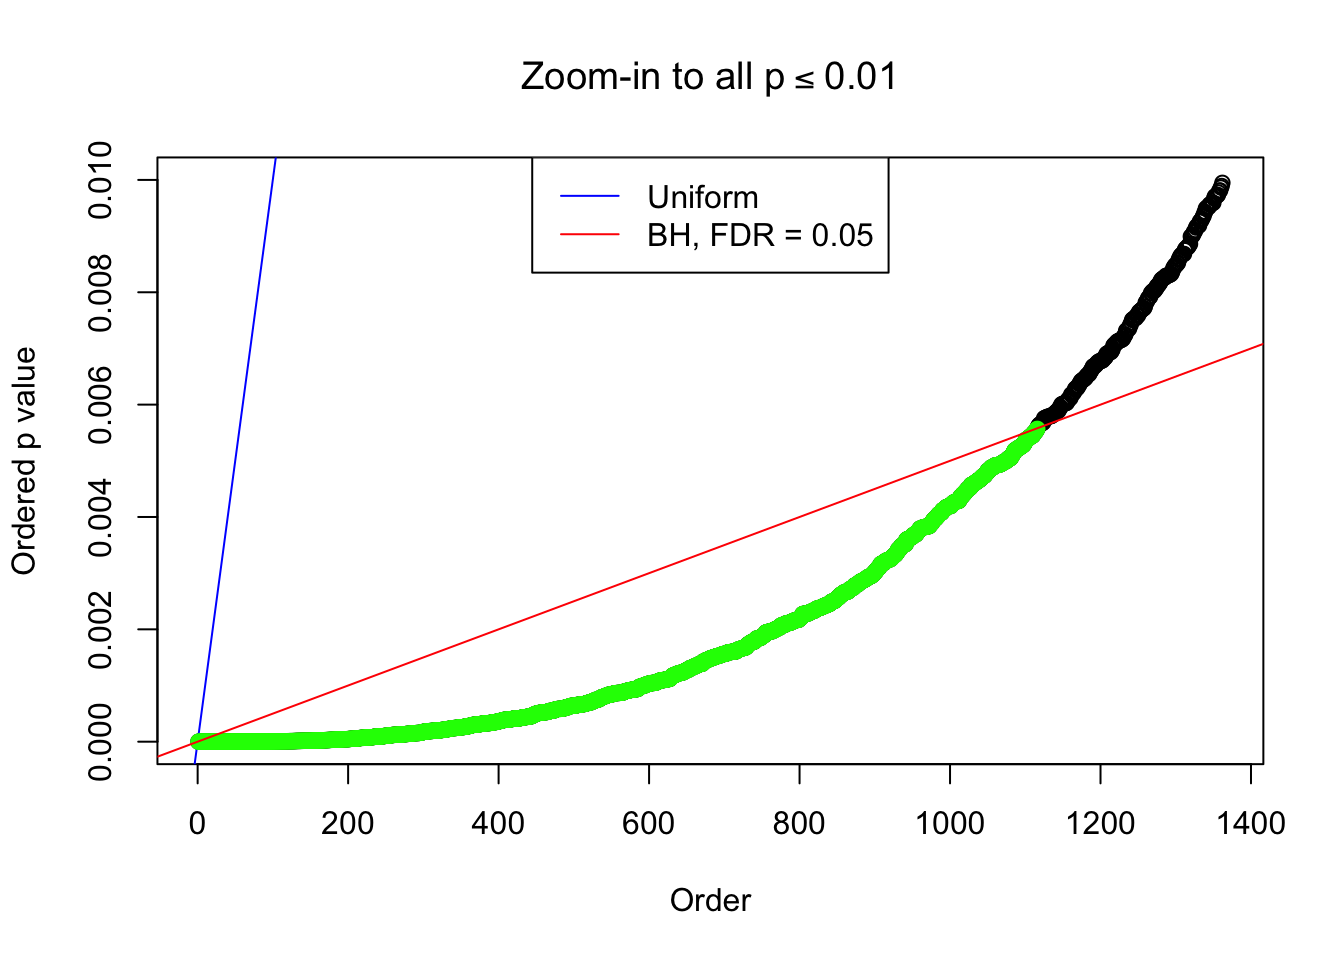
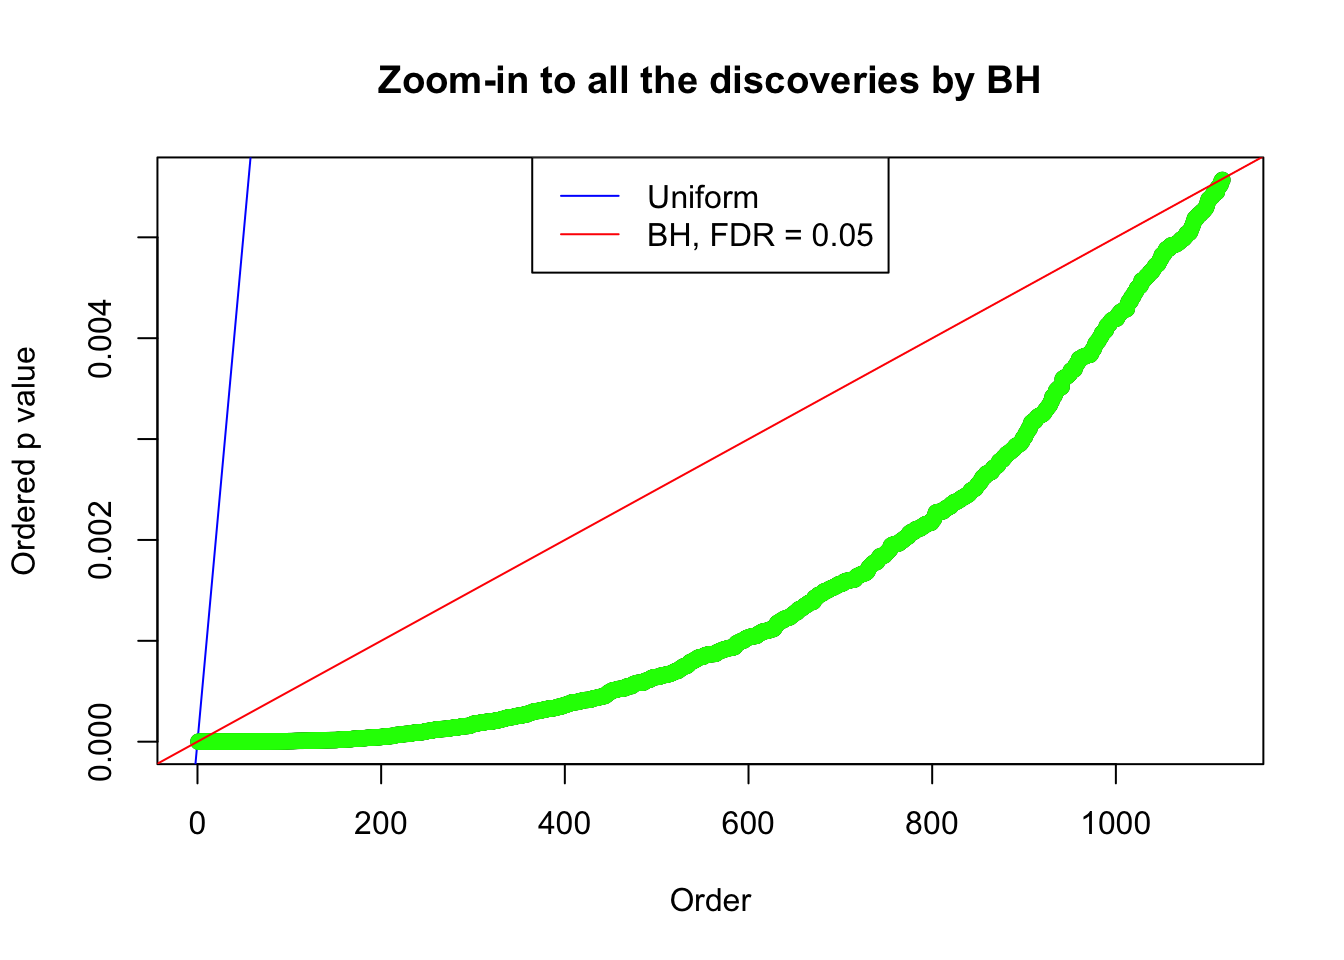
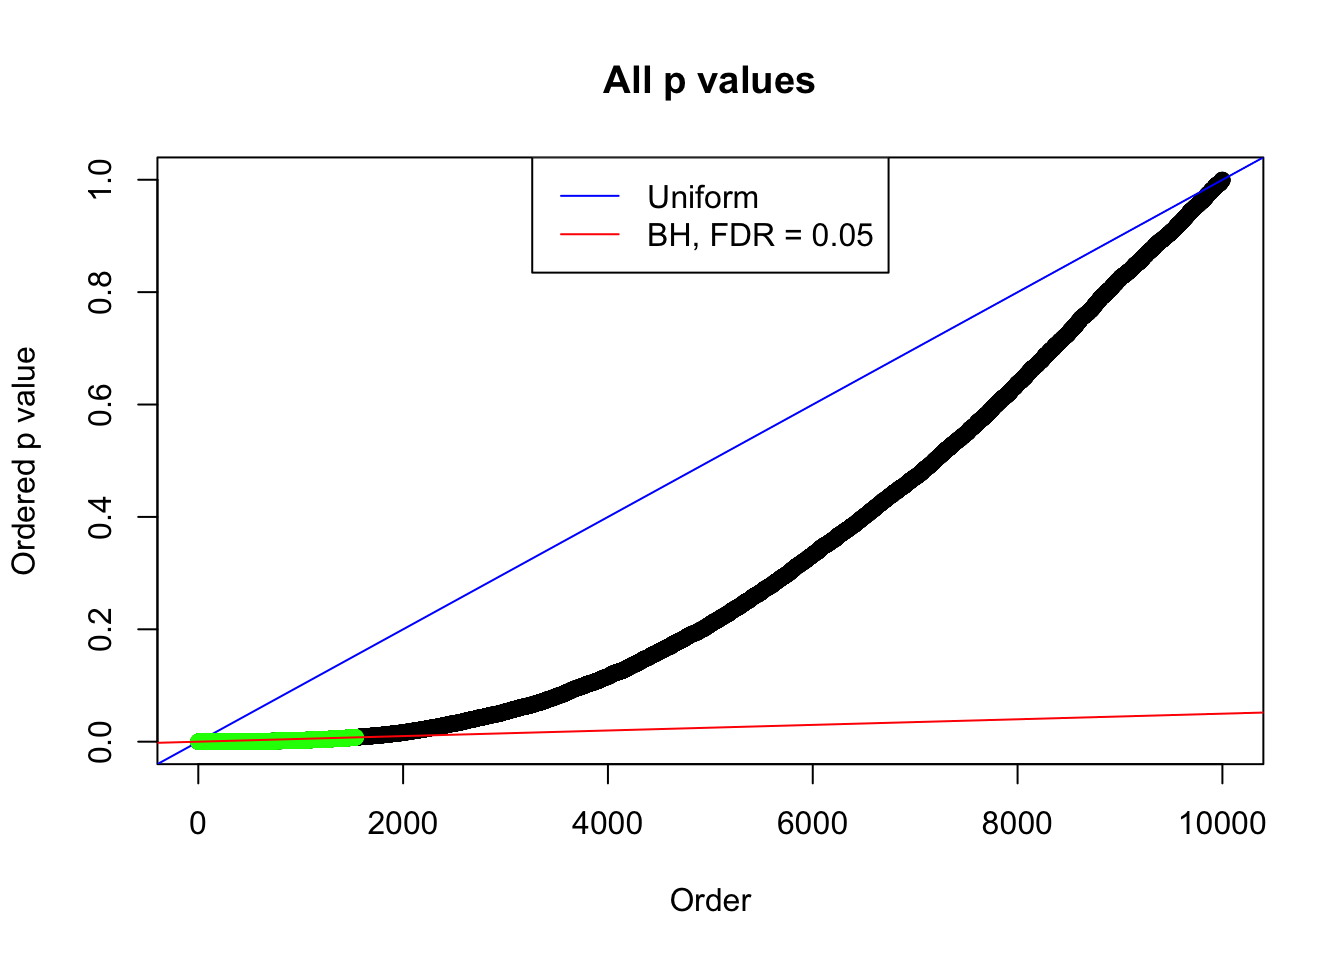
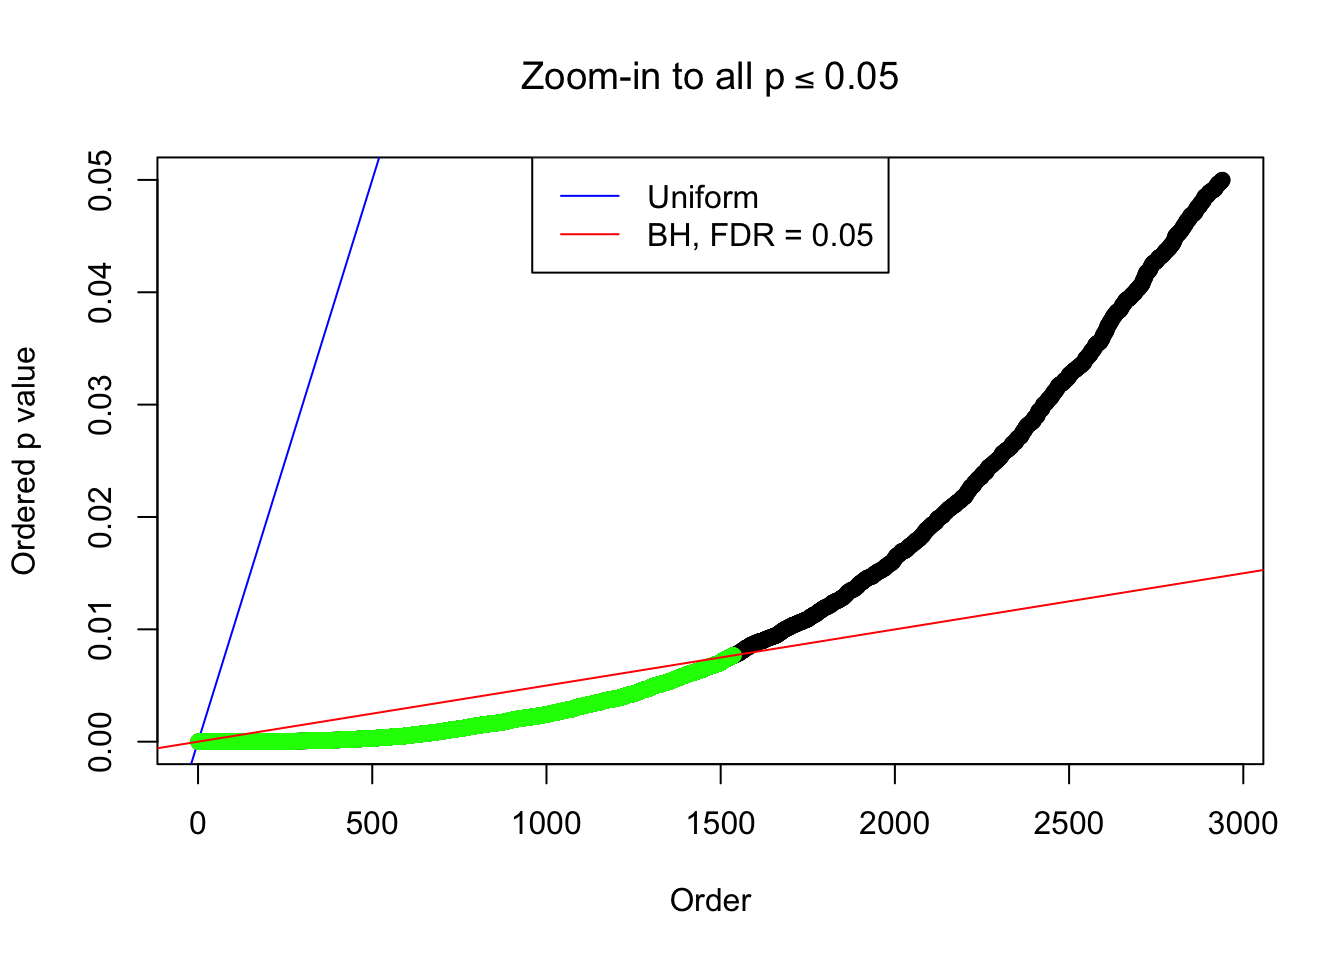
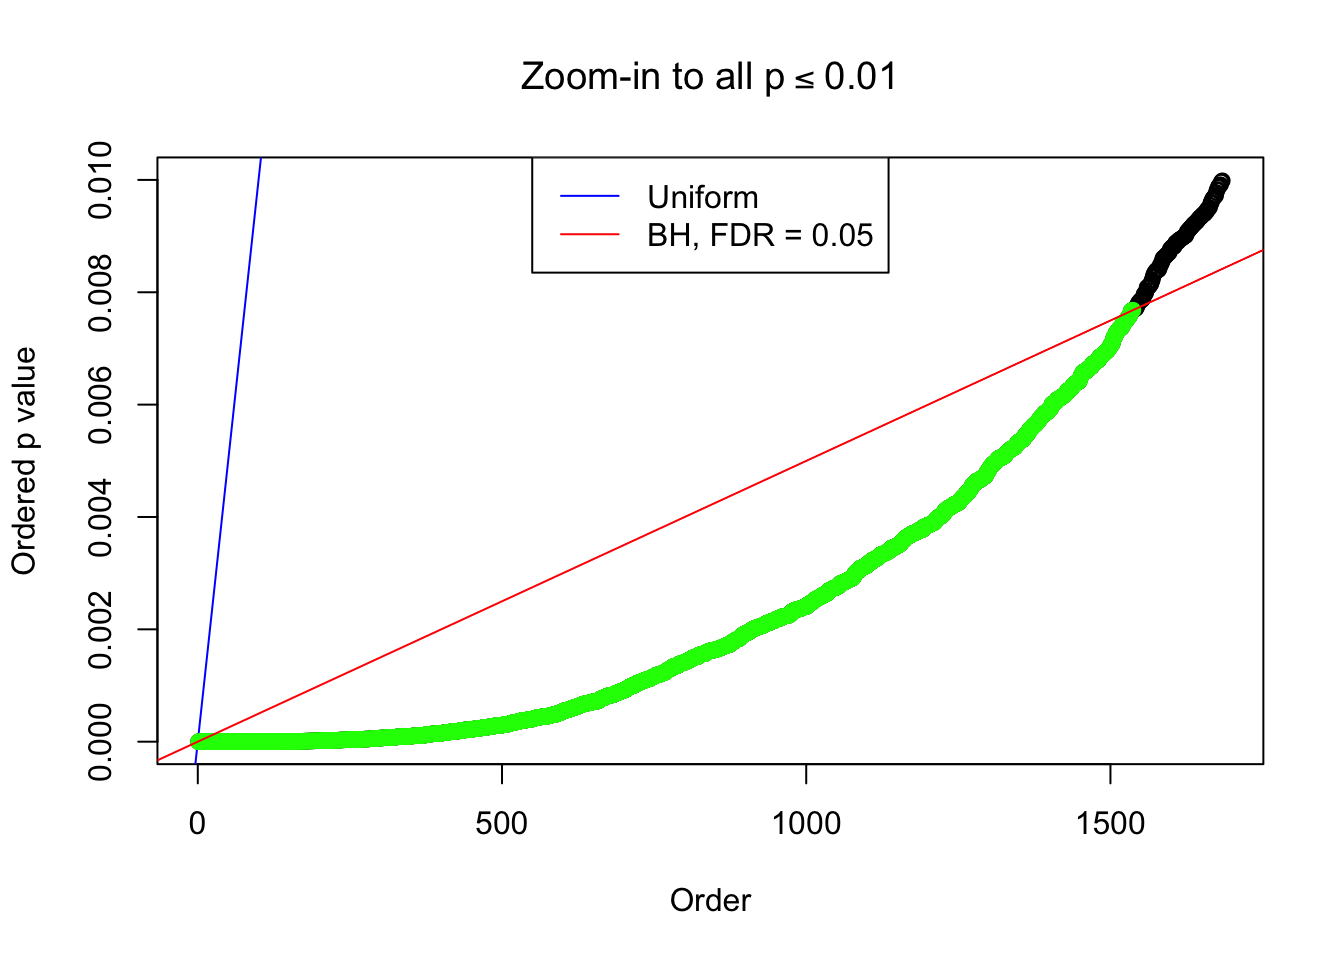
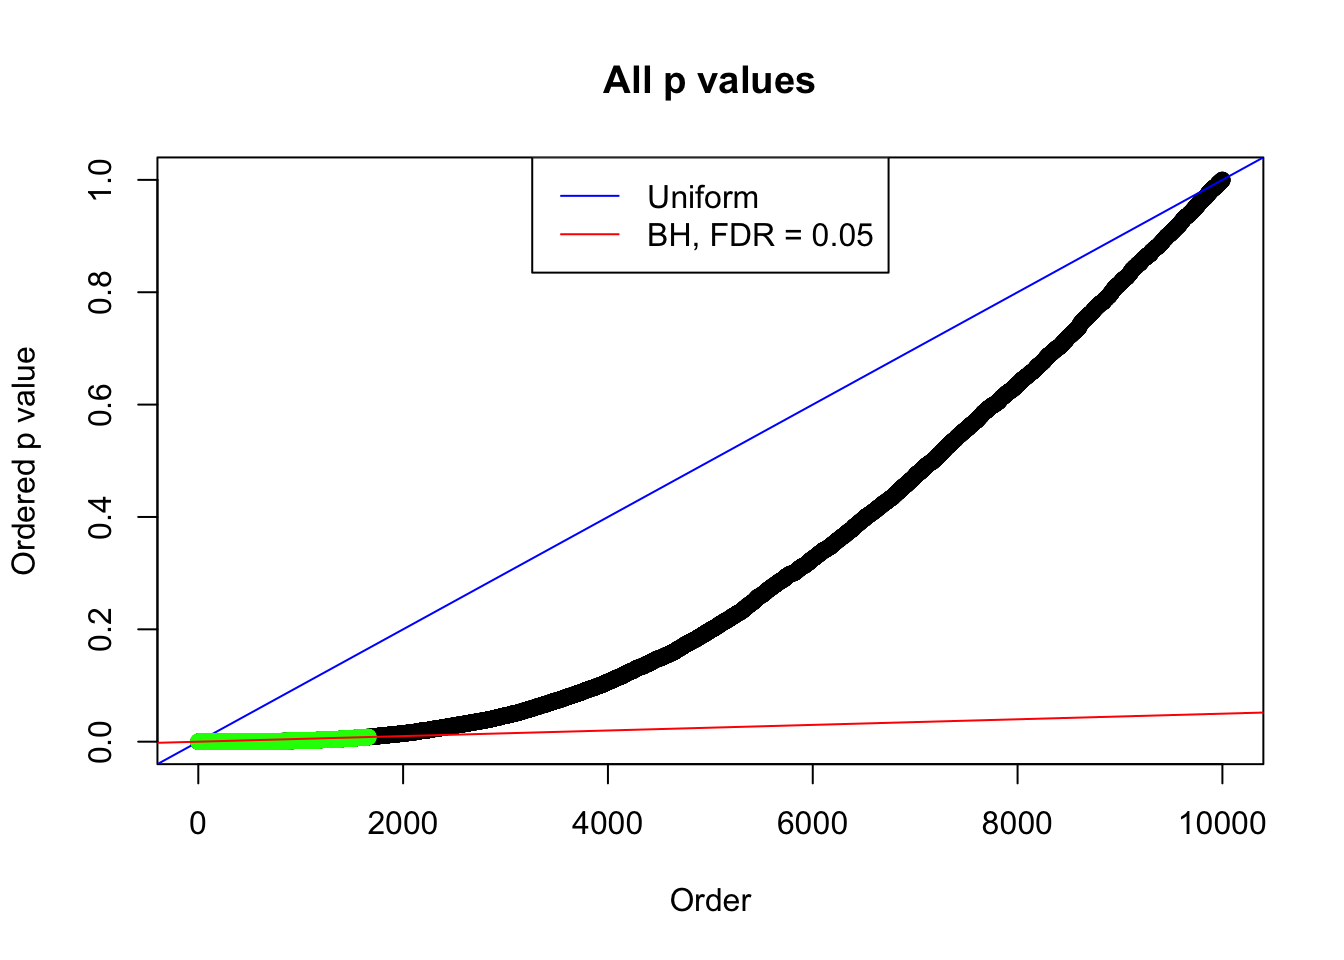
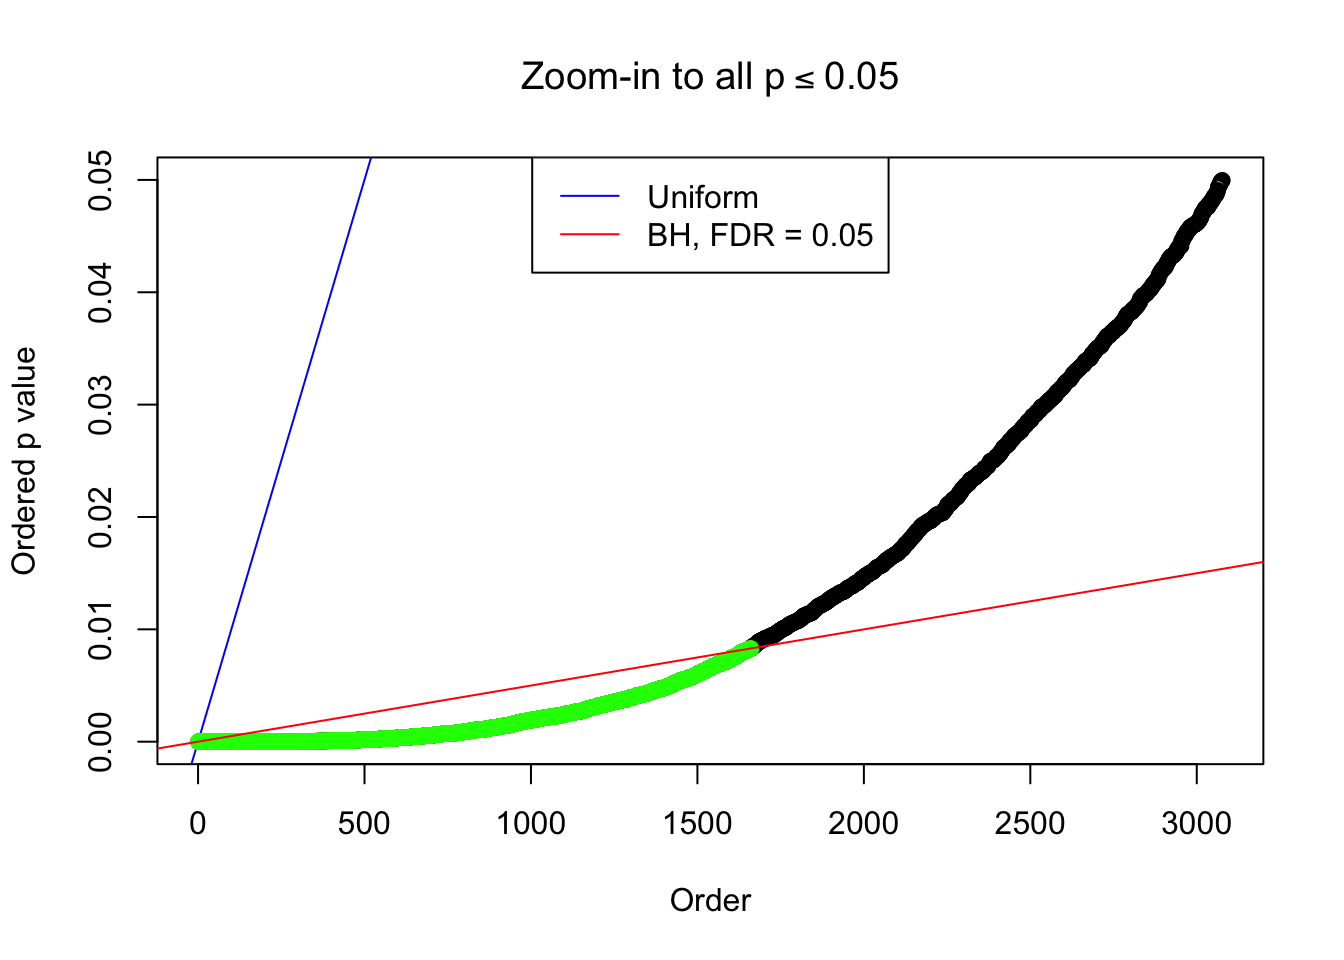
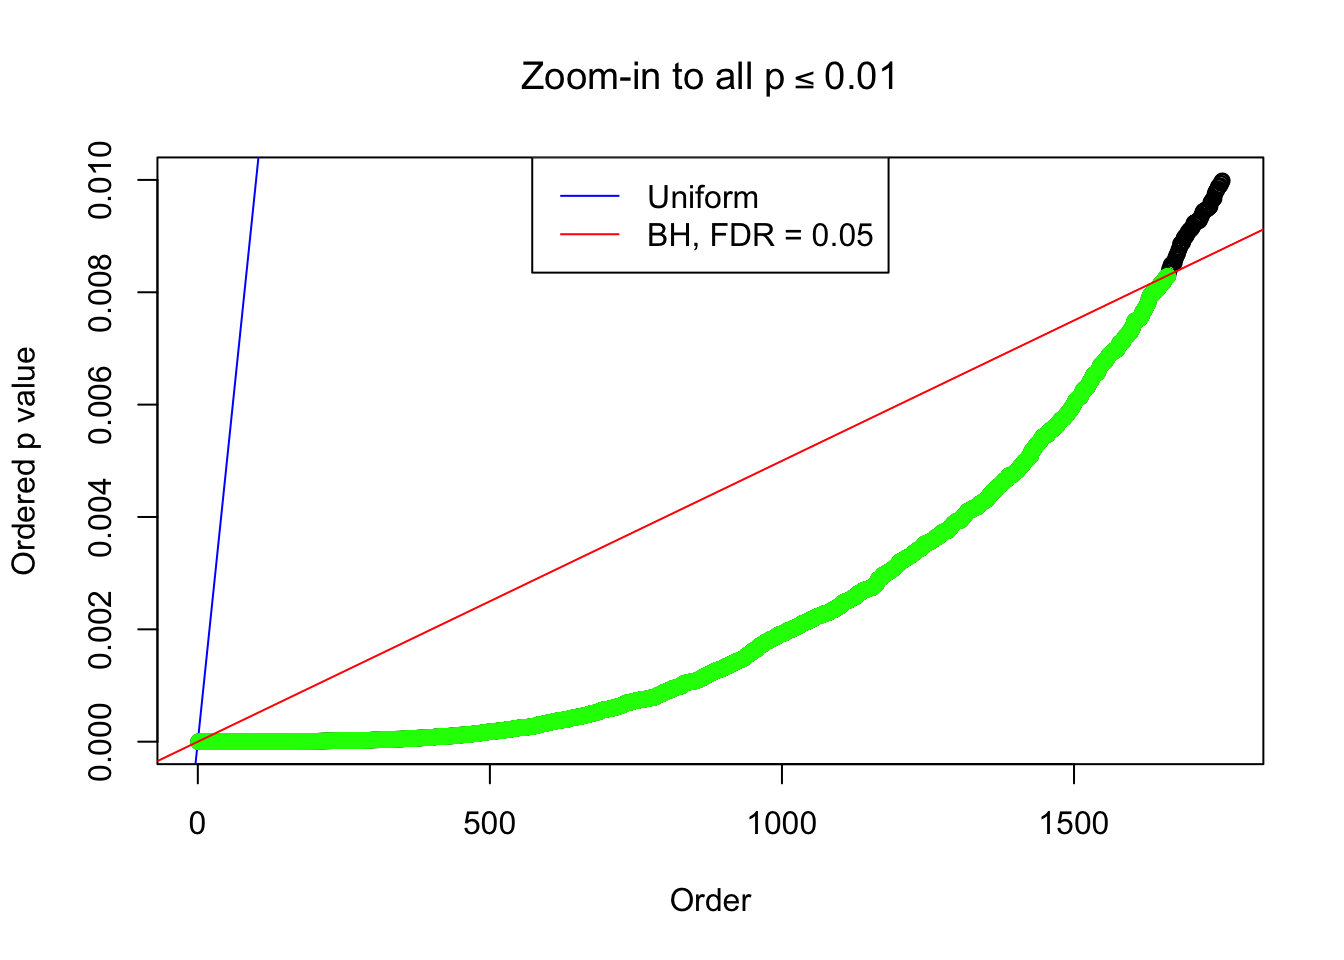
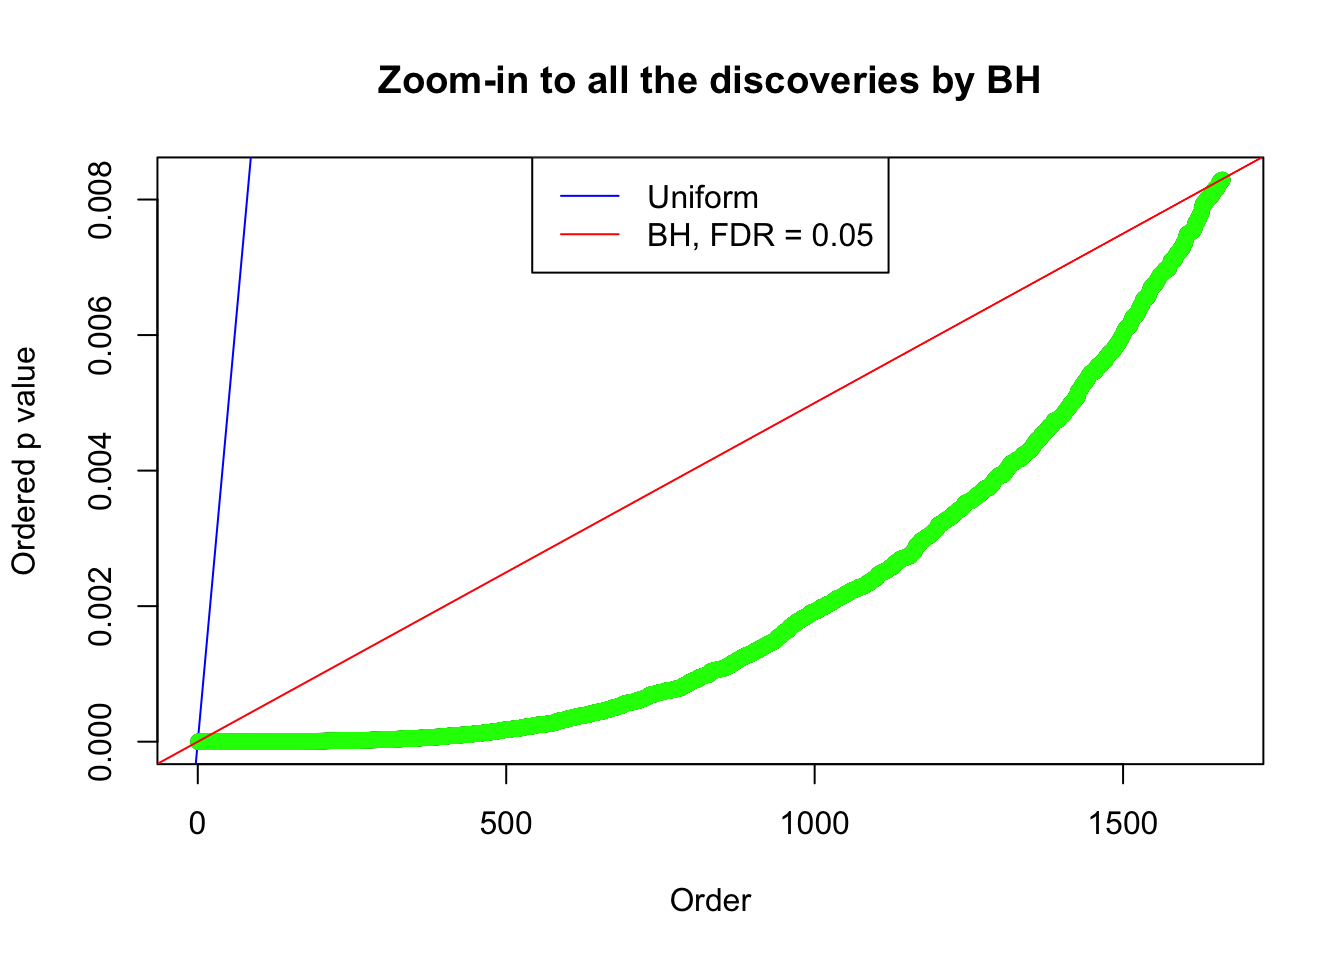
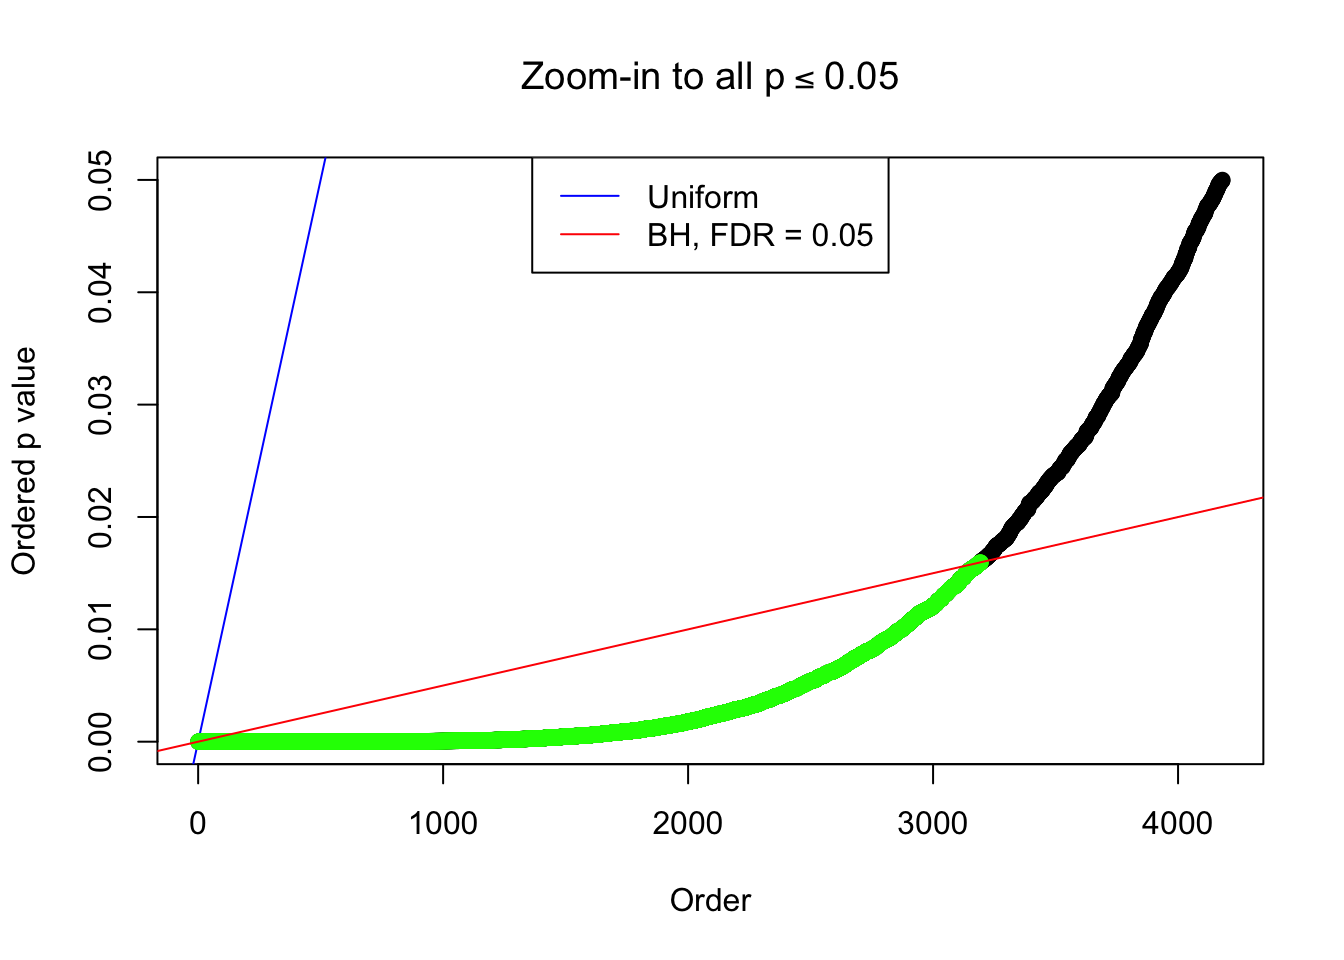
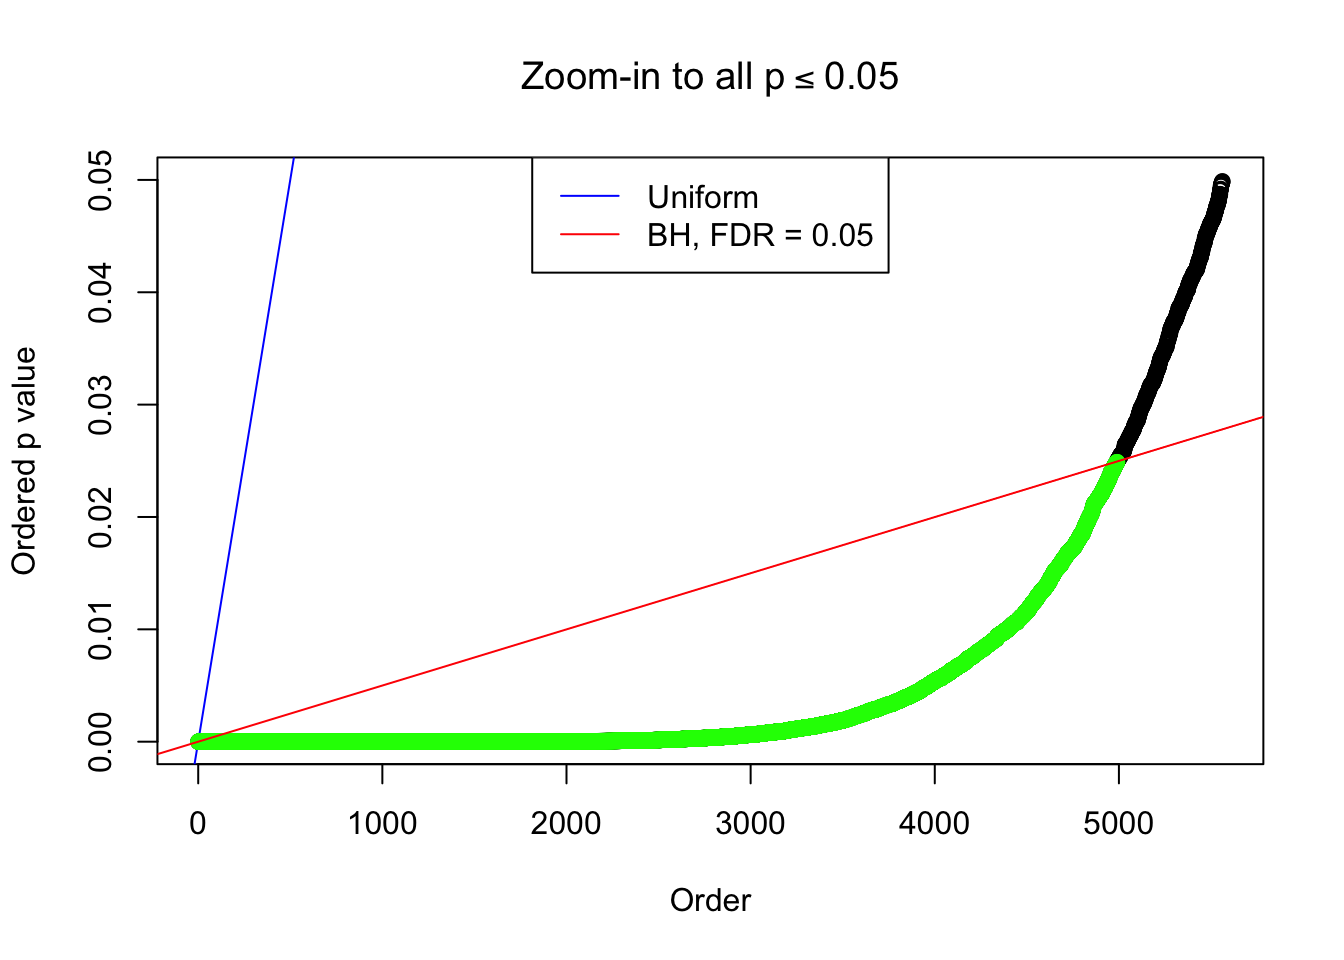
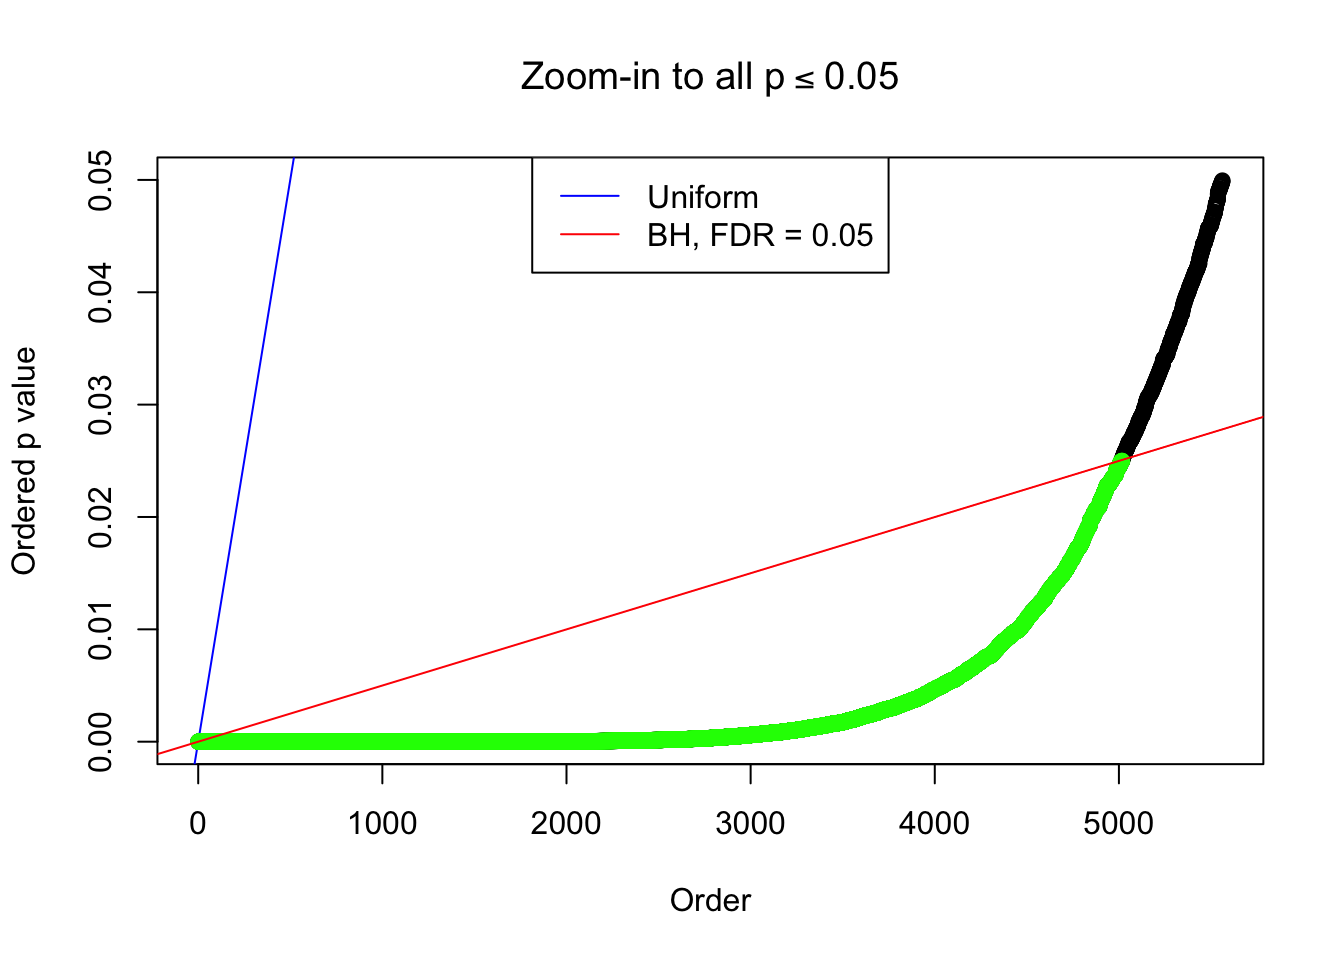
bh.fd = sum(p.adjust(p, method = "BH") <= 0.05)
pihat0.ash = get_pi0(ash(z, 1, method = "fdr"))
ecdfz.fit = ecdfz.optimal(z, firstk = TRUE)
res[[SNR]][[i]] = list(z.sd = z.sd, z = z, p = p, bh.fd = bh.fd, pihat0.ash = pihat0.ash, ecdfz.fit = ecdfz.fit)
}
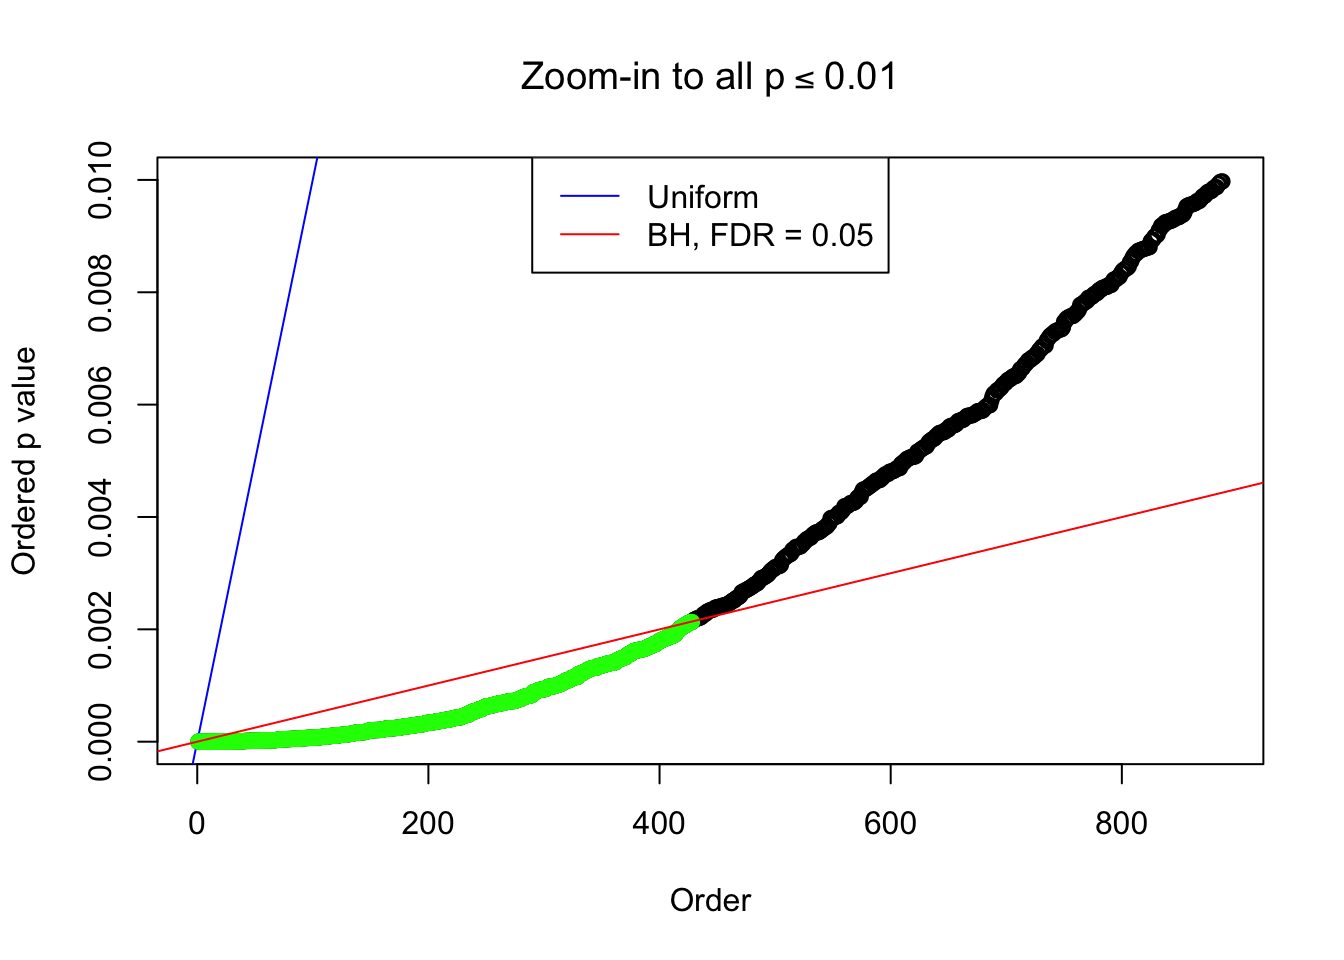
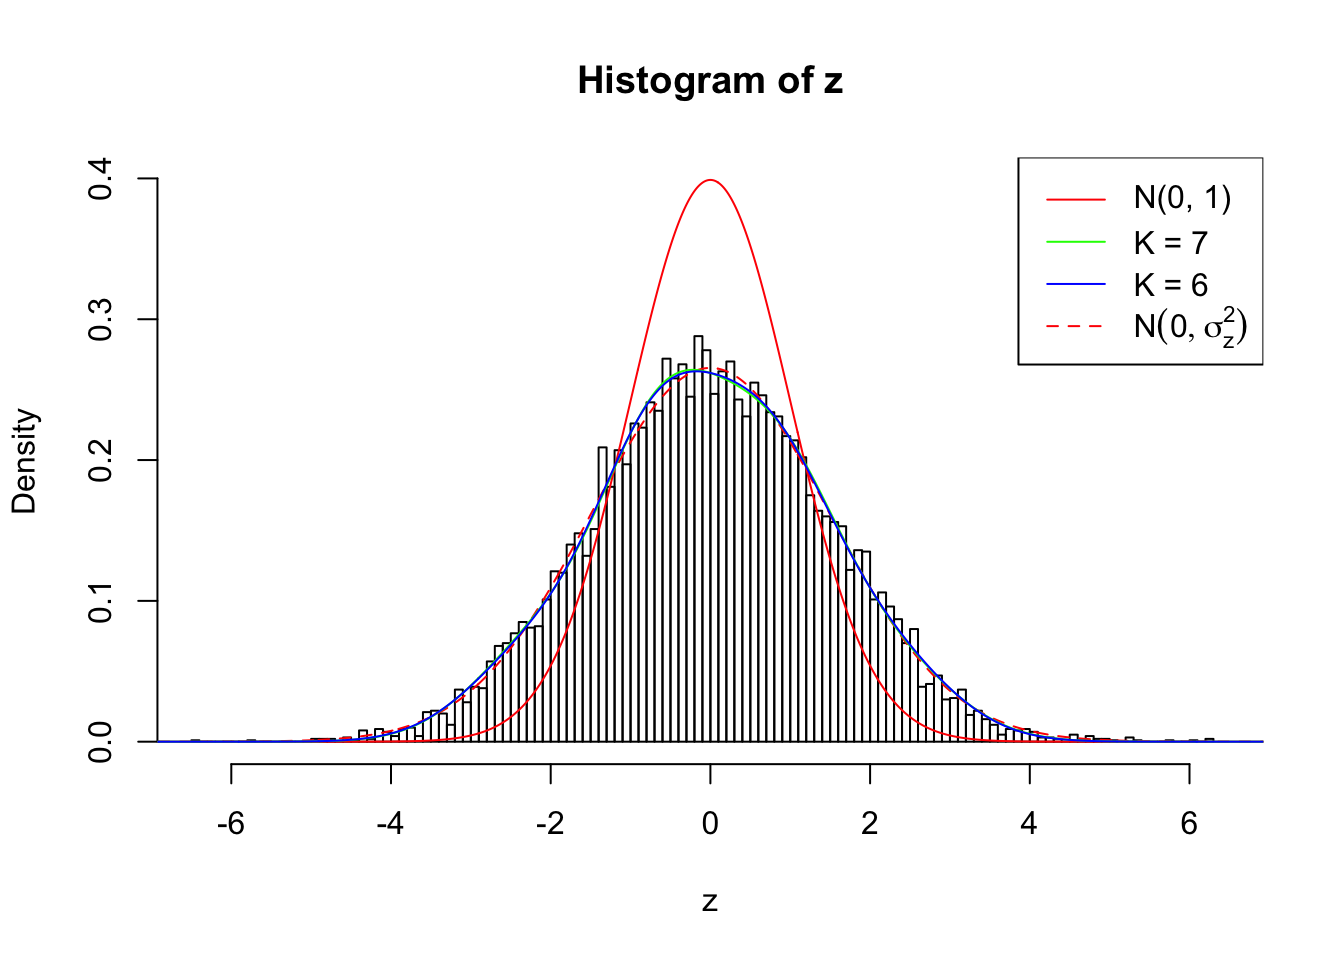
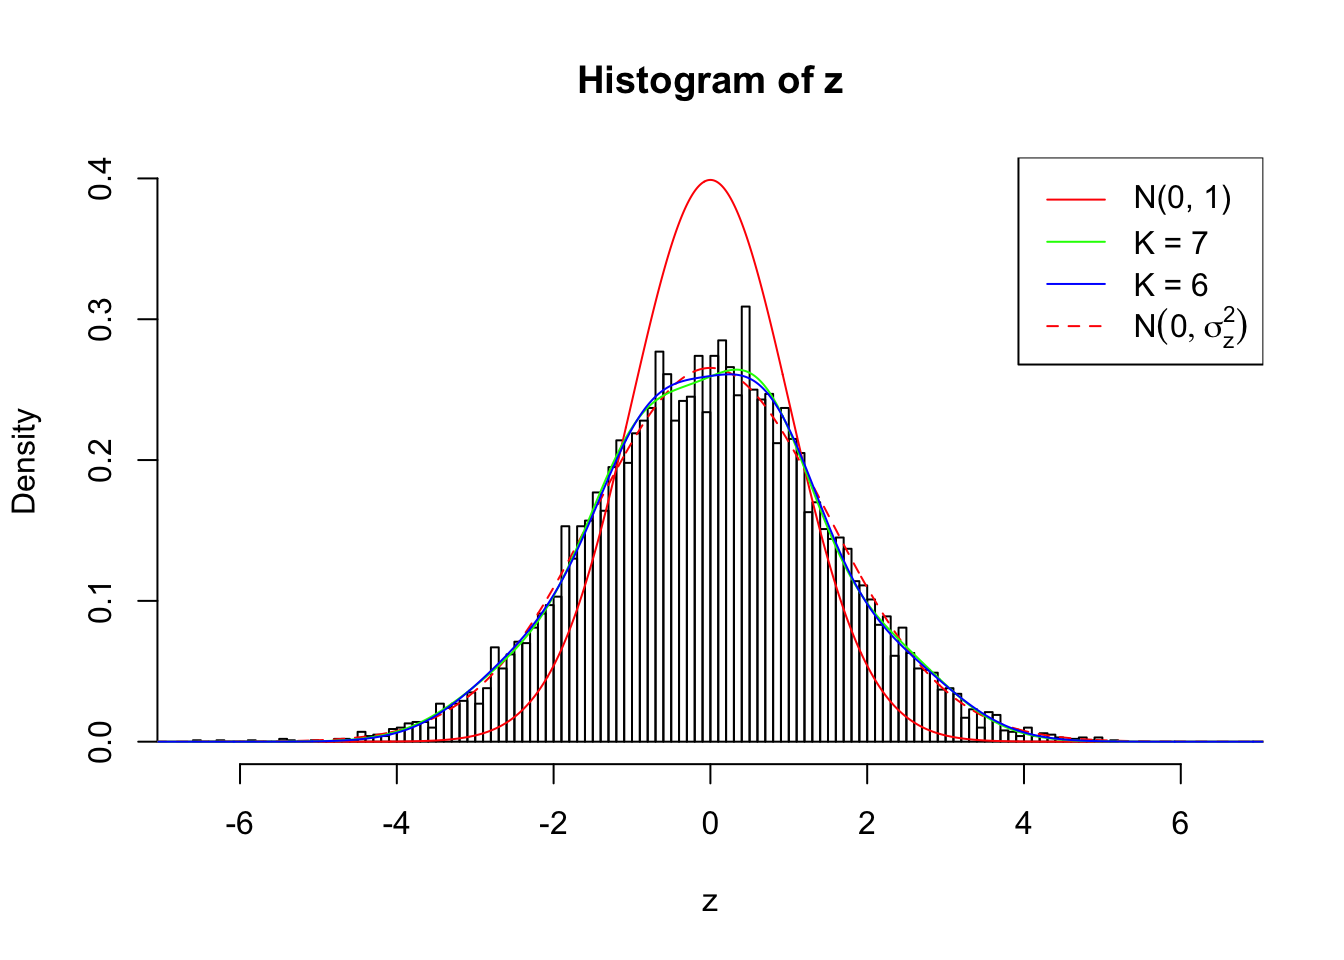
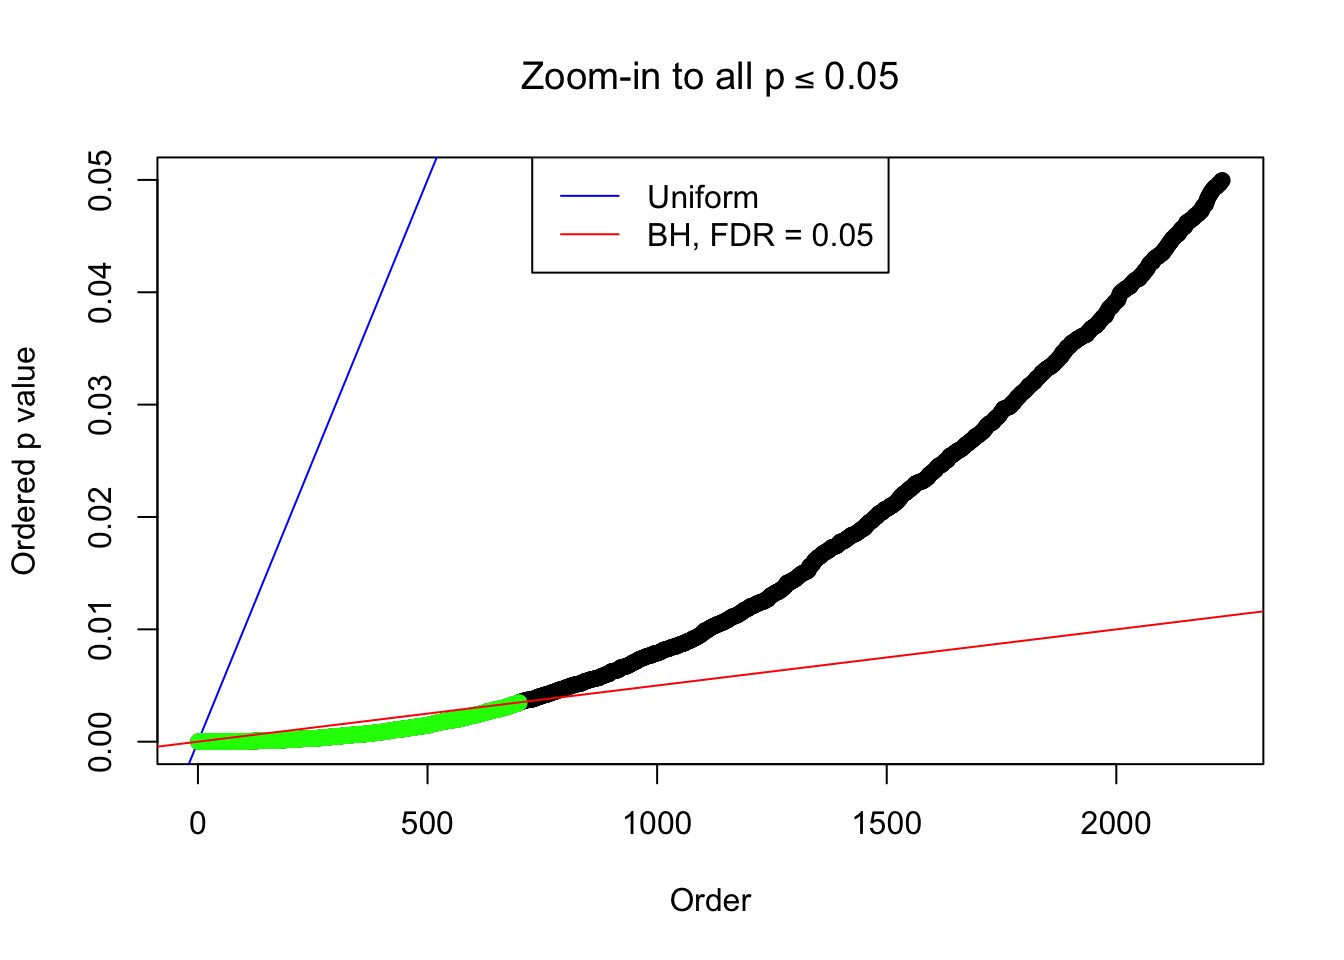
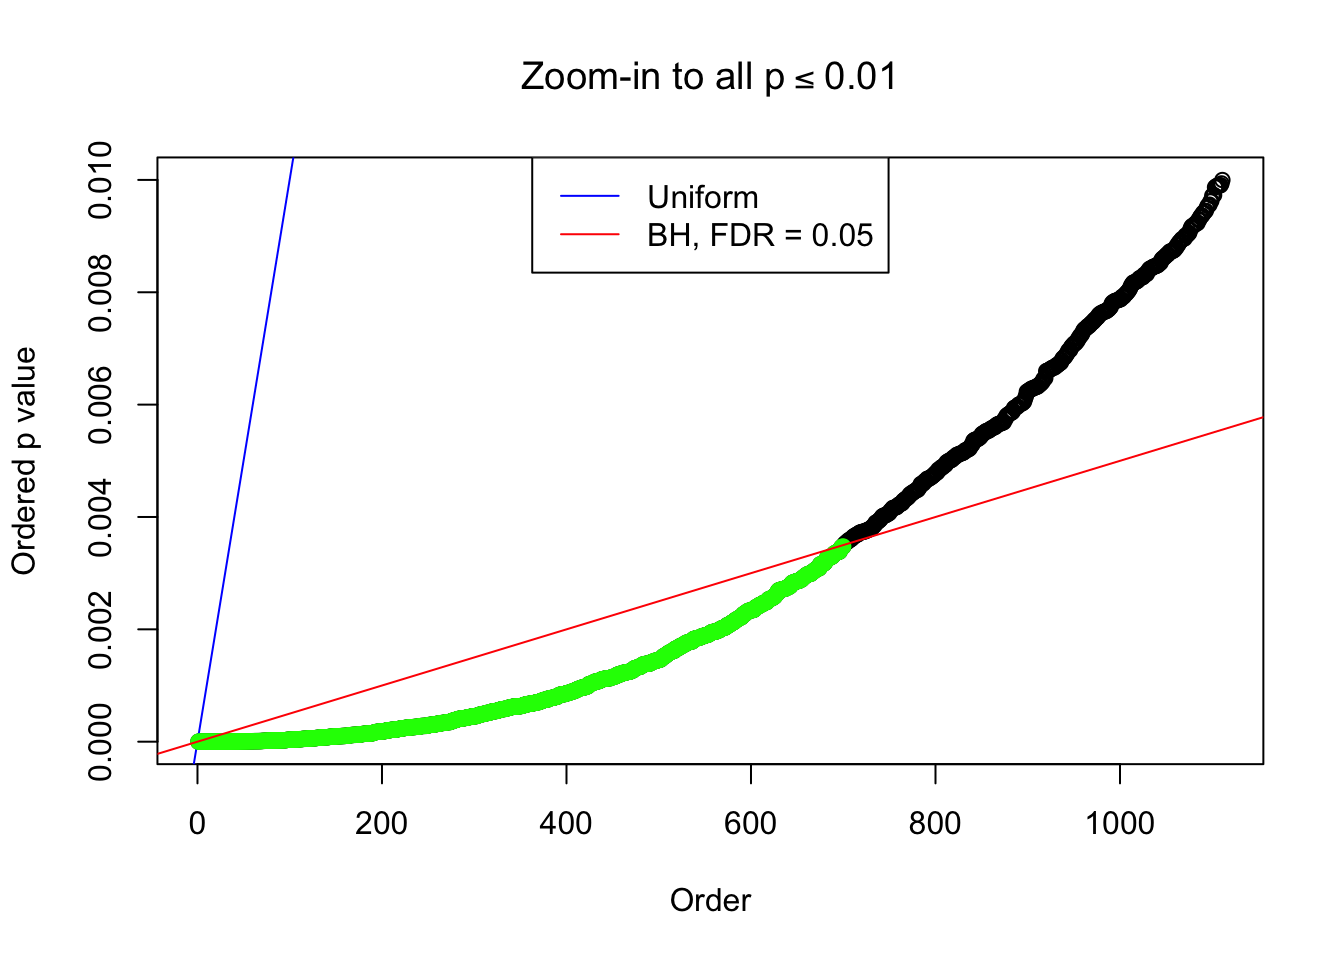
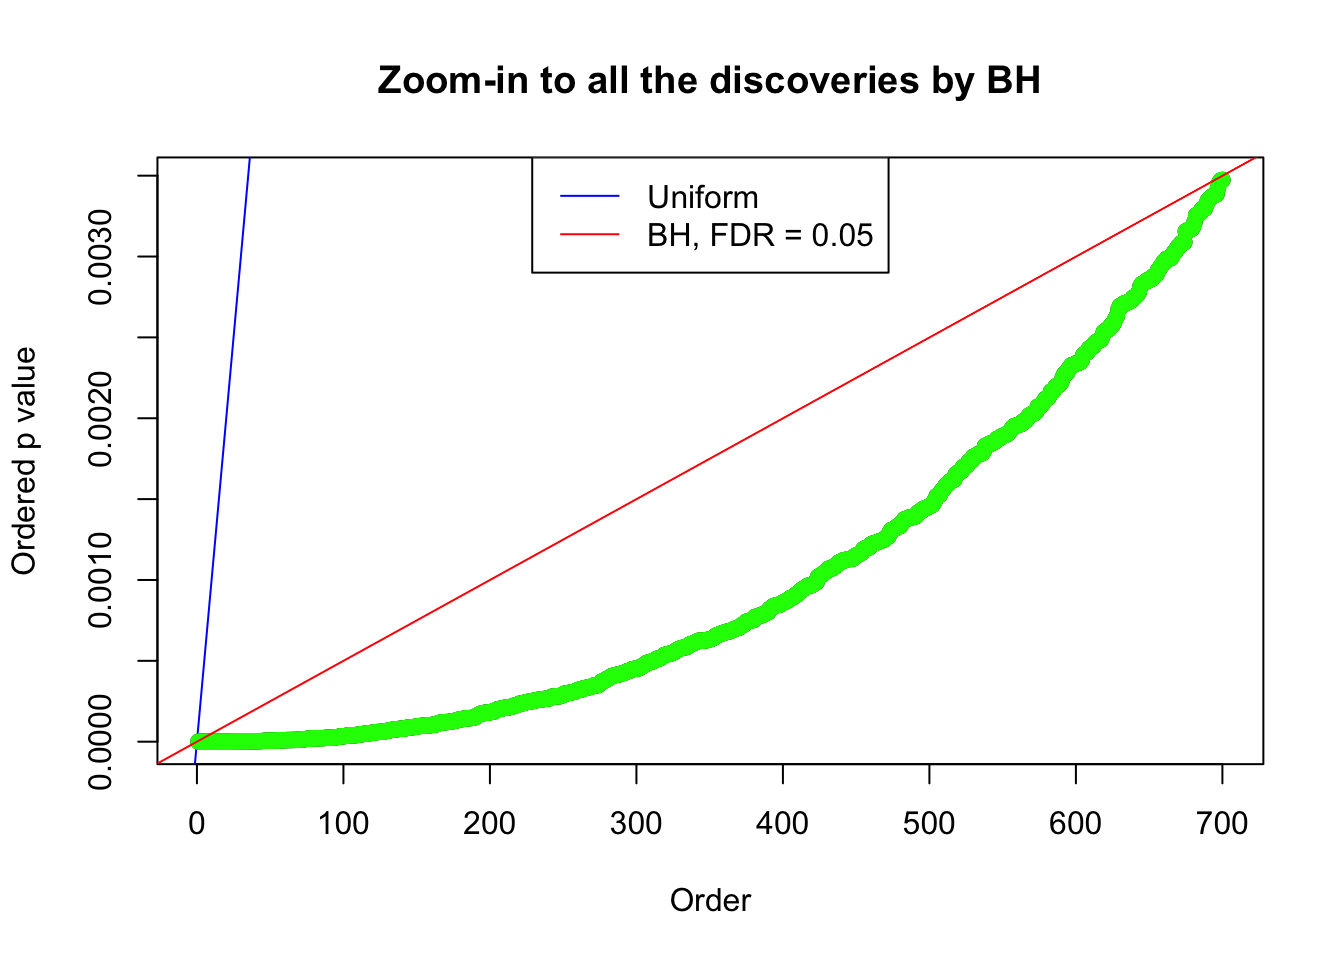
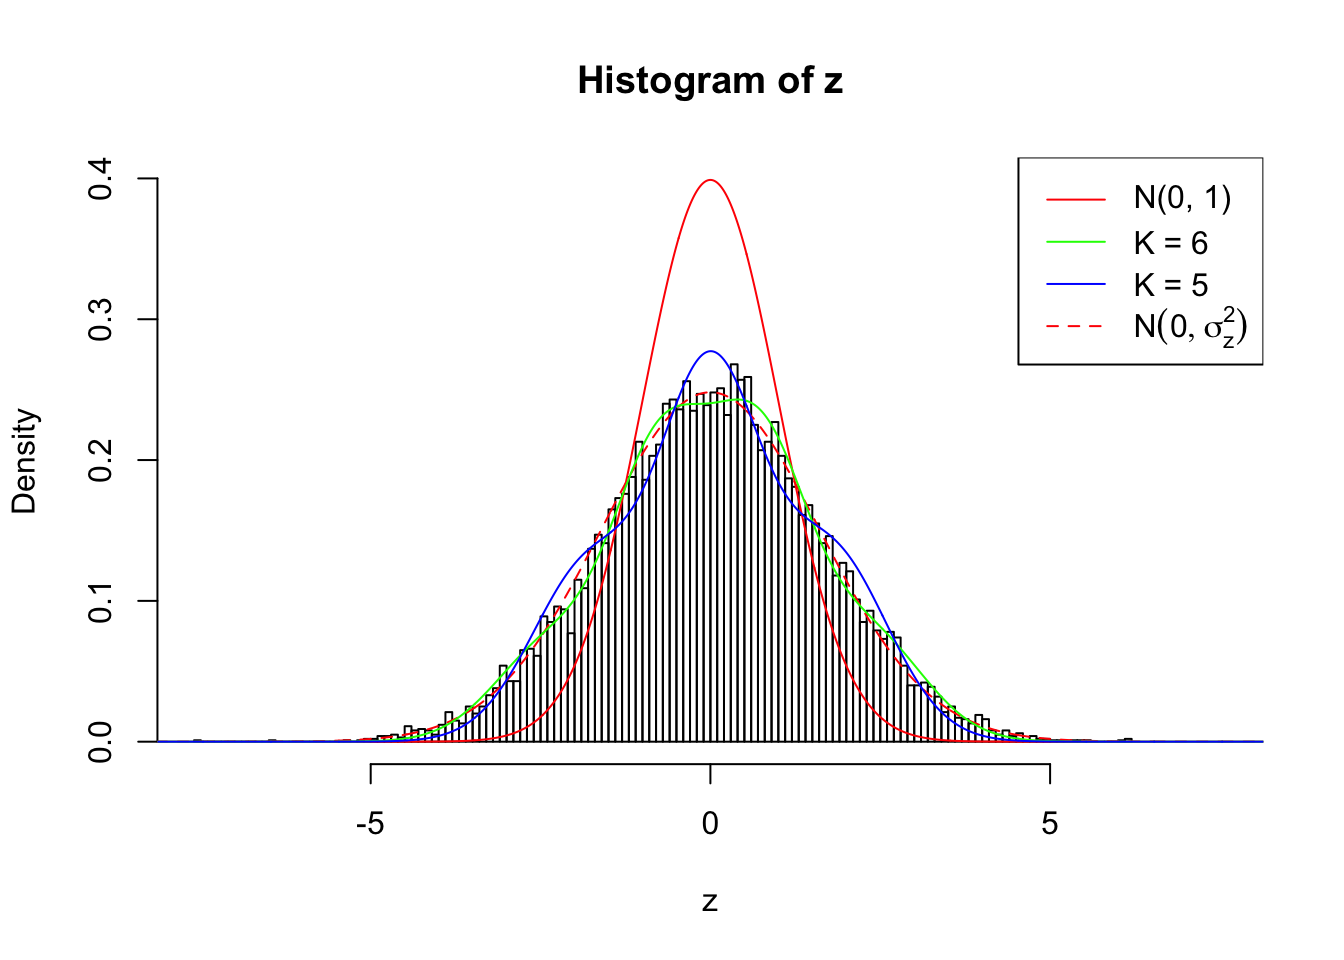
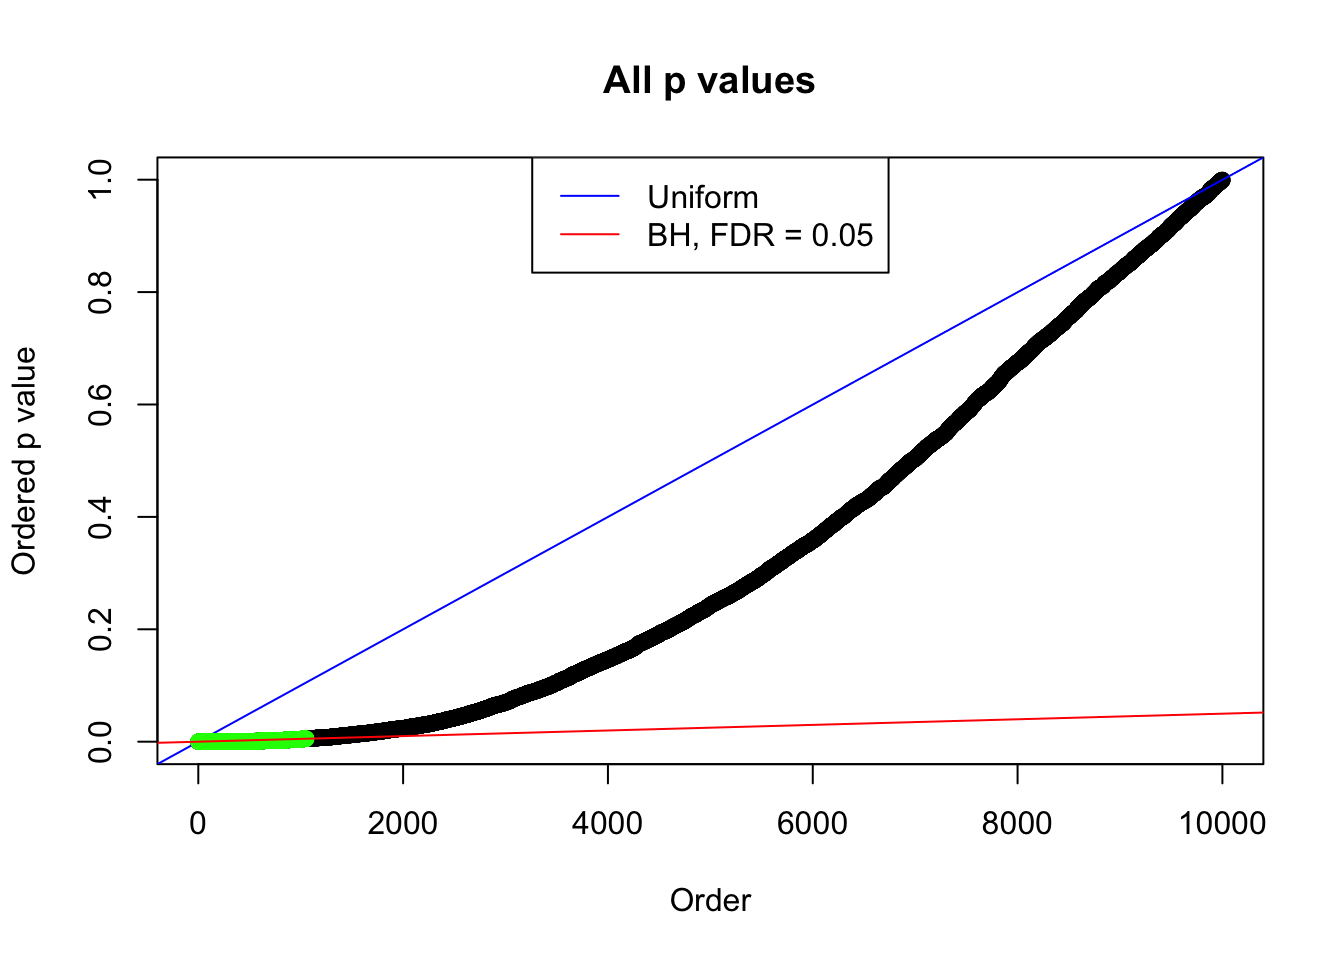
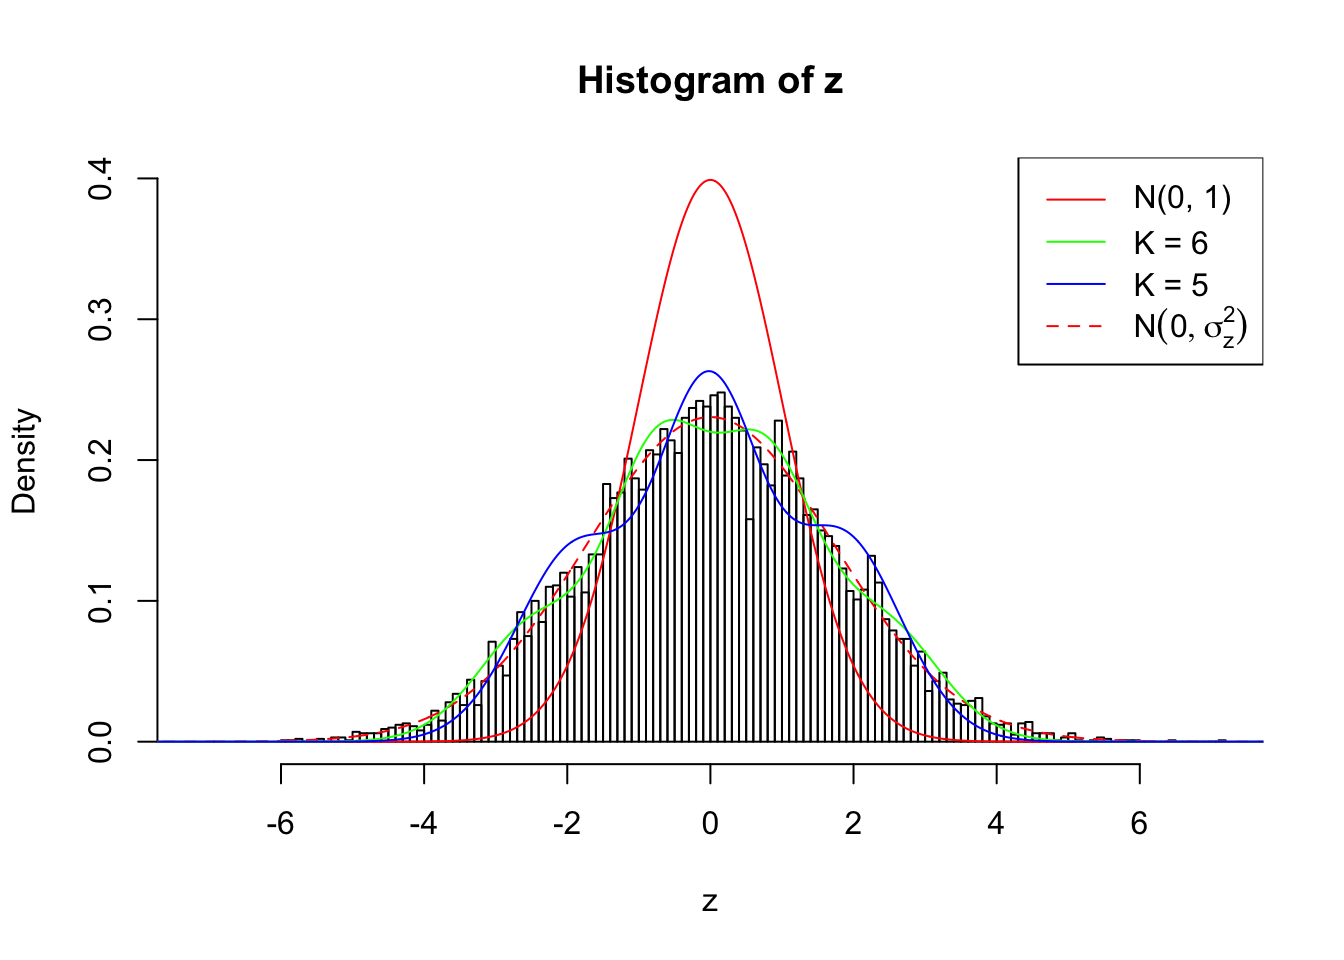
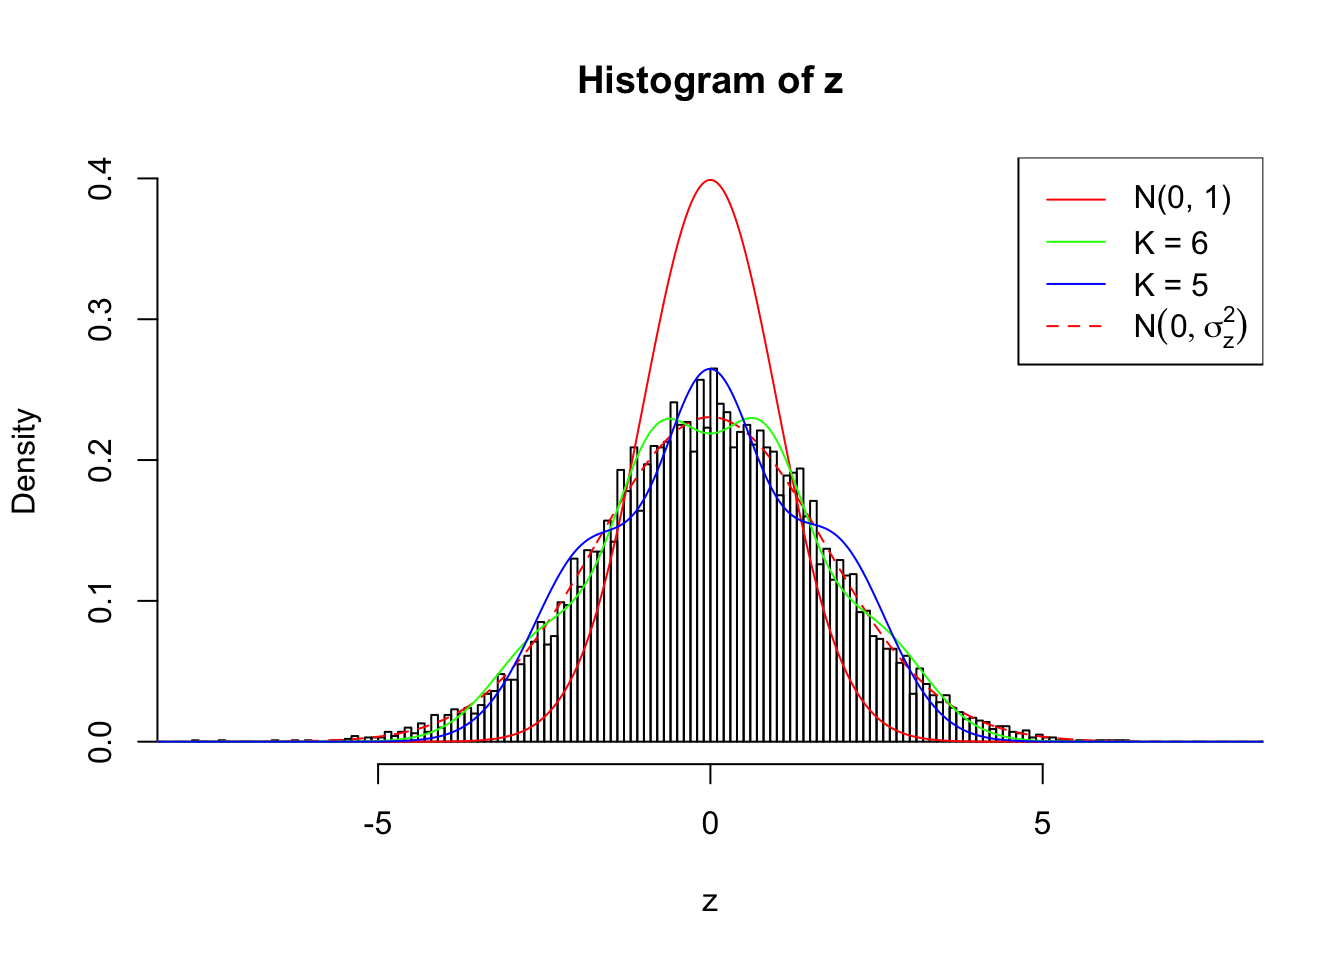
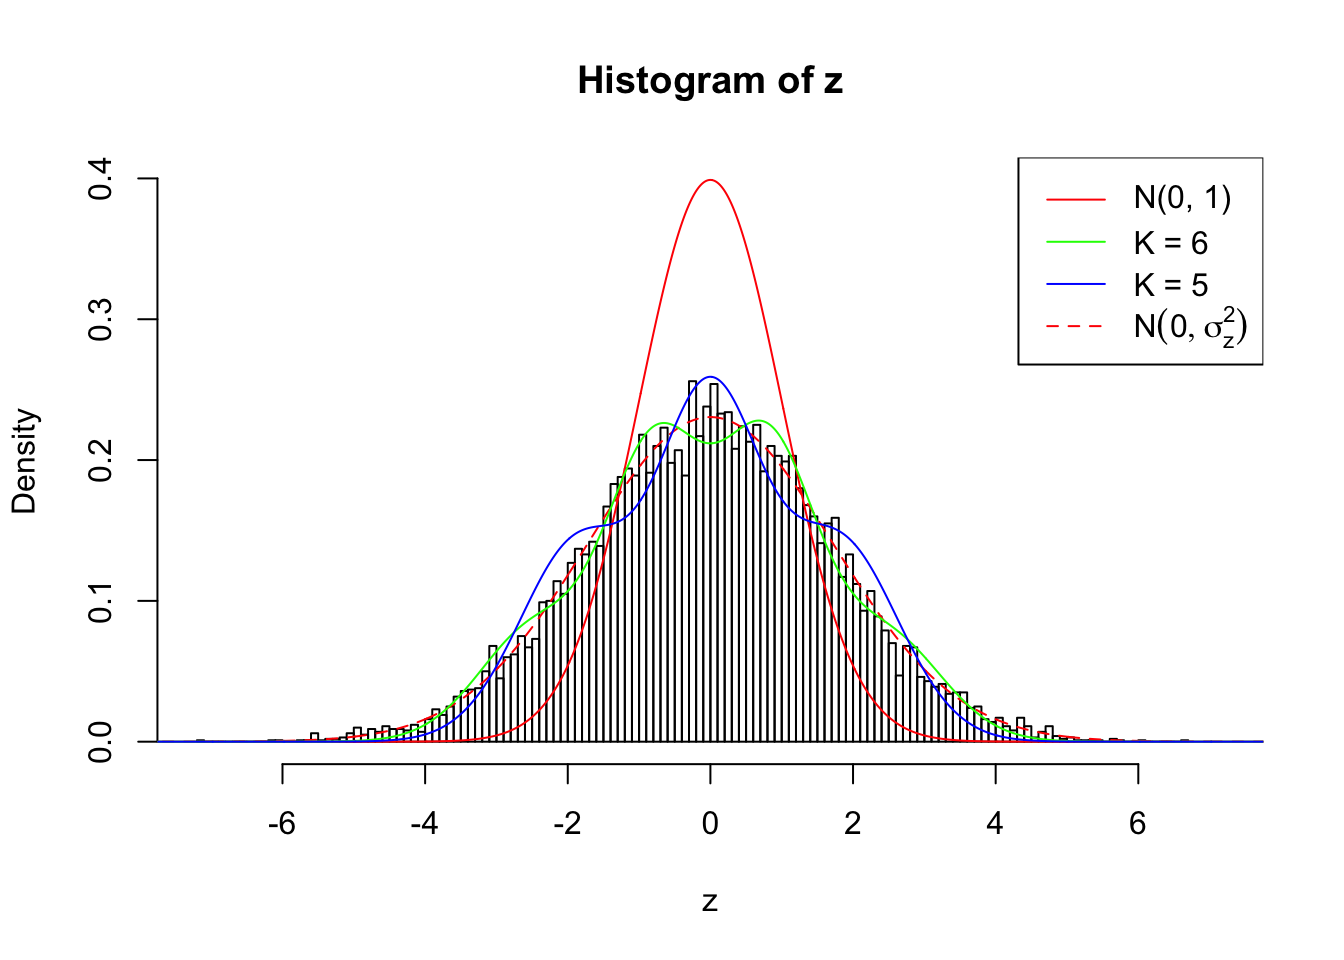
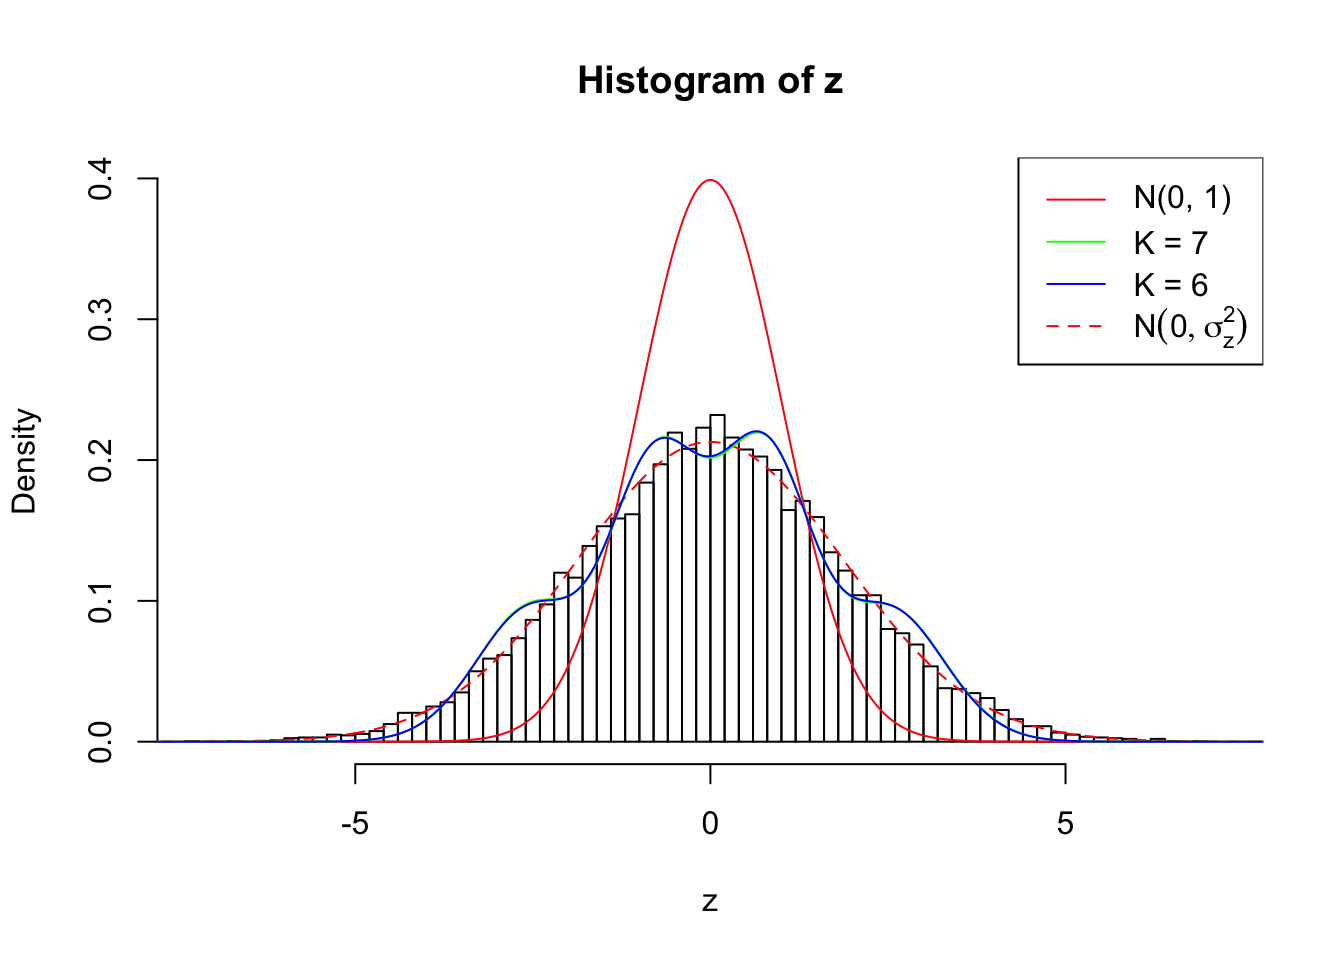
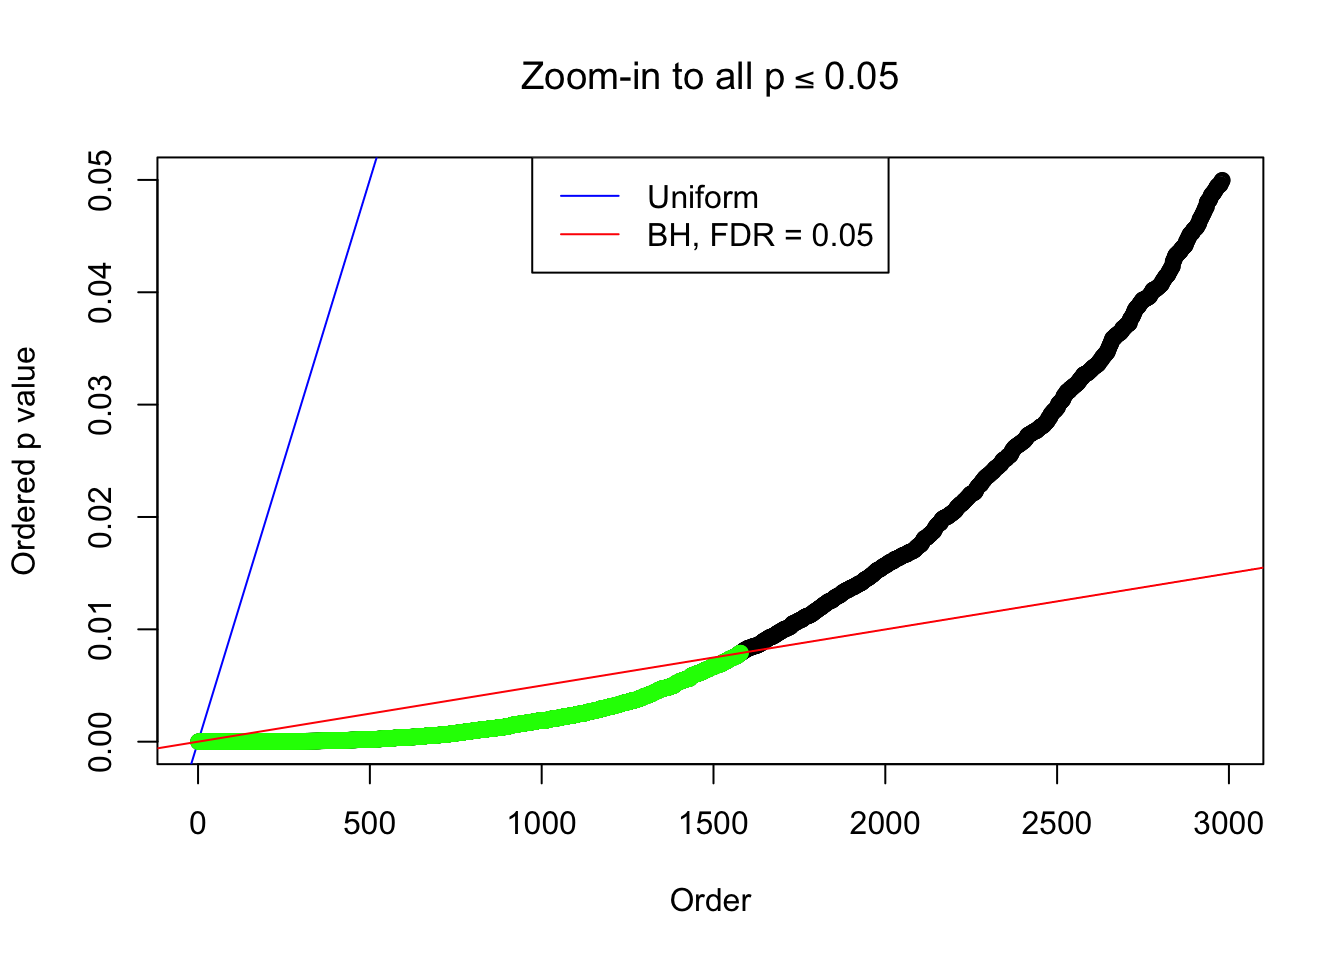
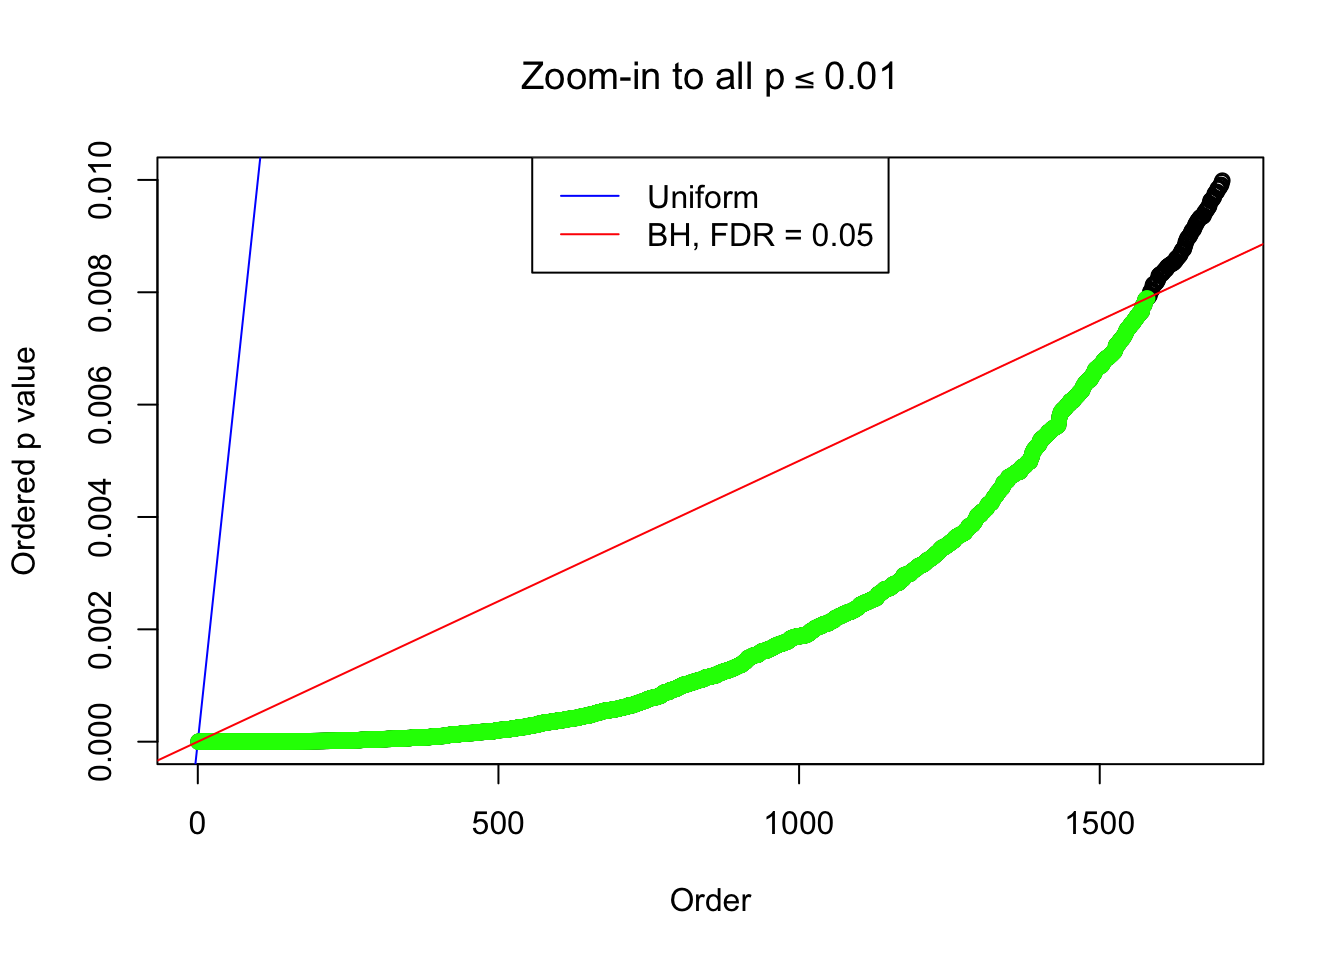
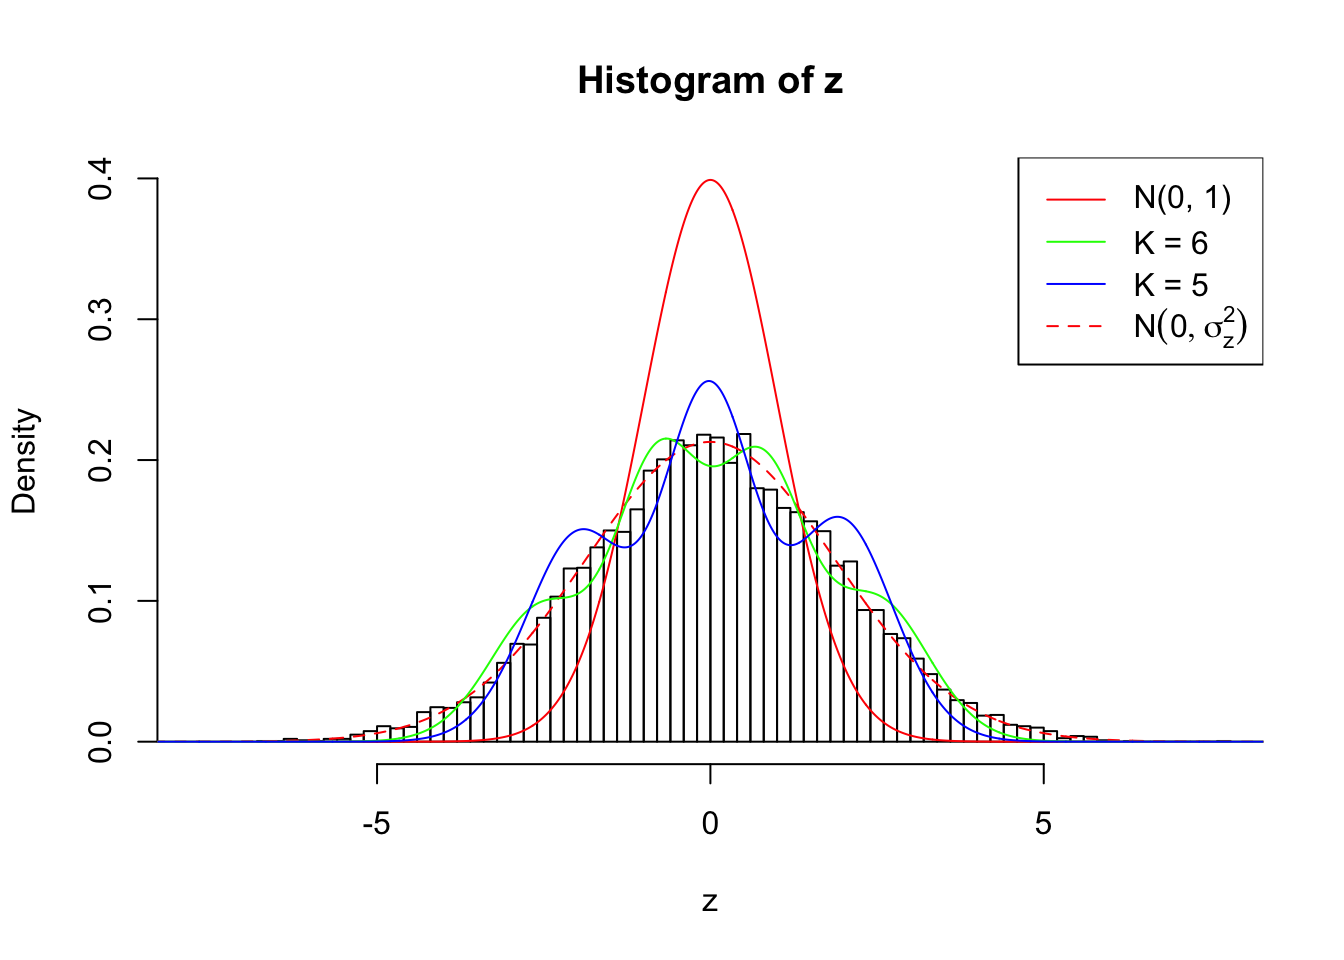
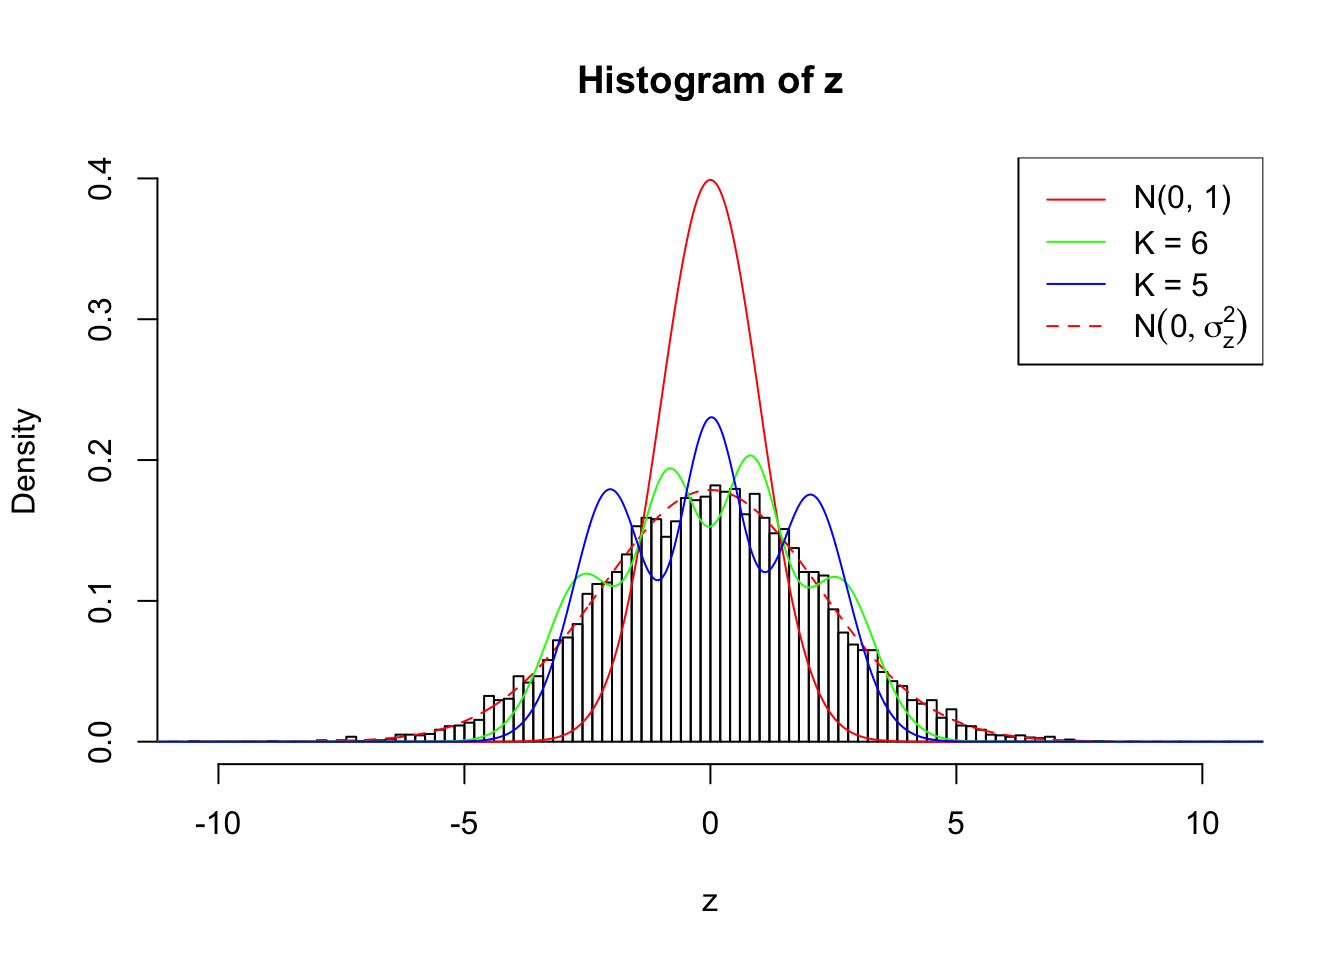
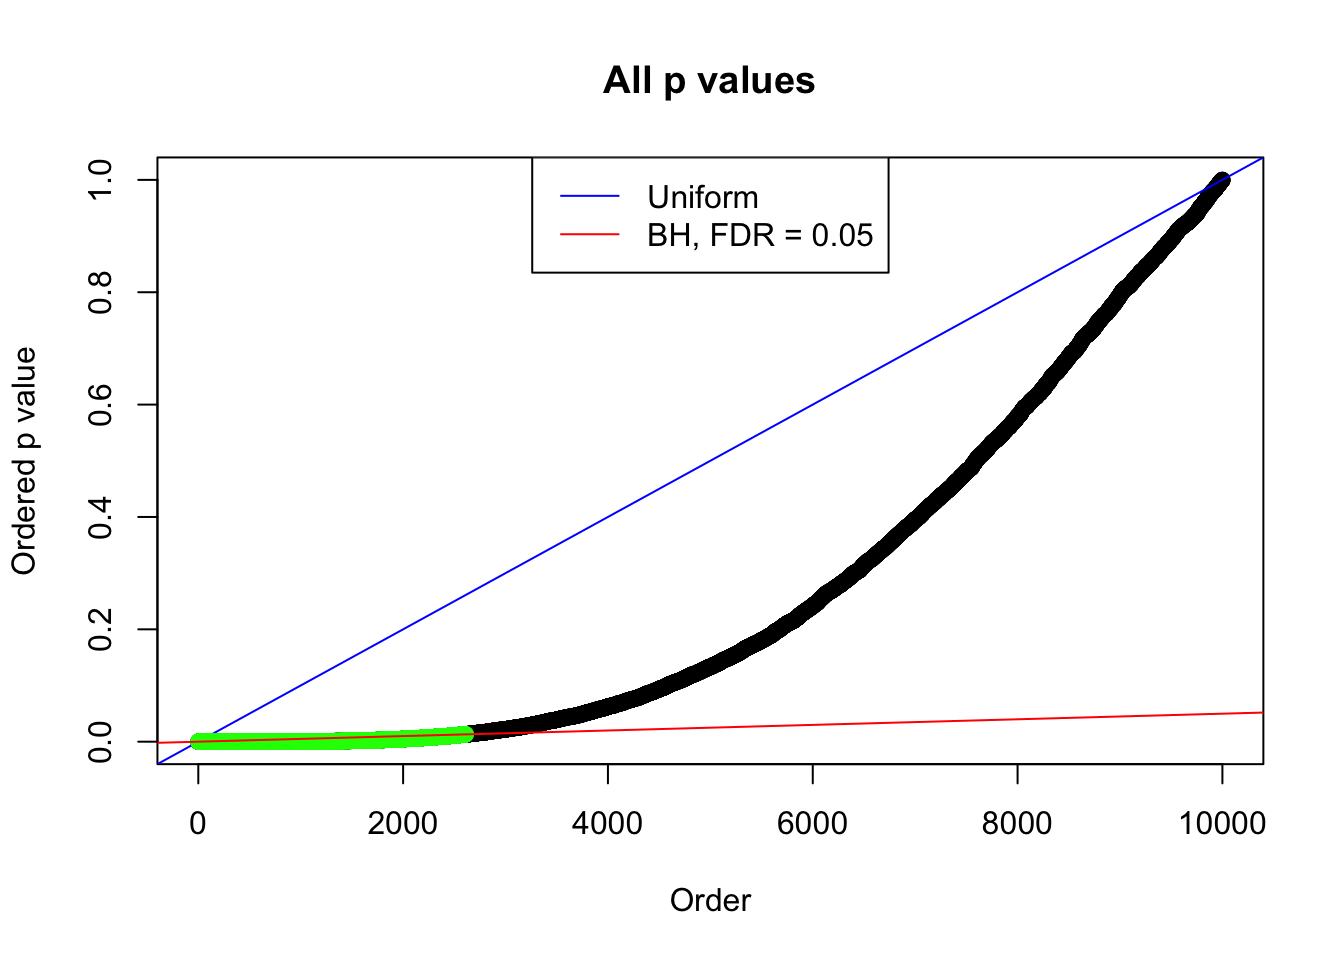
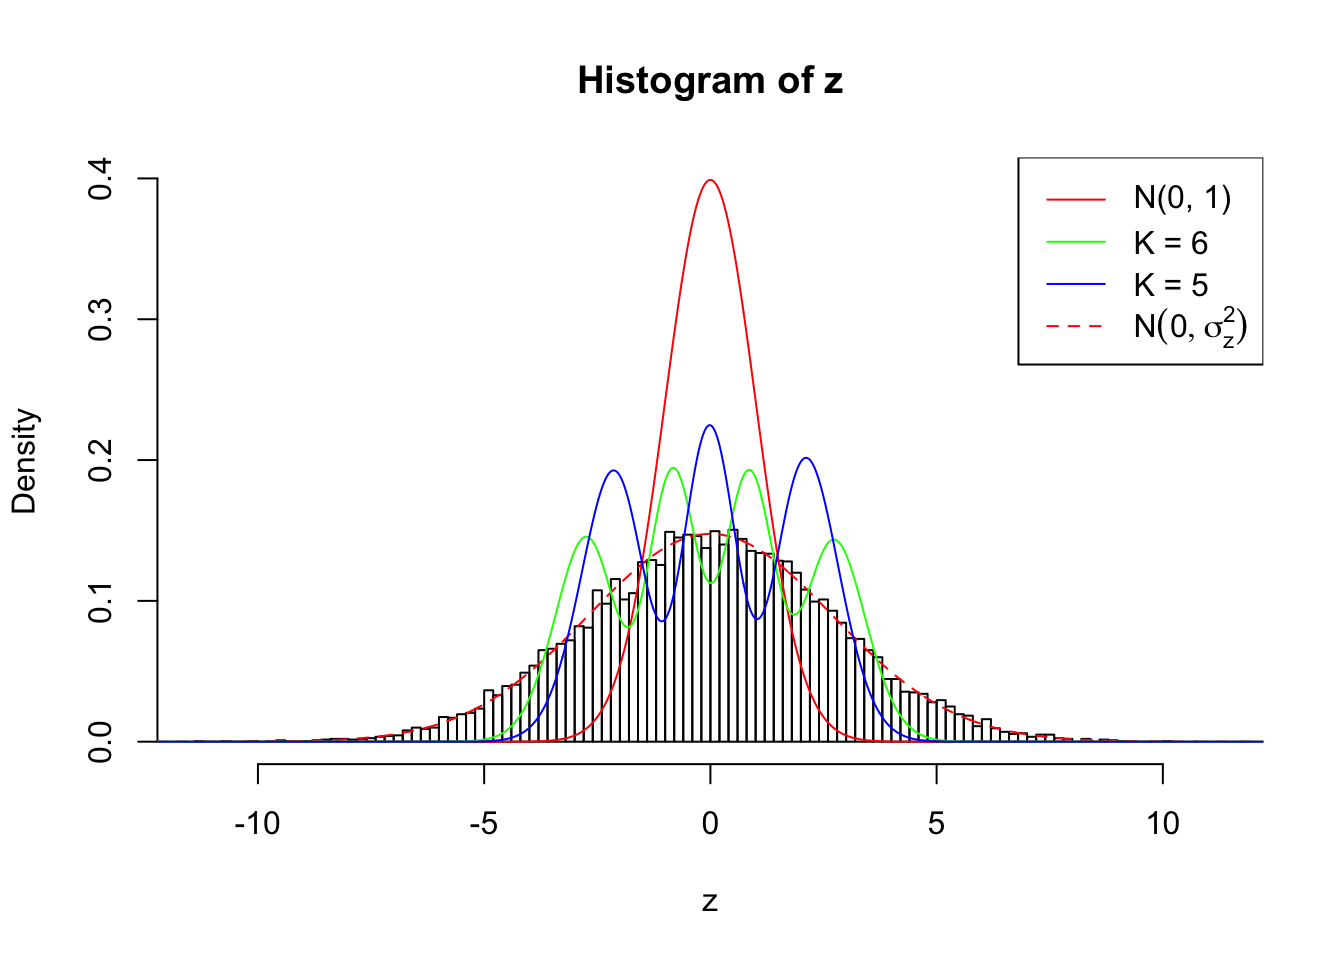
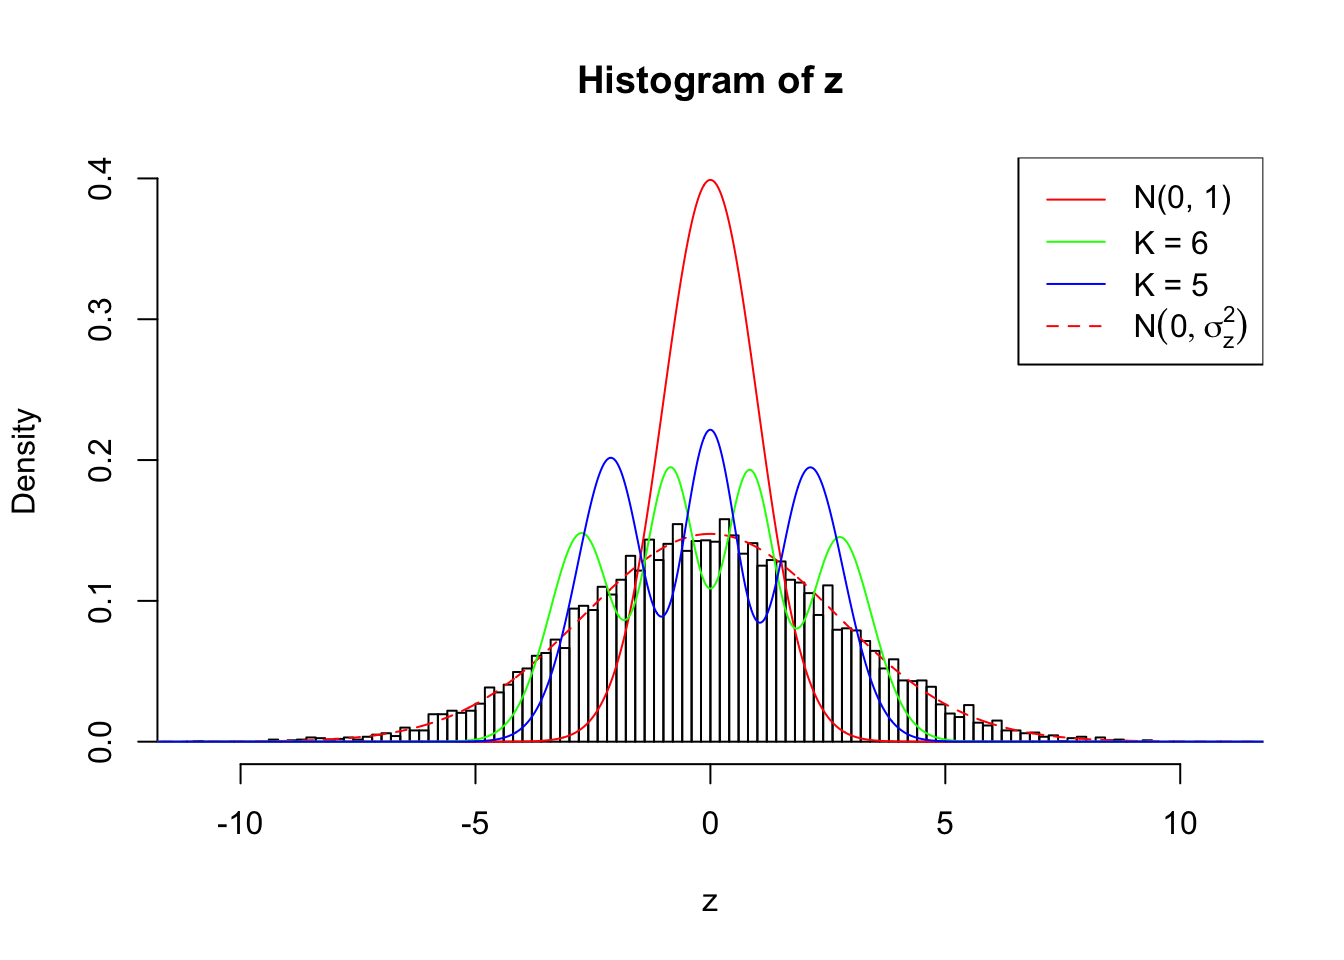
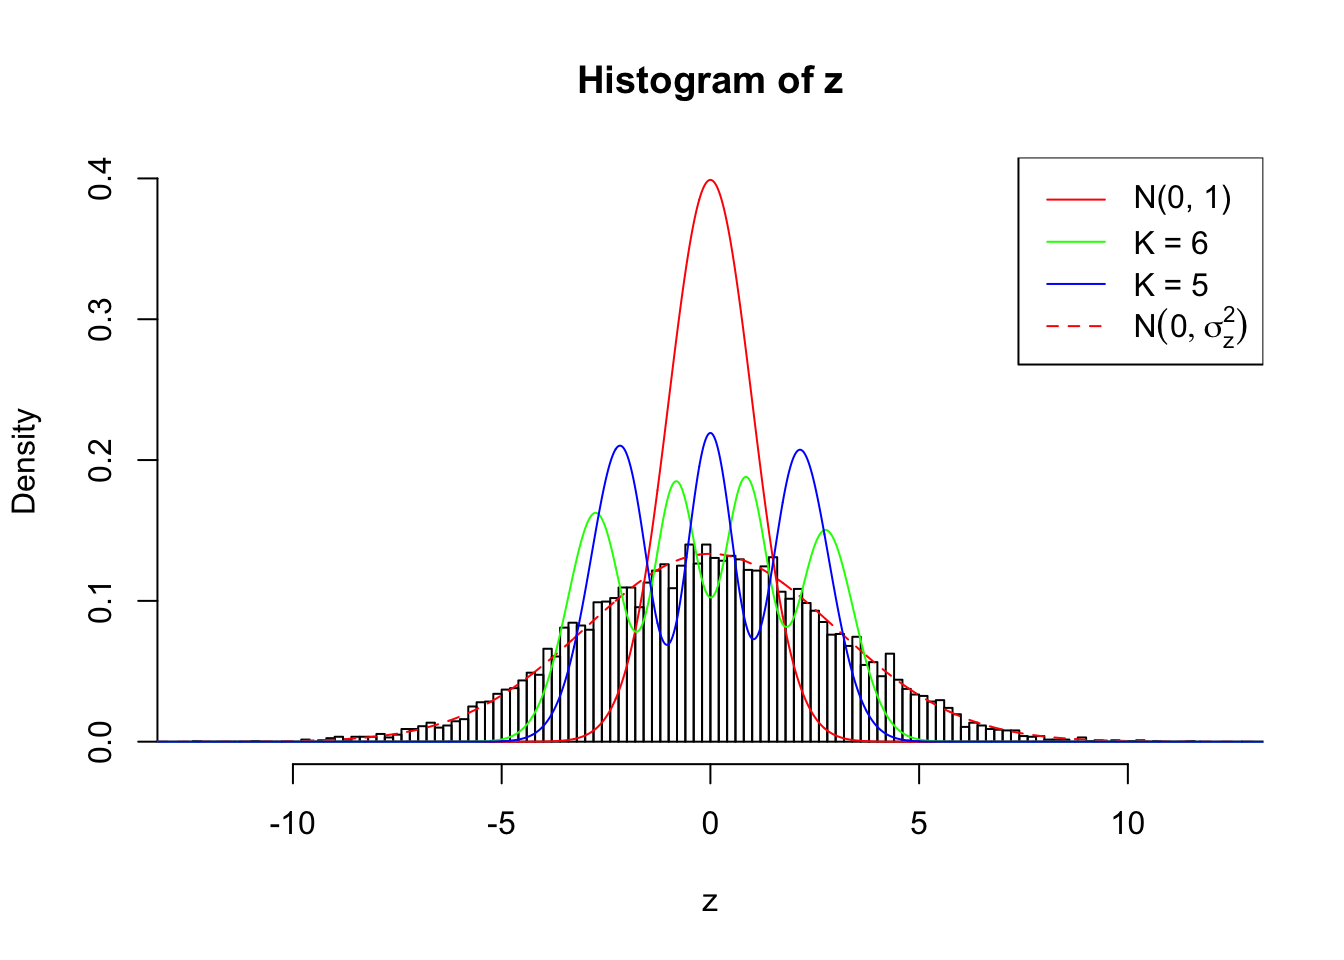
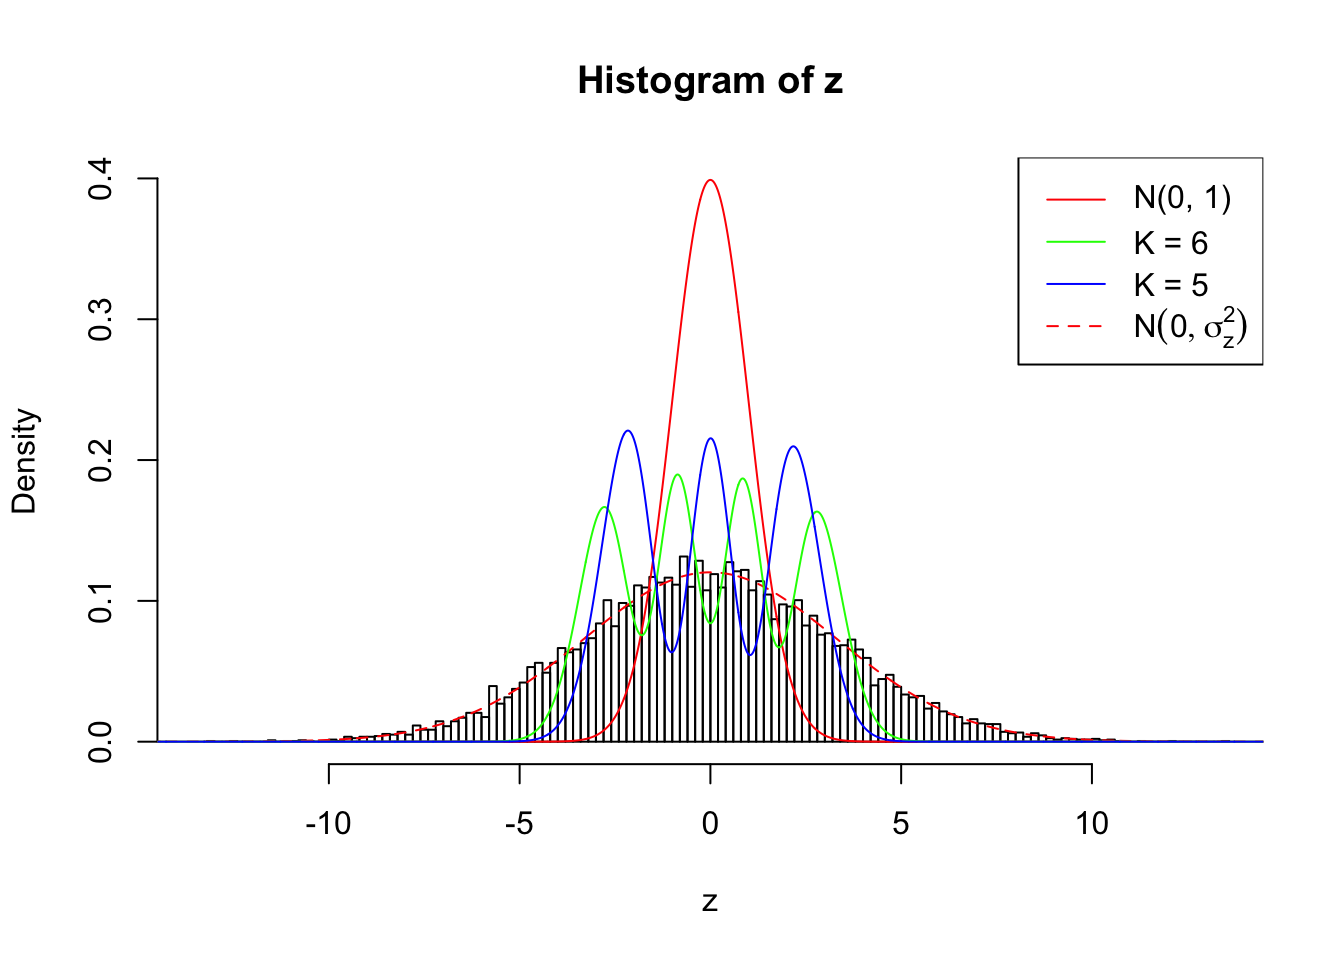
}## SNR = 1 ; sigma_z = 1.502972 ; True Distribution: N ( 0 , 2.258925 ) .
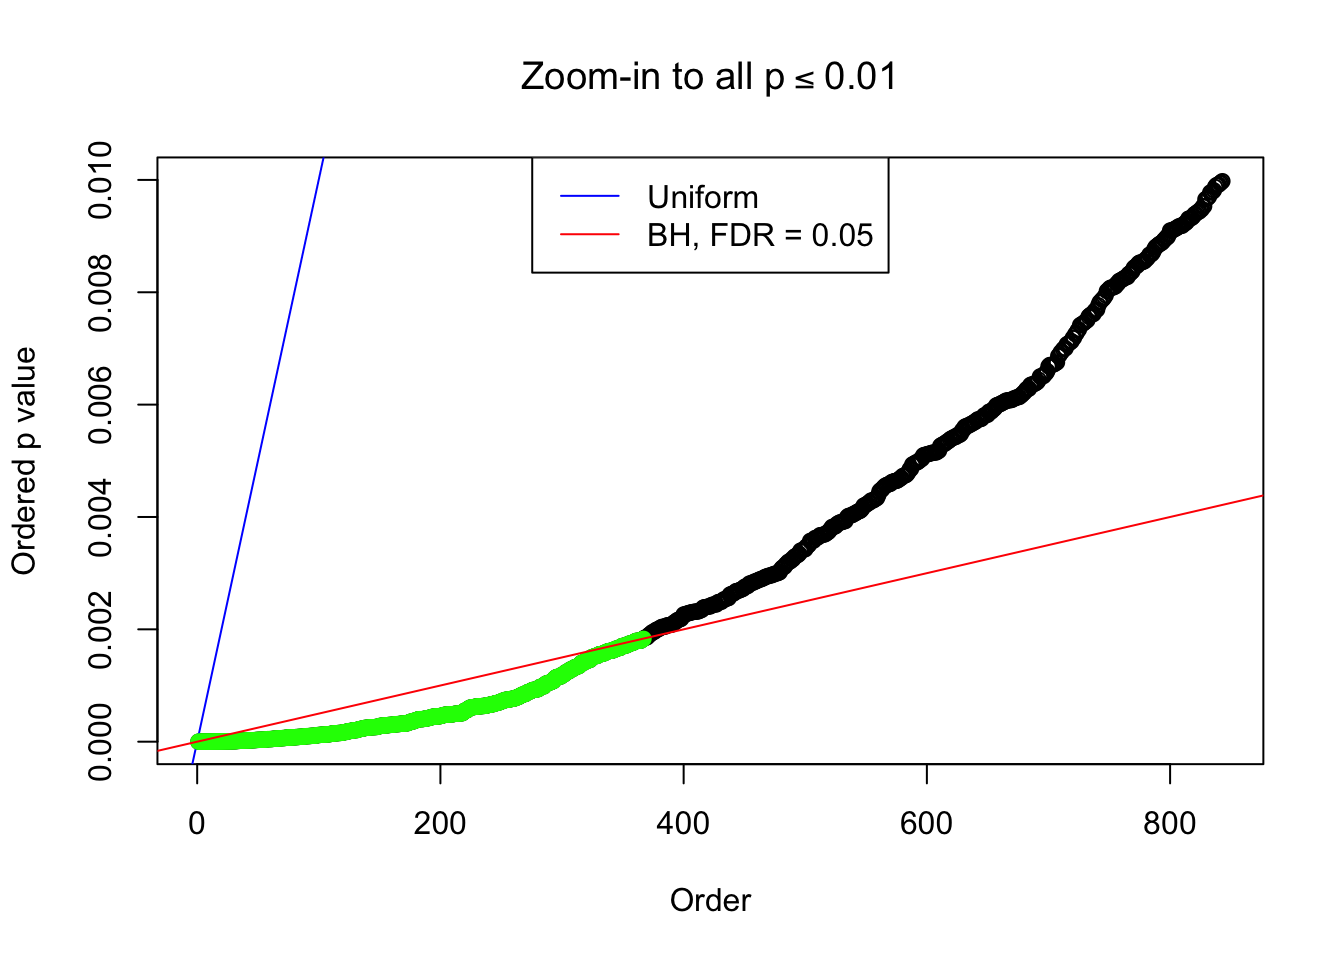
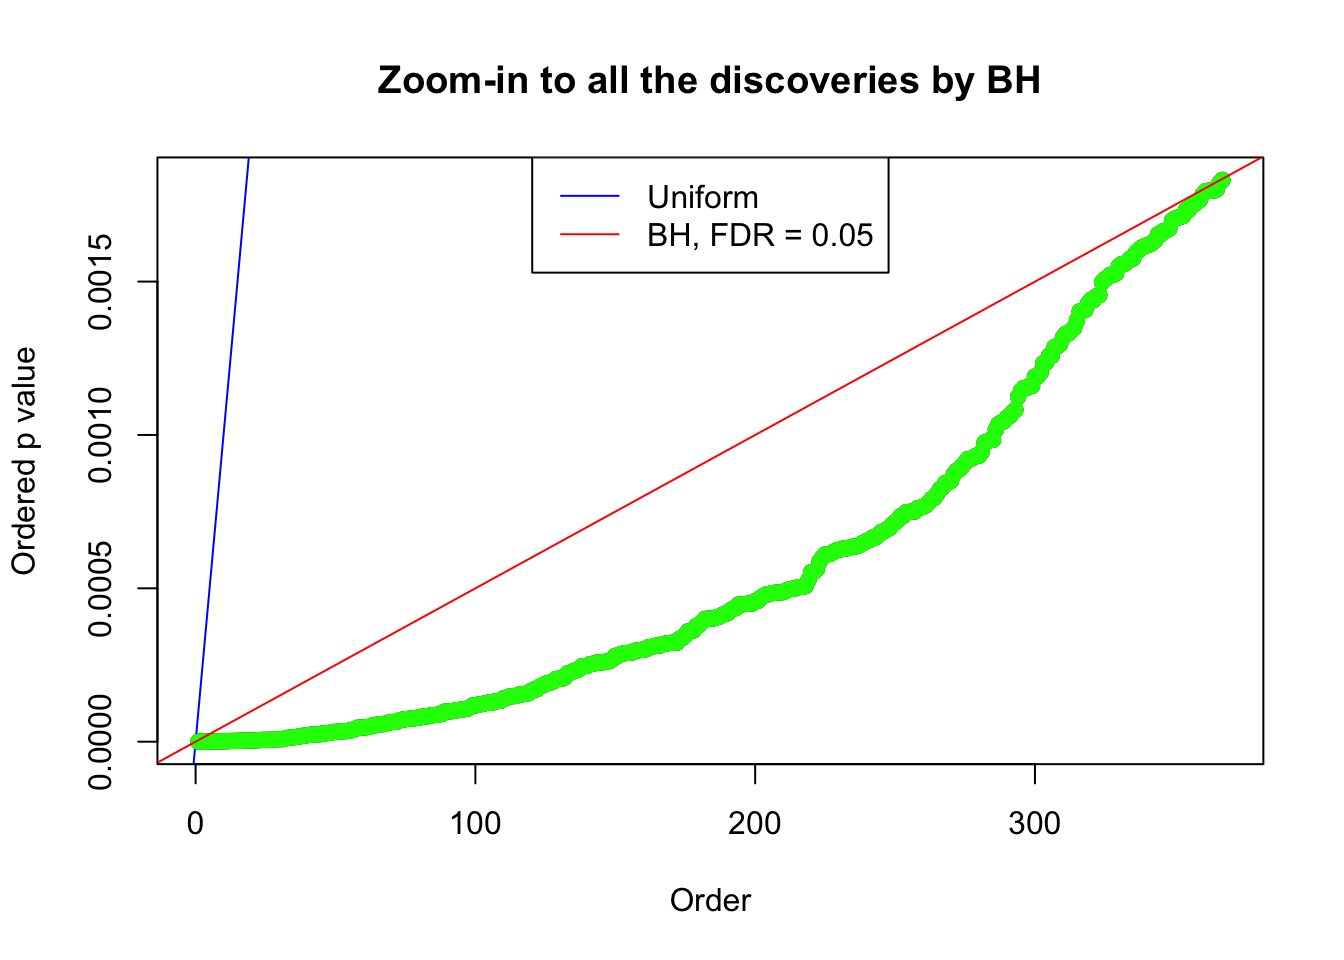
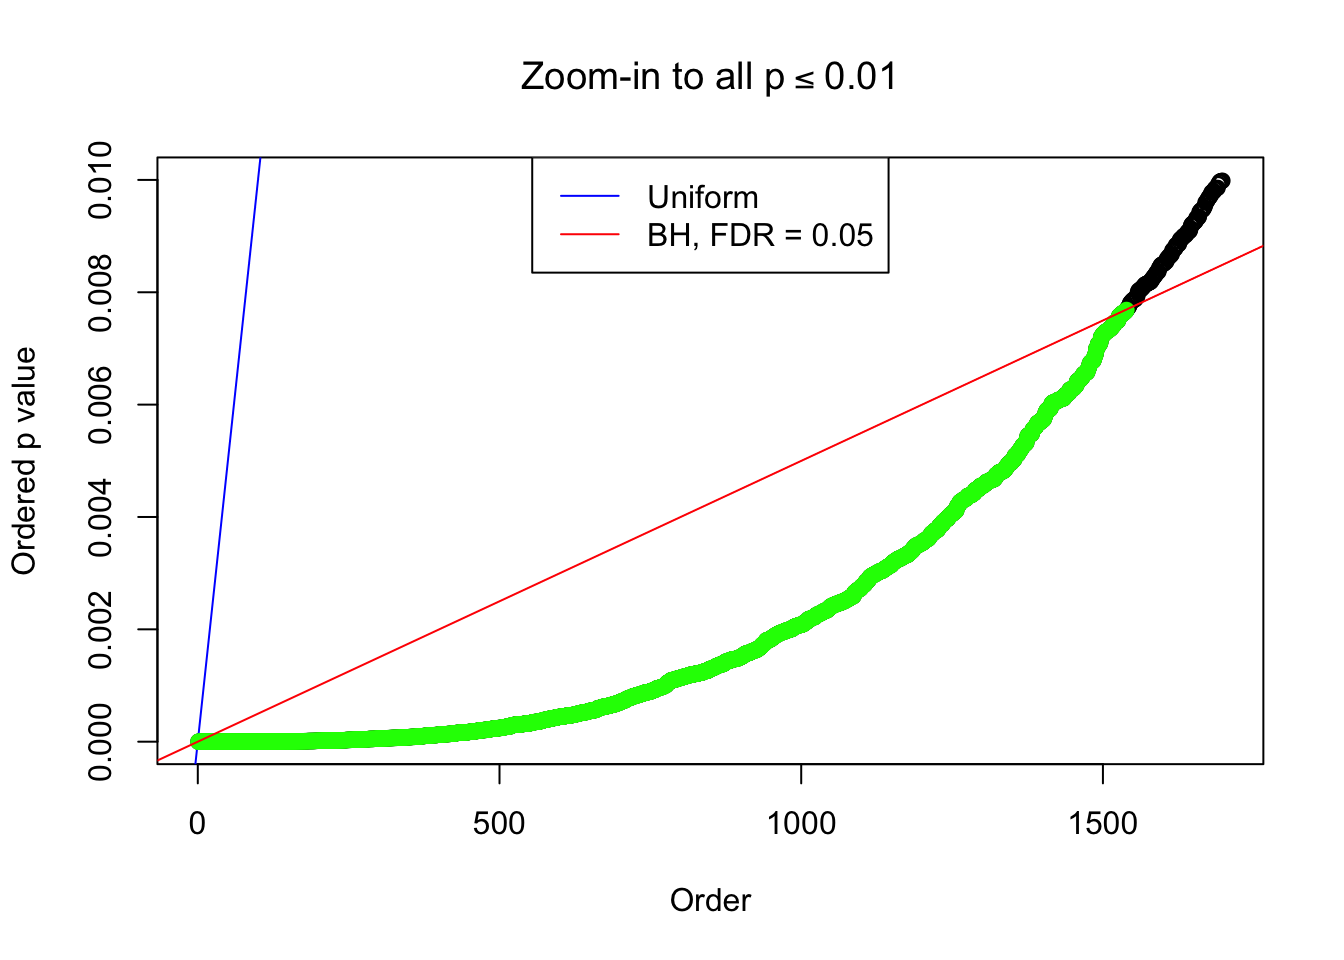
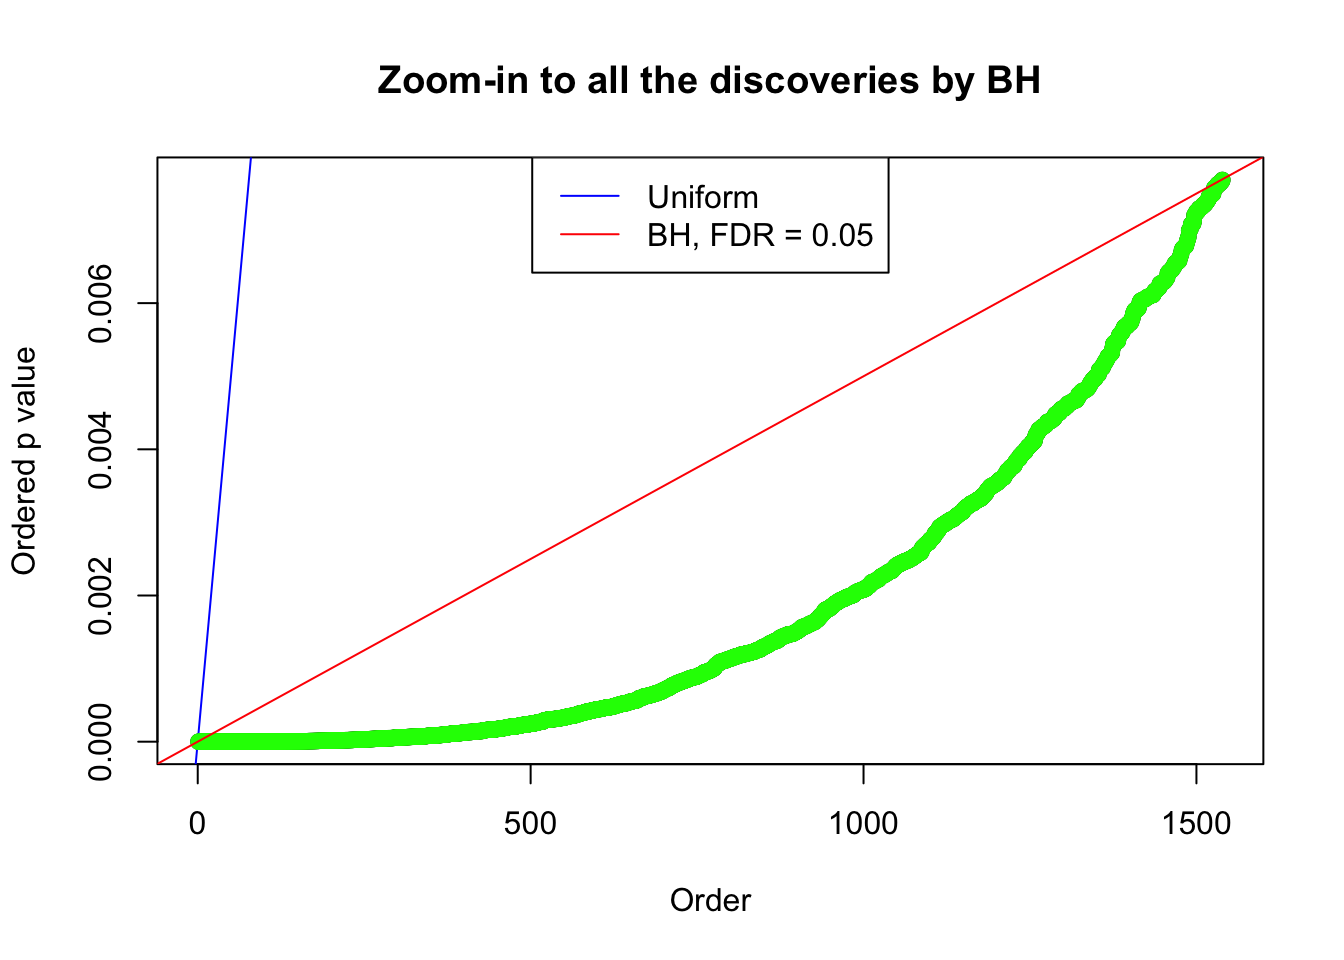
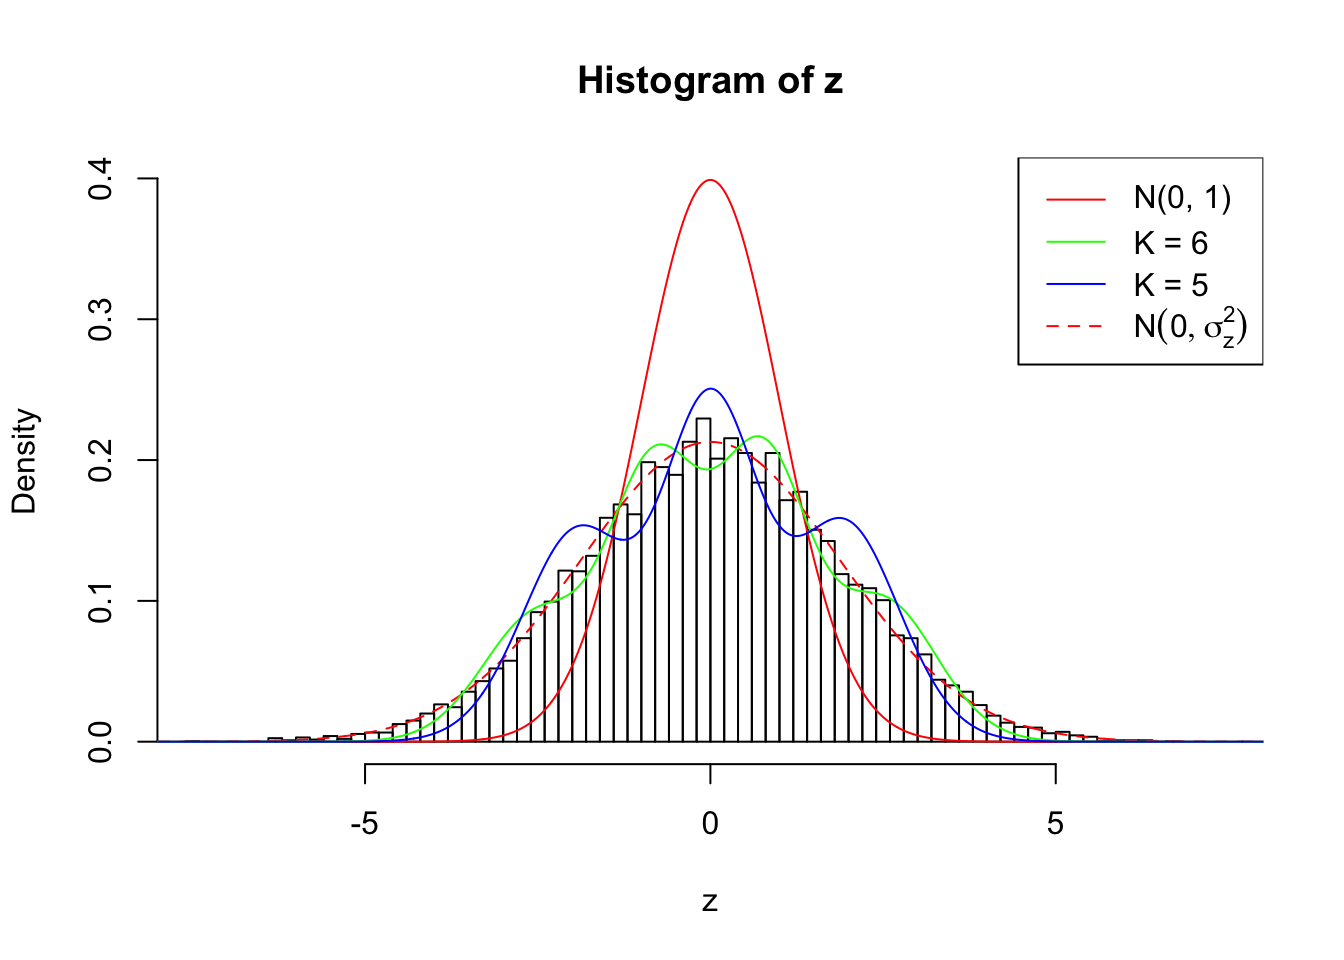
Example 1 :
SNR = 1 ;
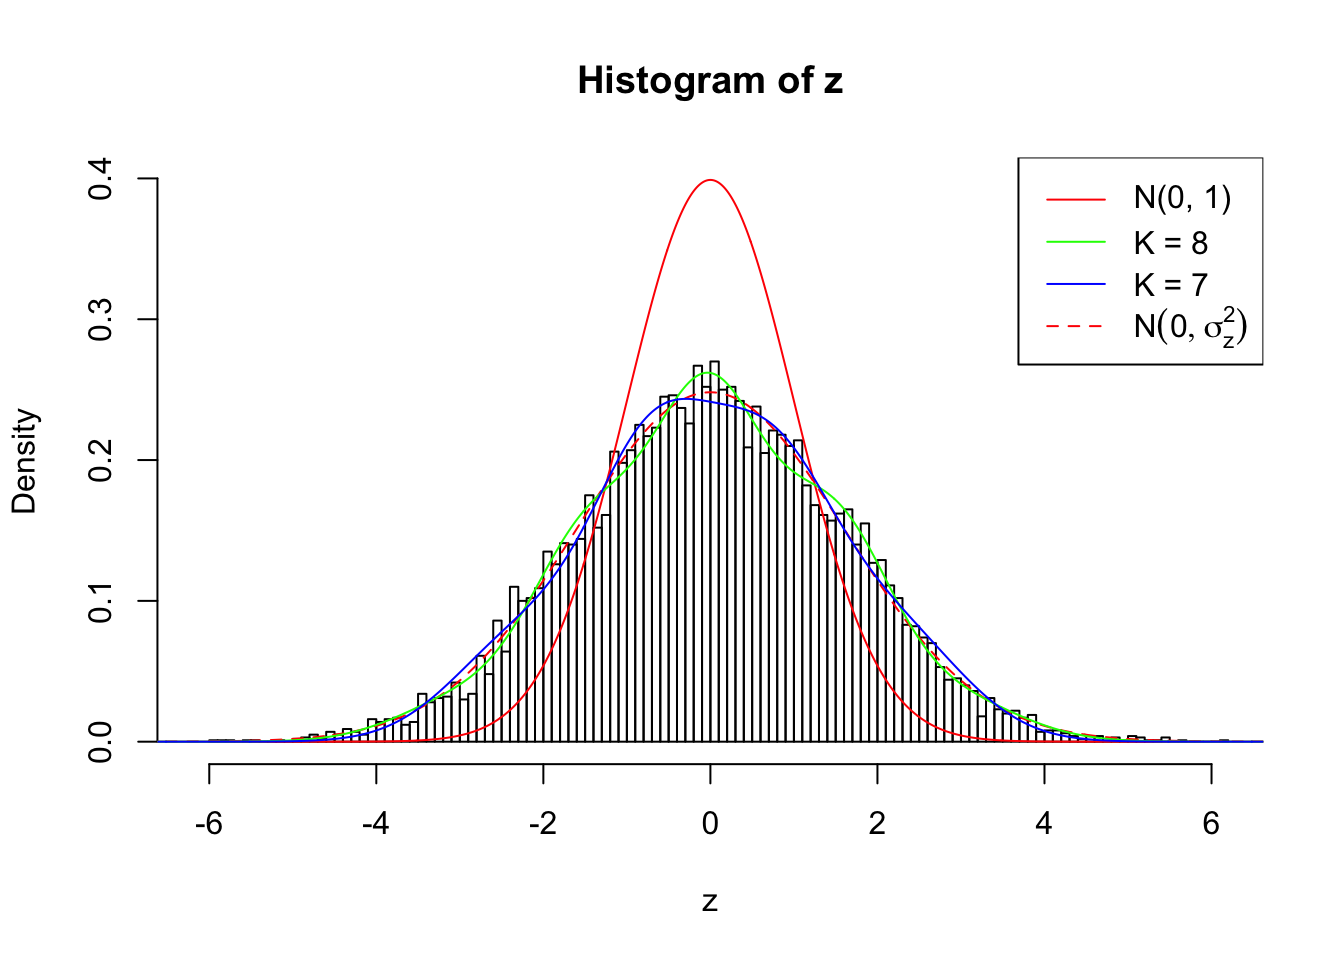
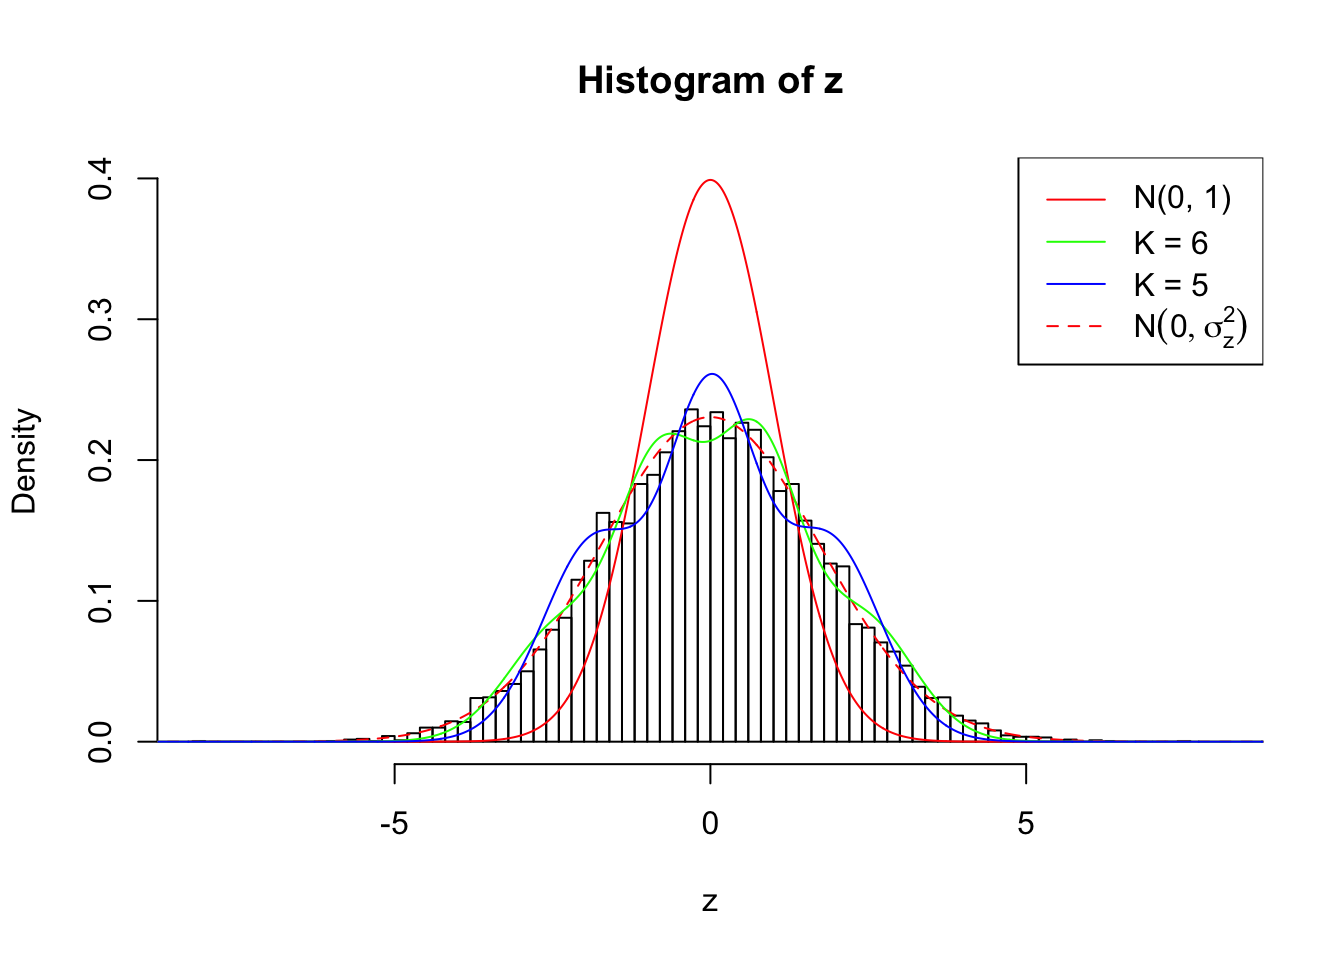
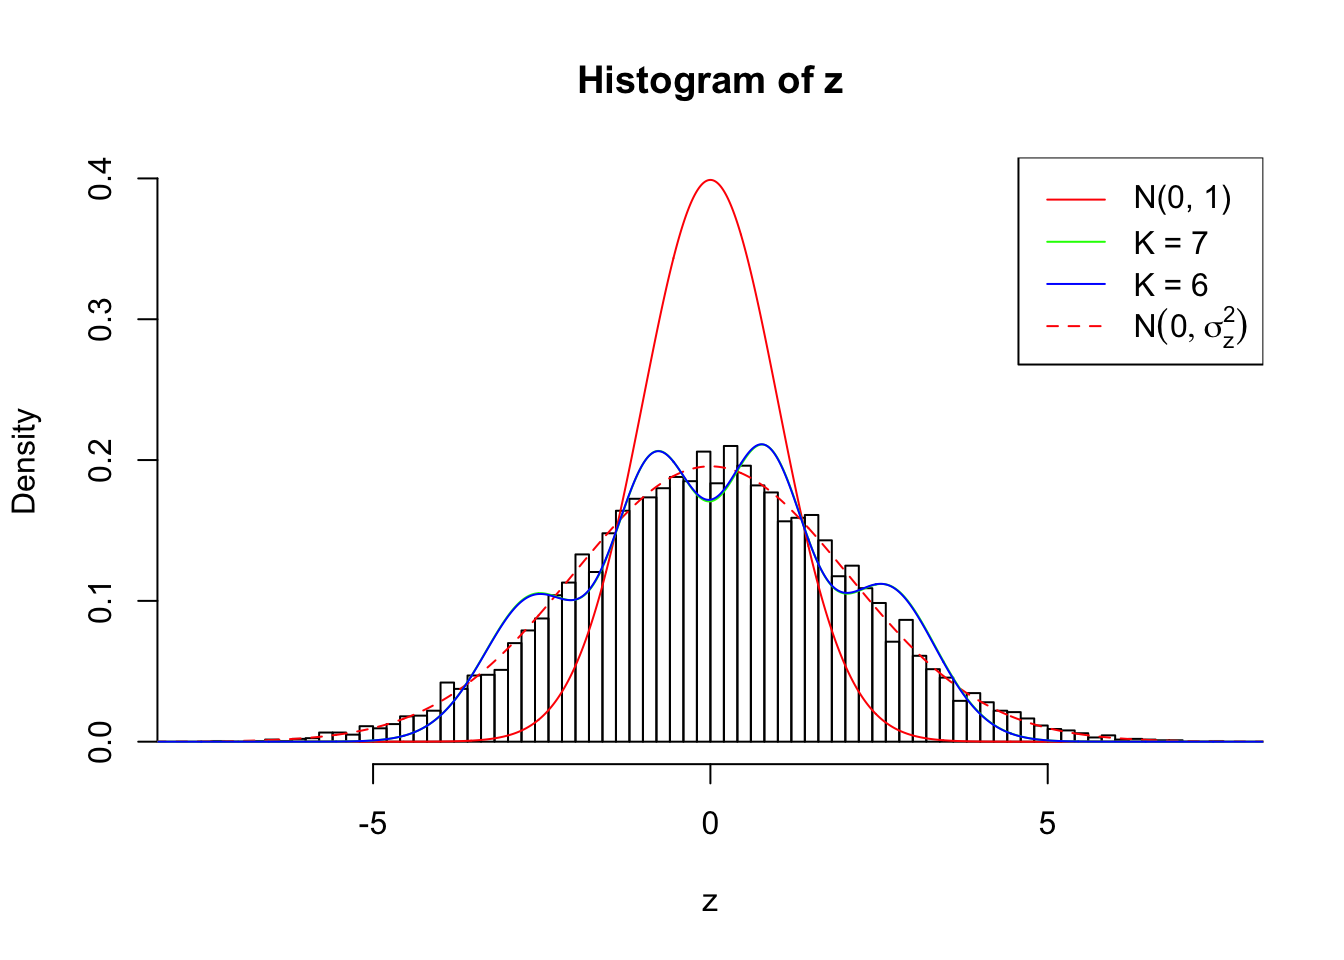
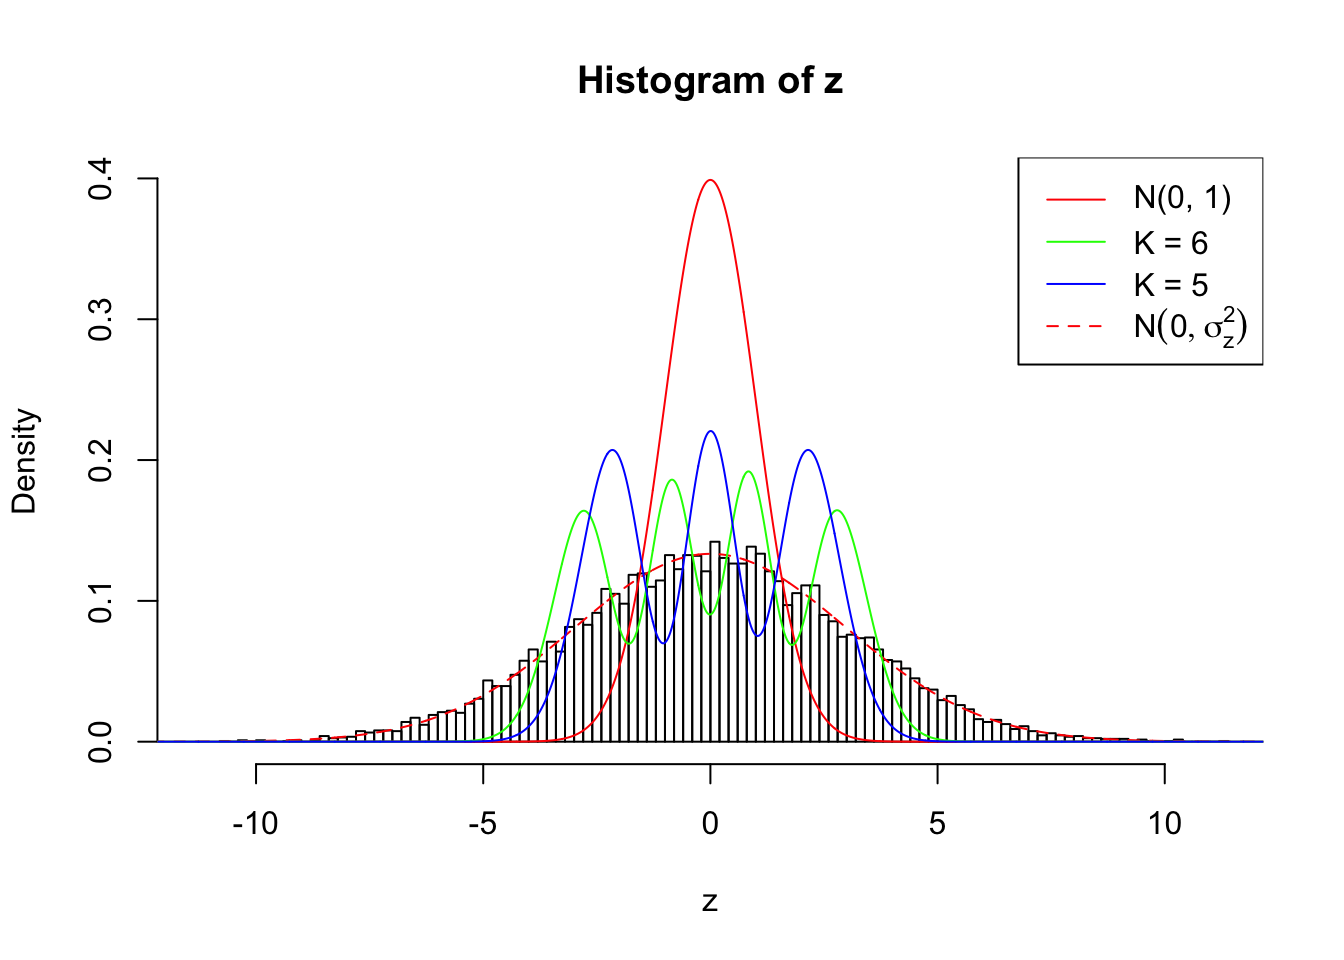
True Distribution: N ( 0 , 2.258925 ) ;
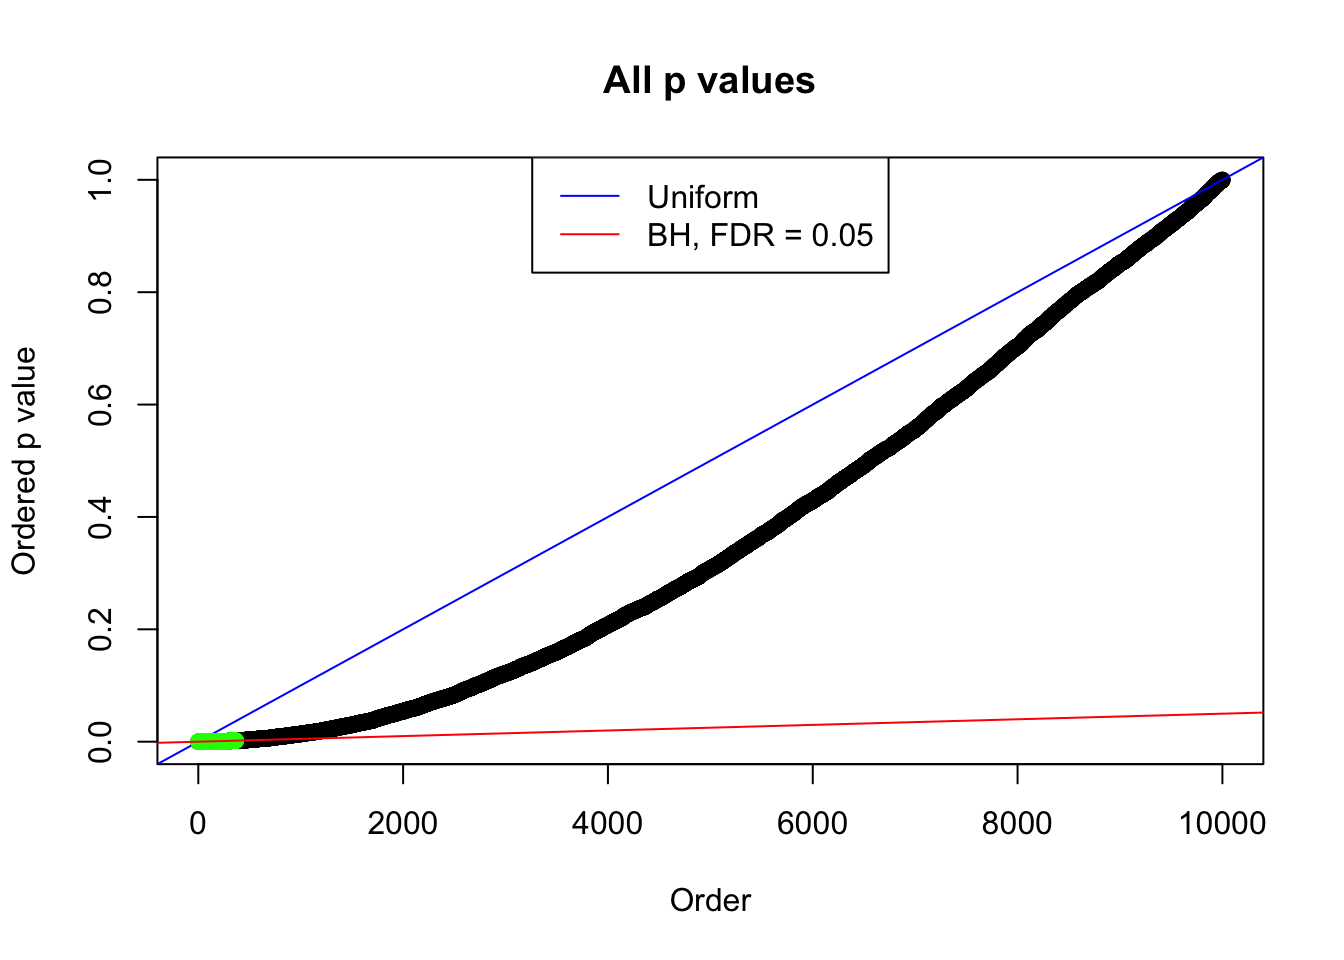
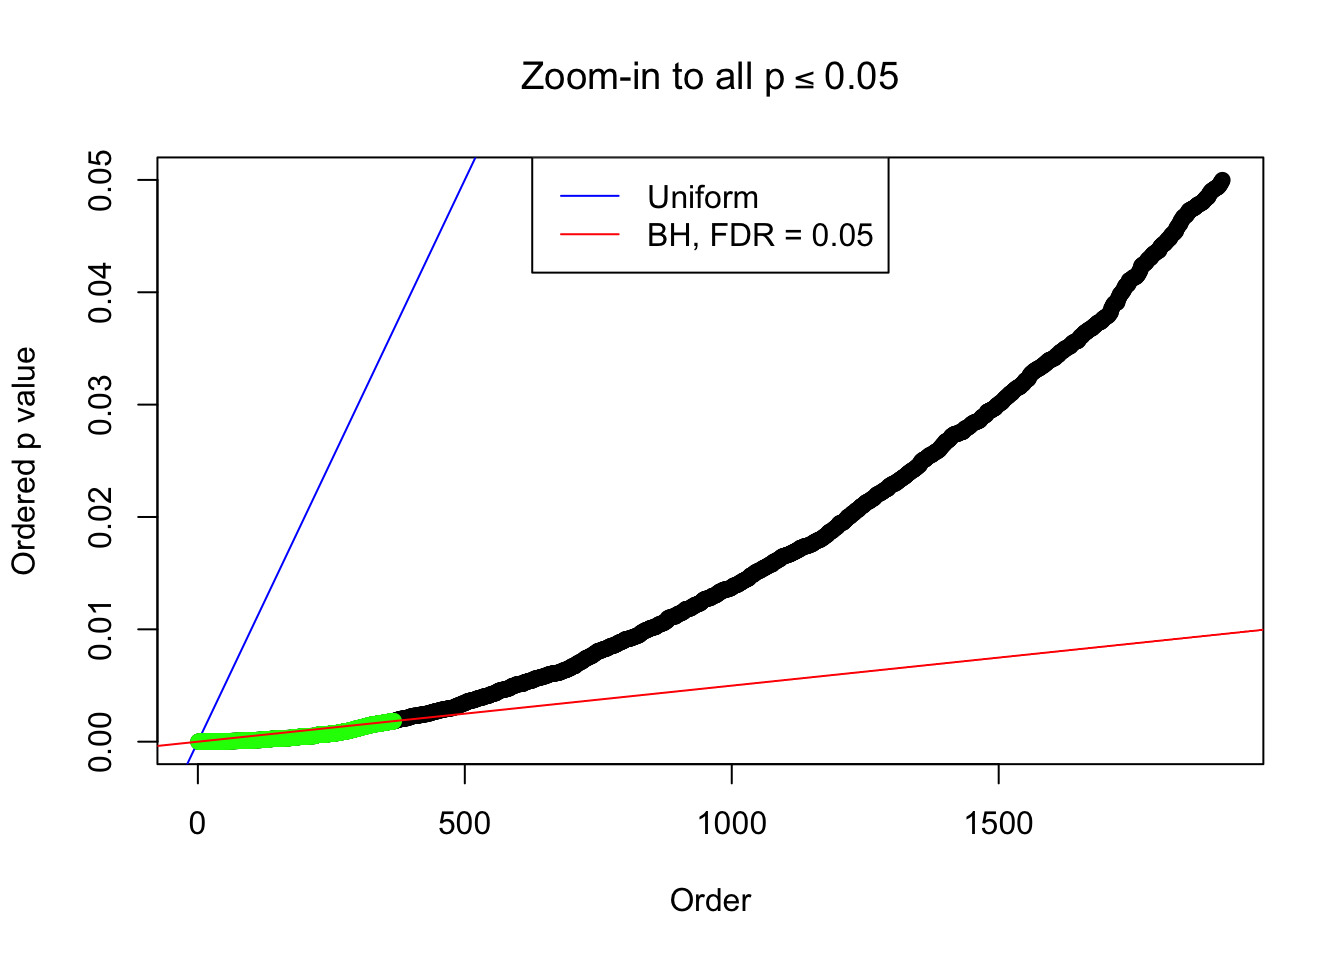
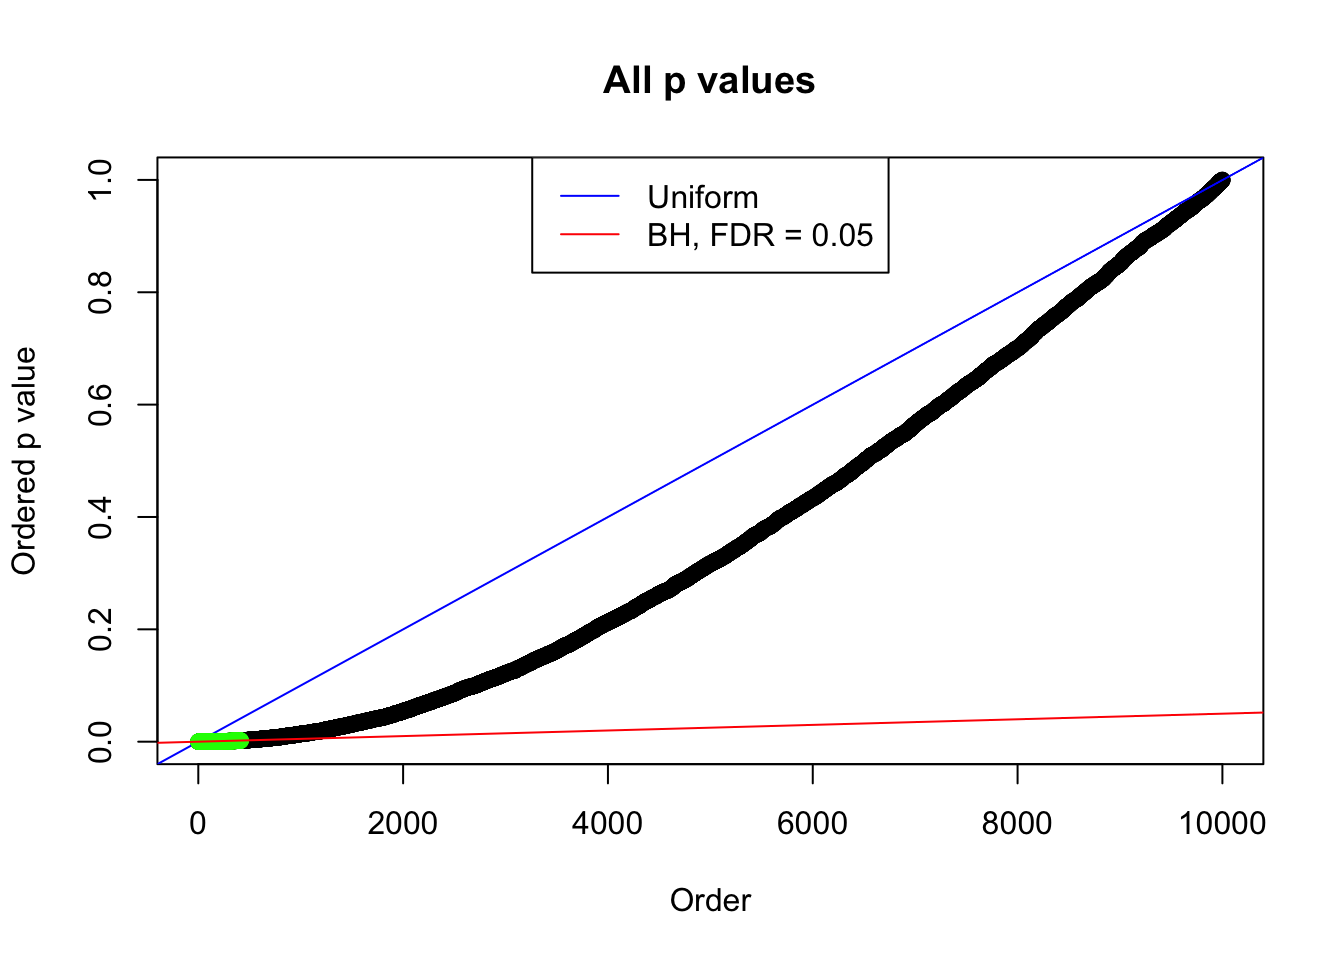
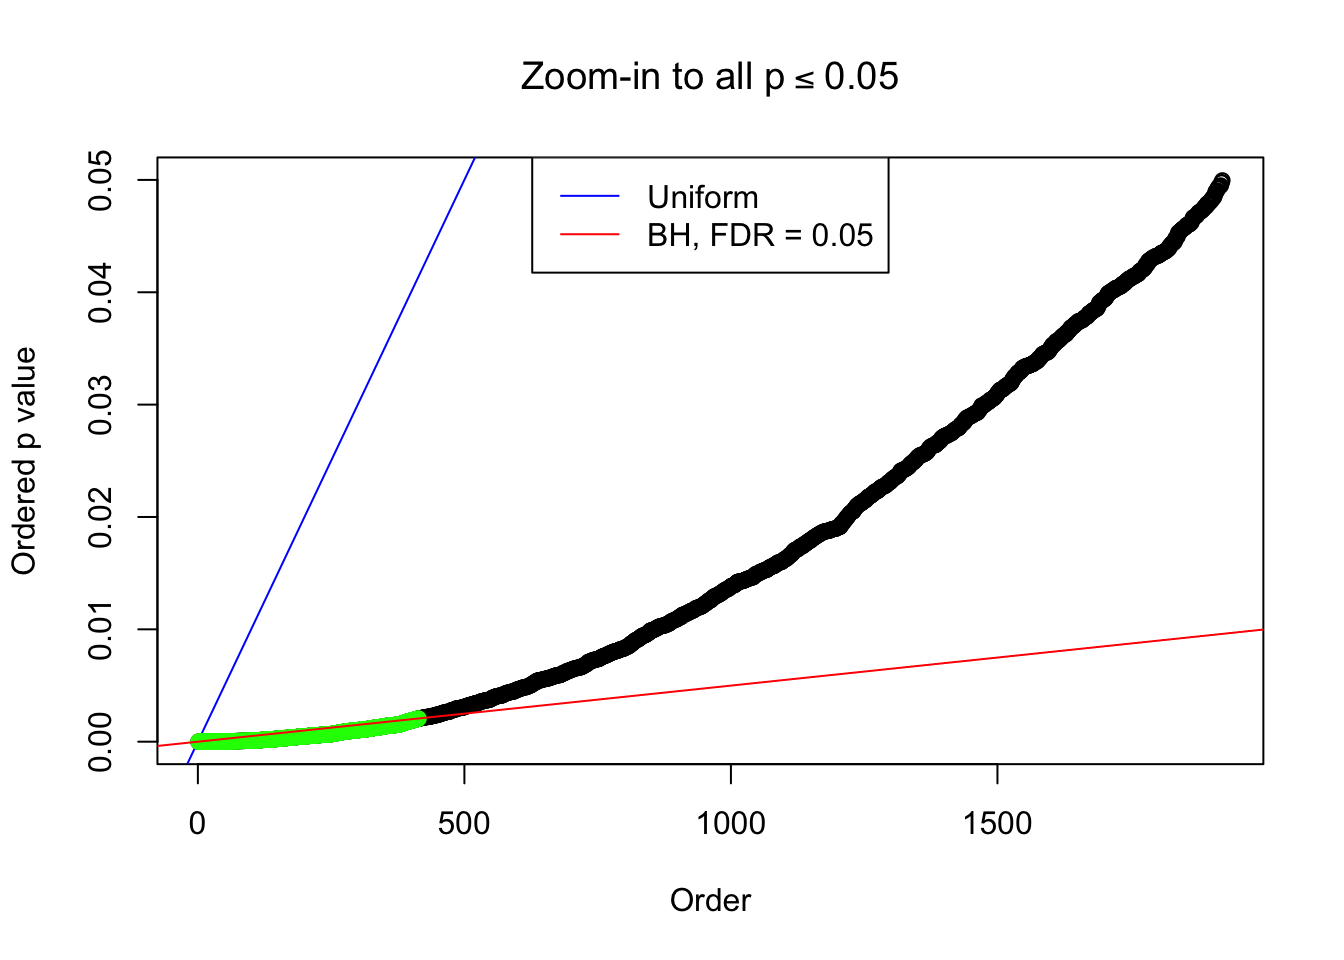
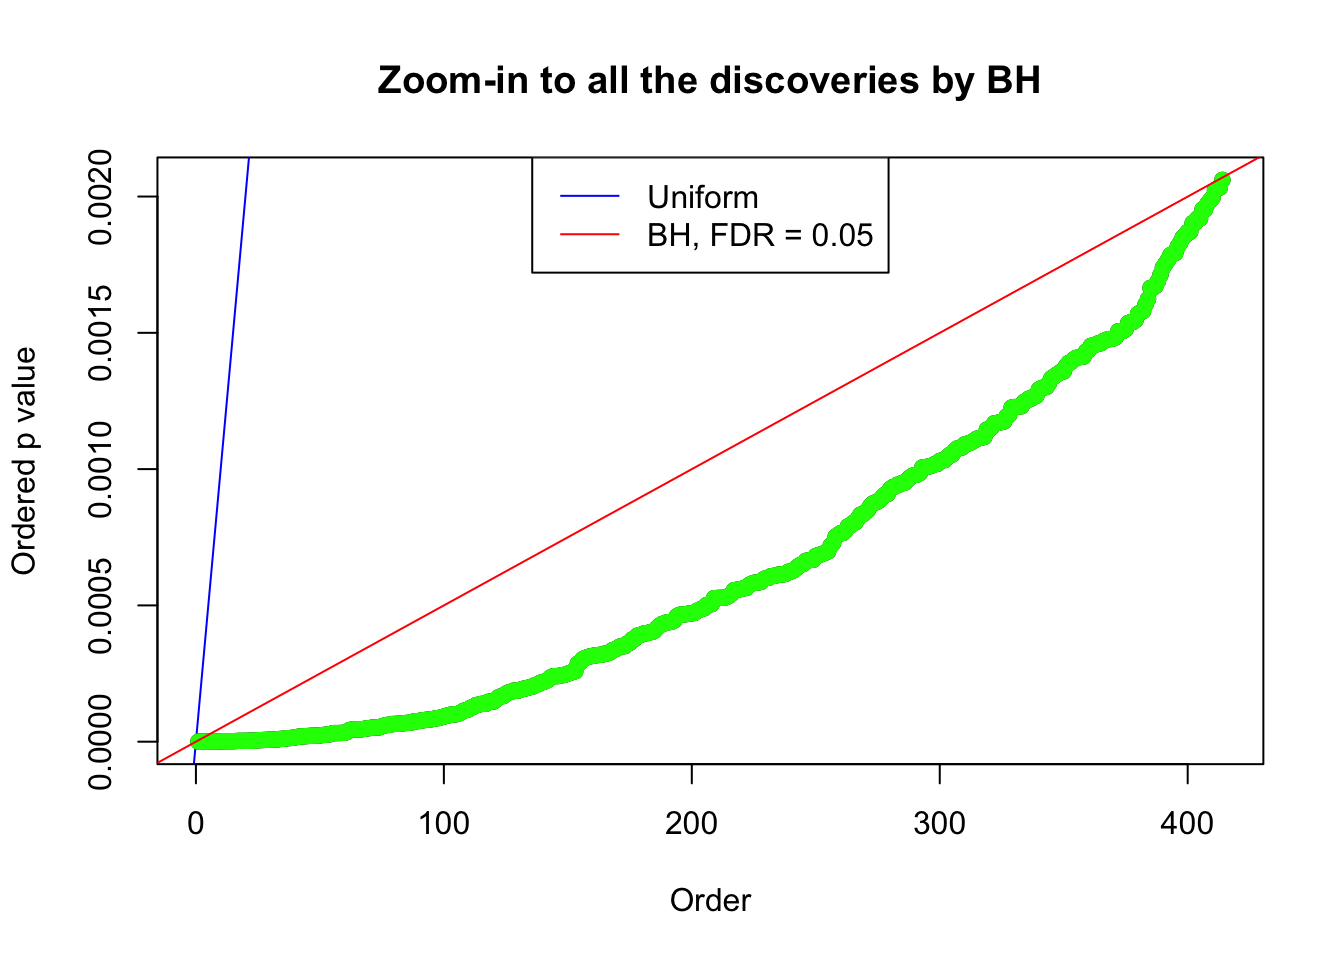
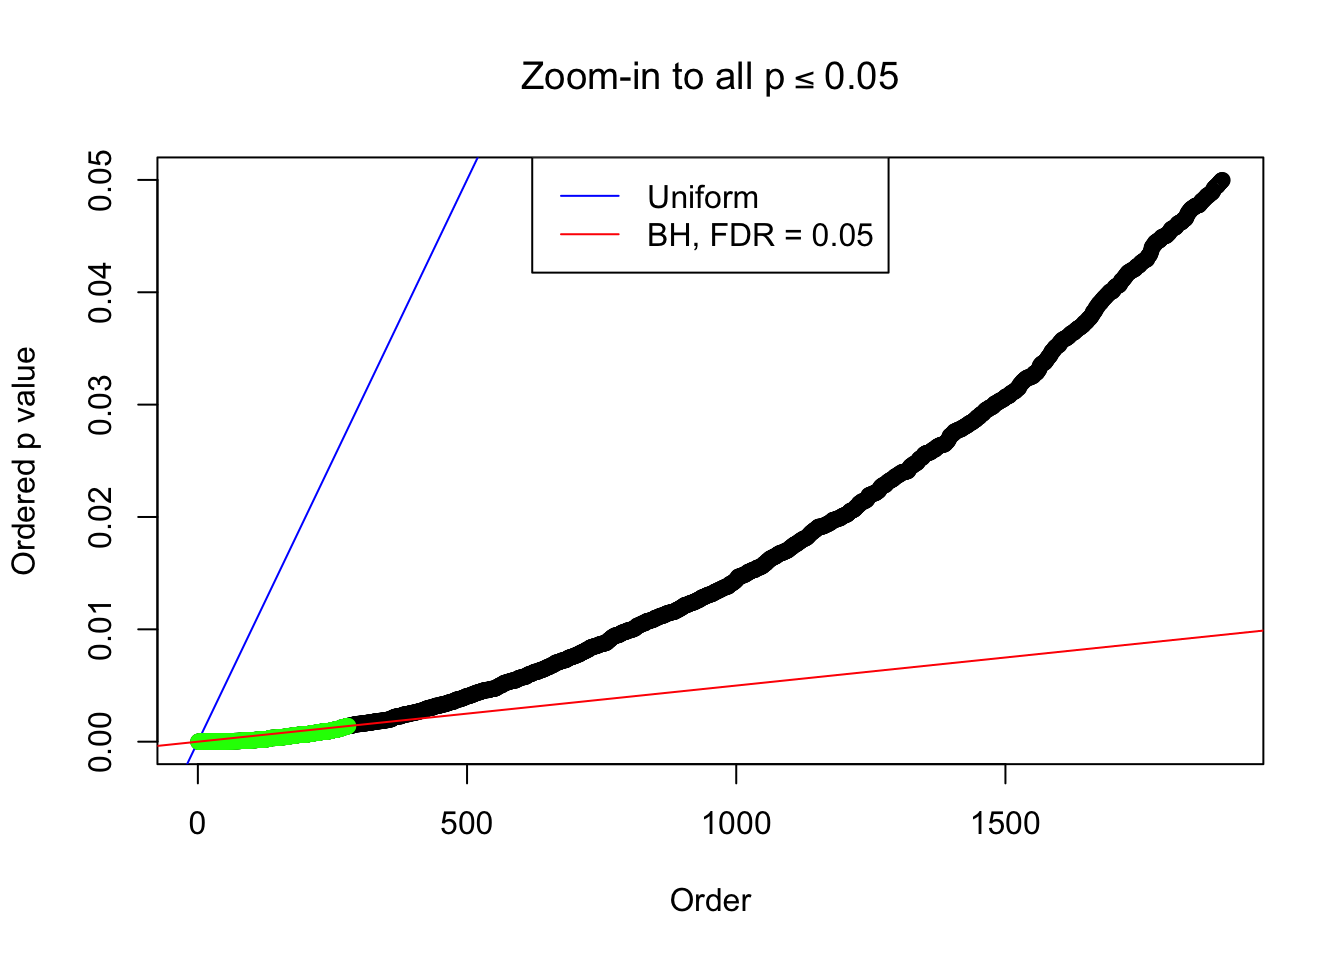
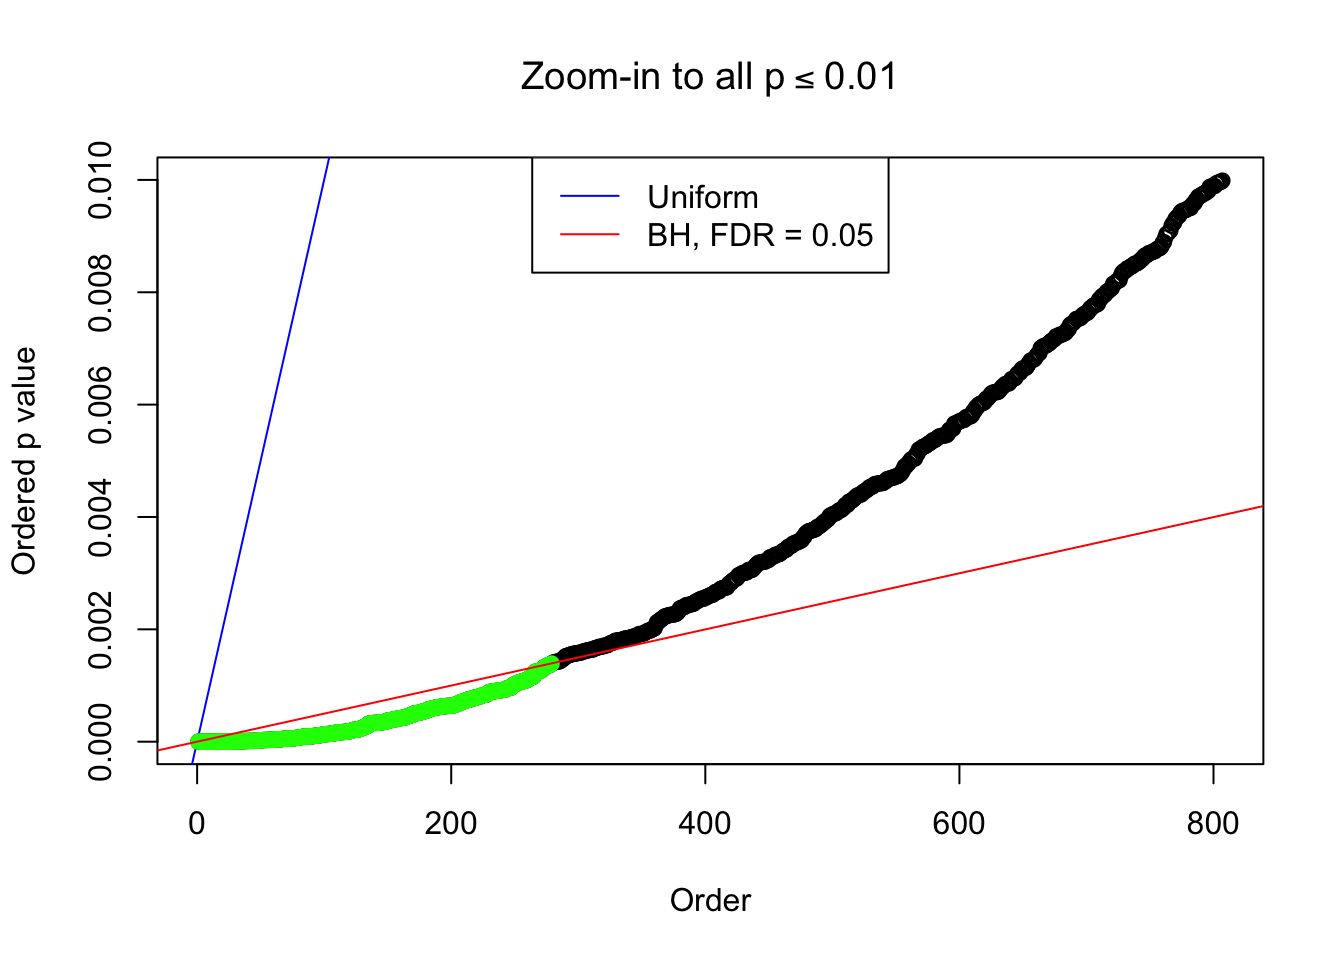
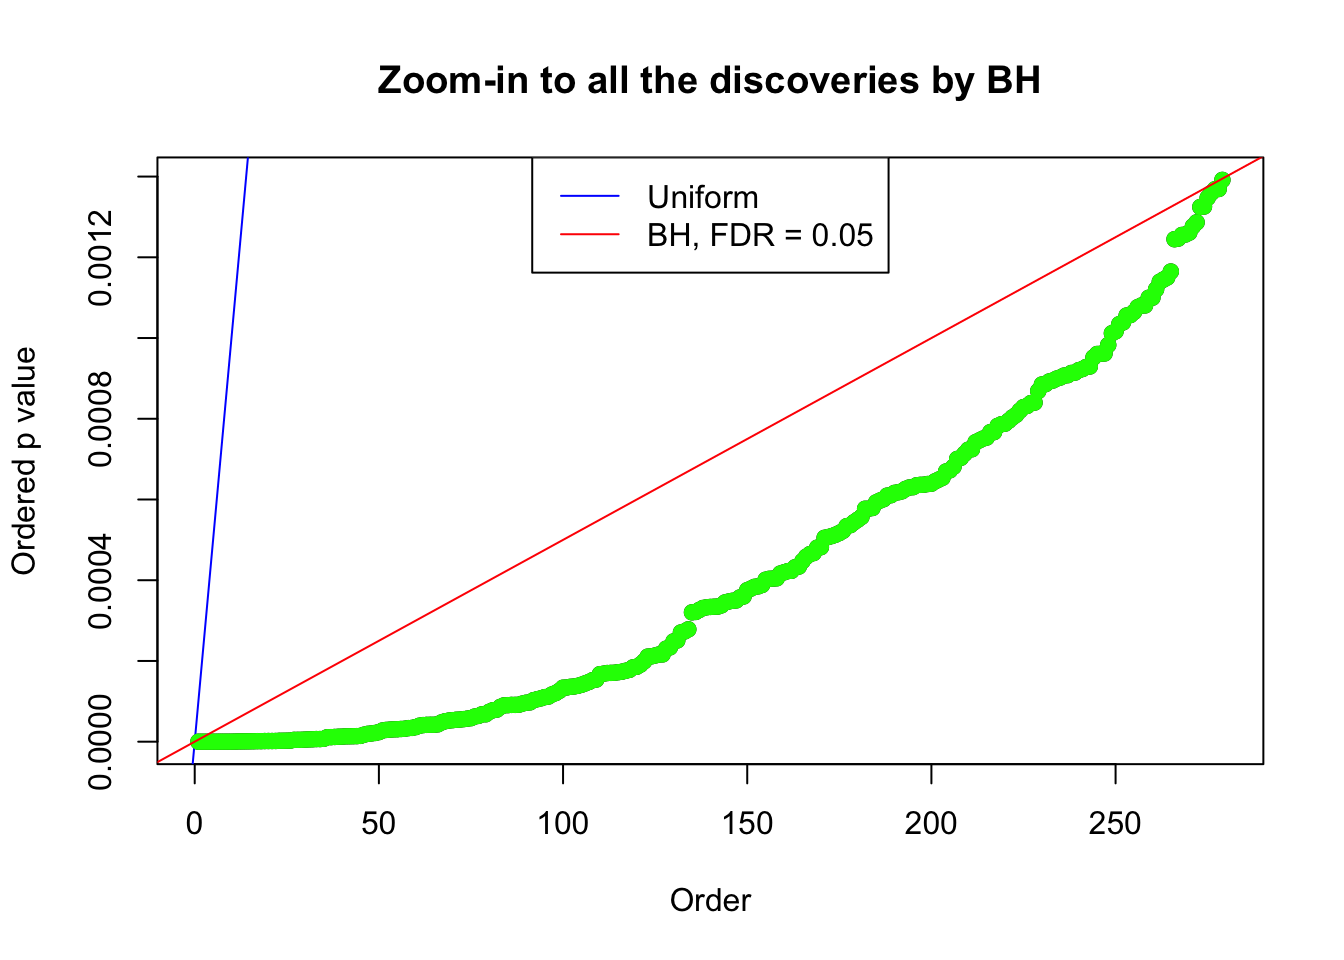
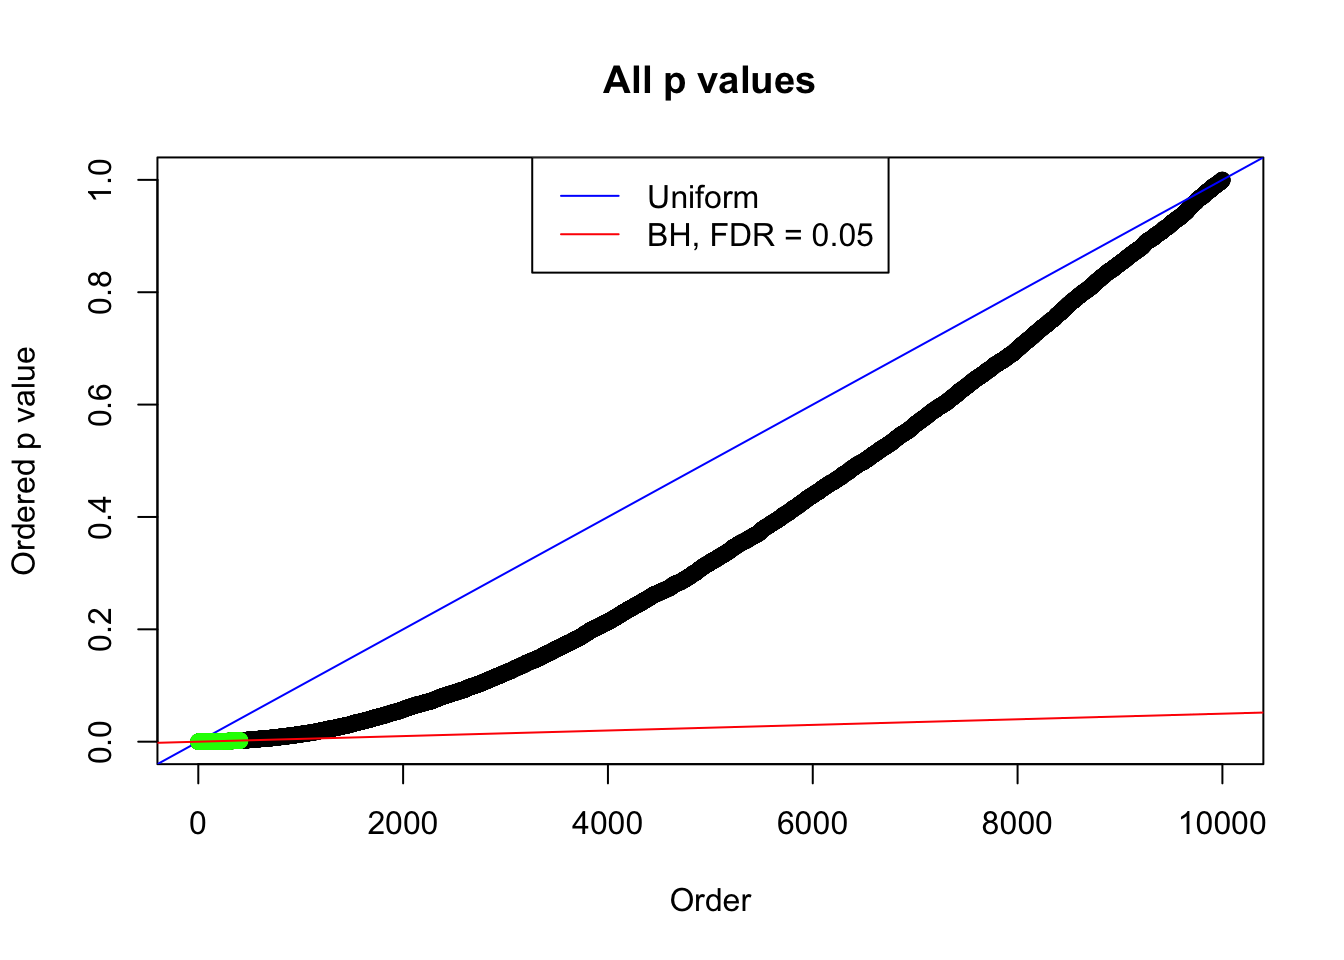
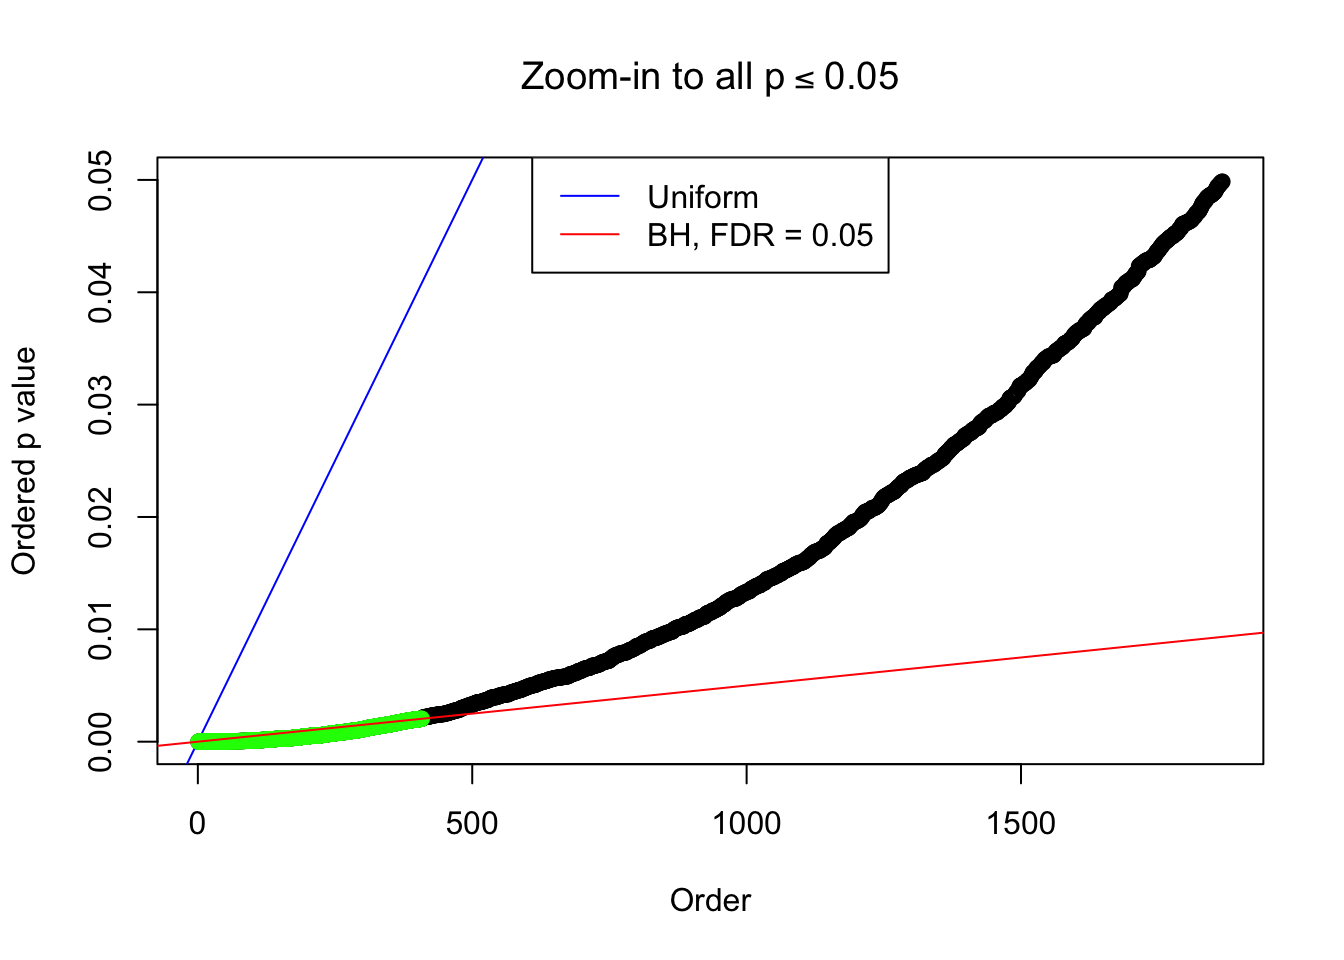
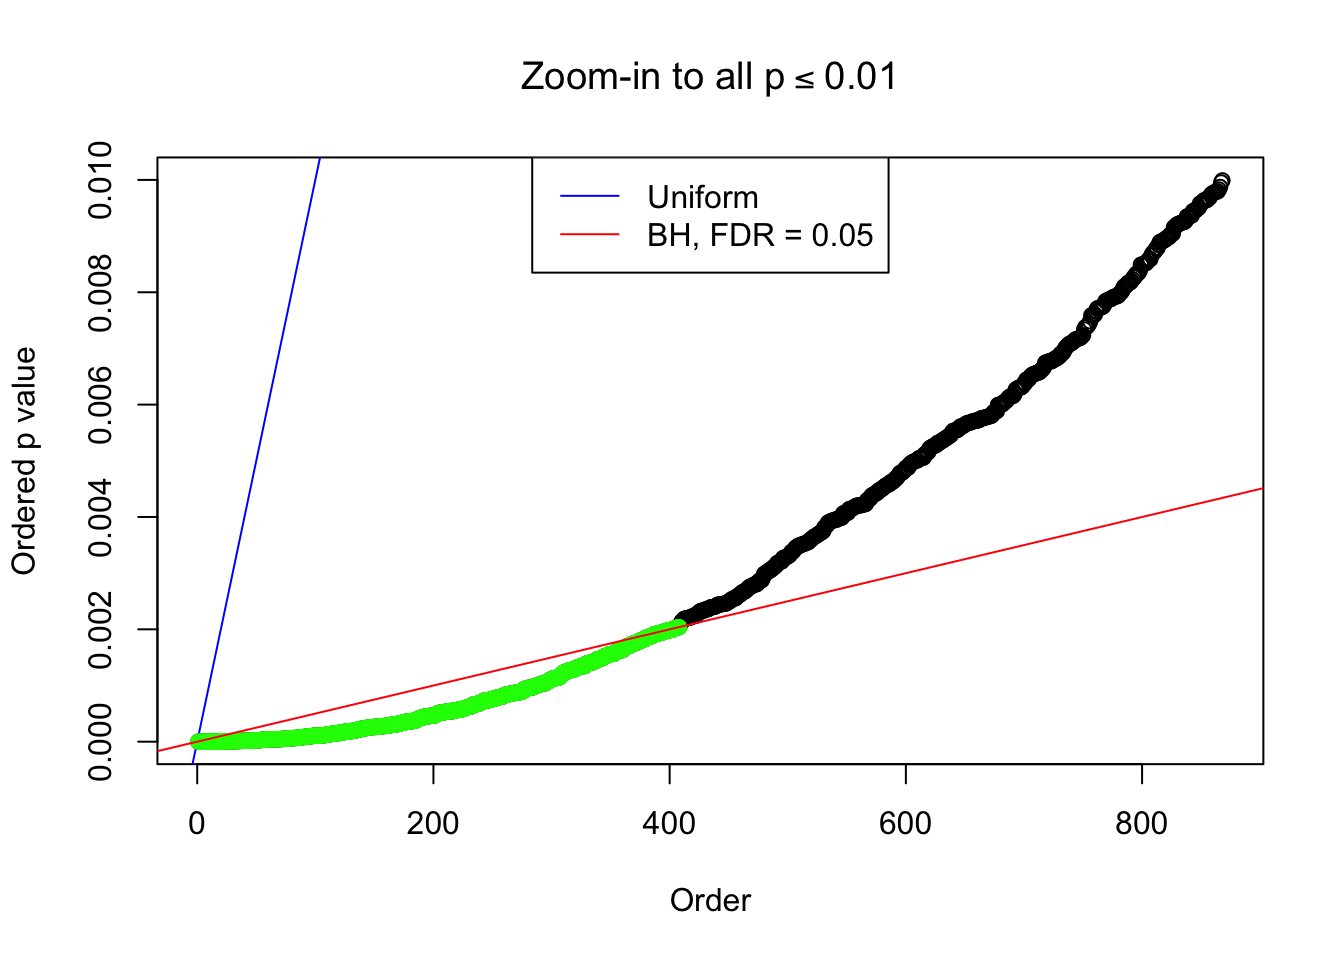
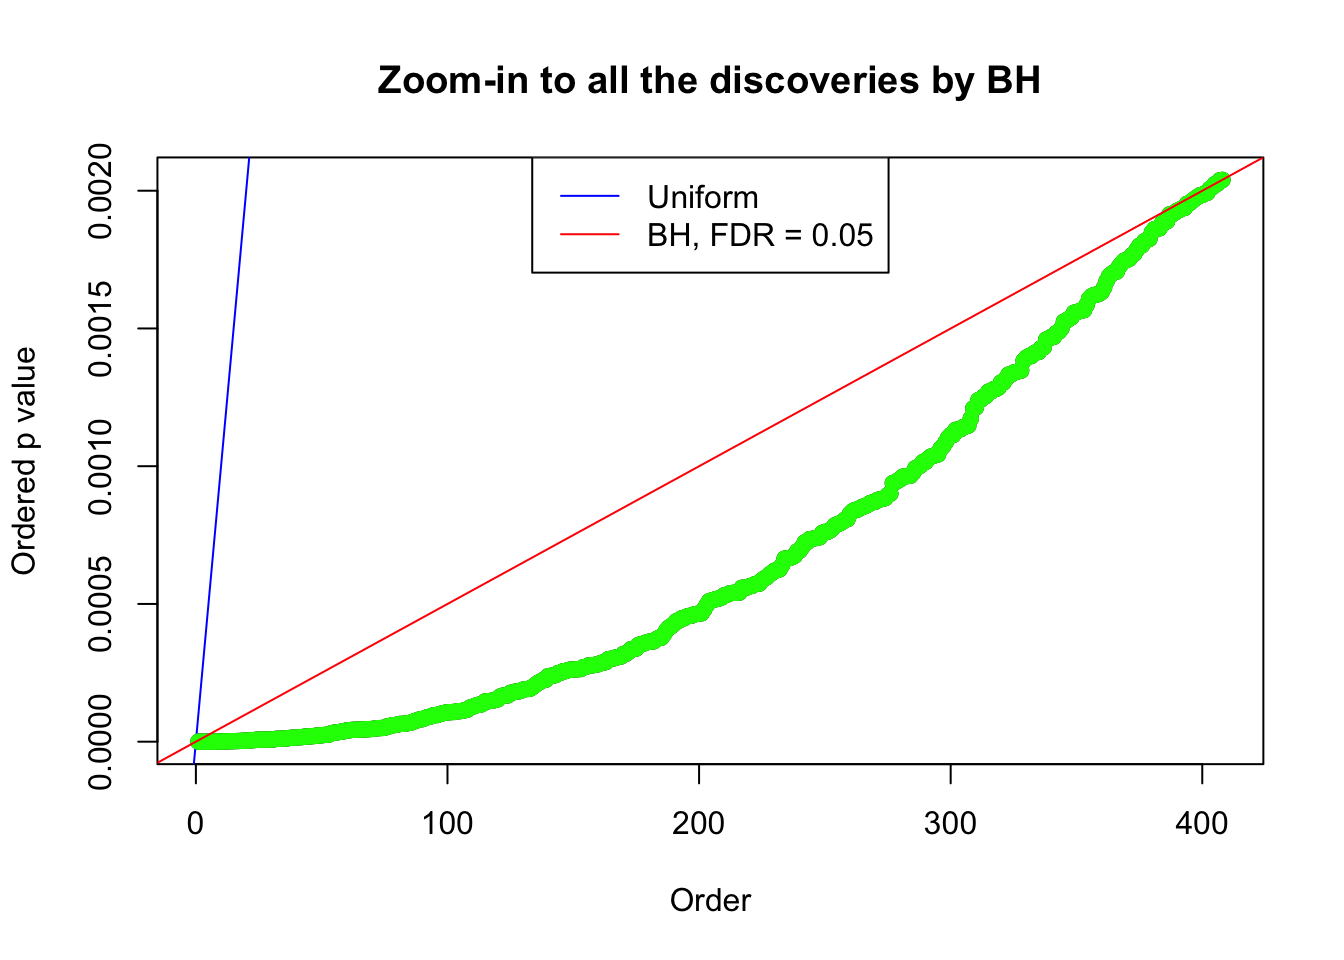
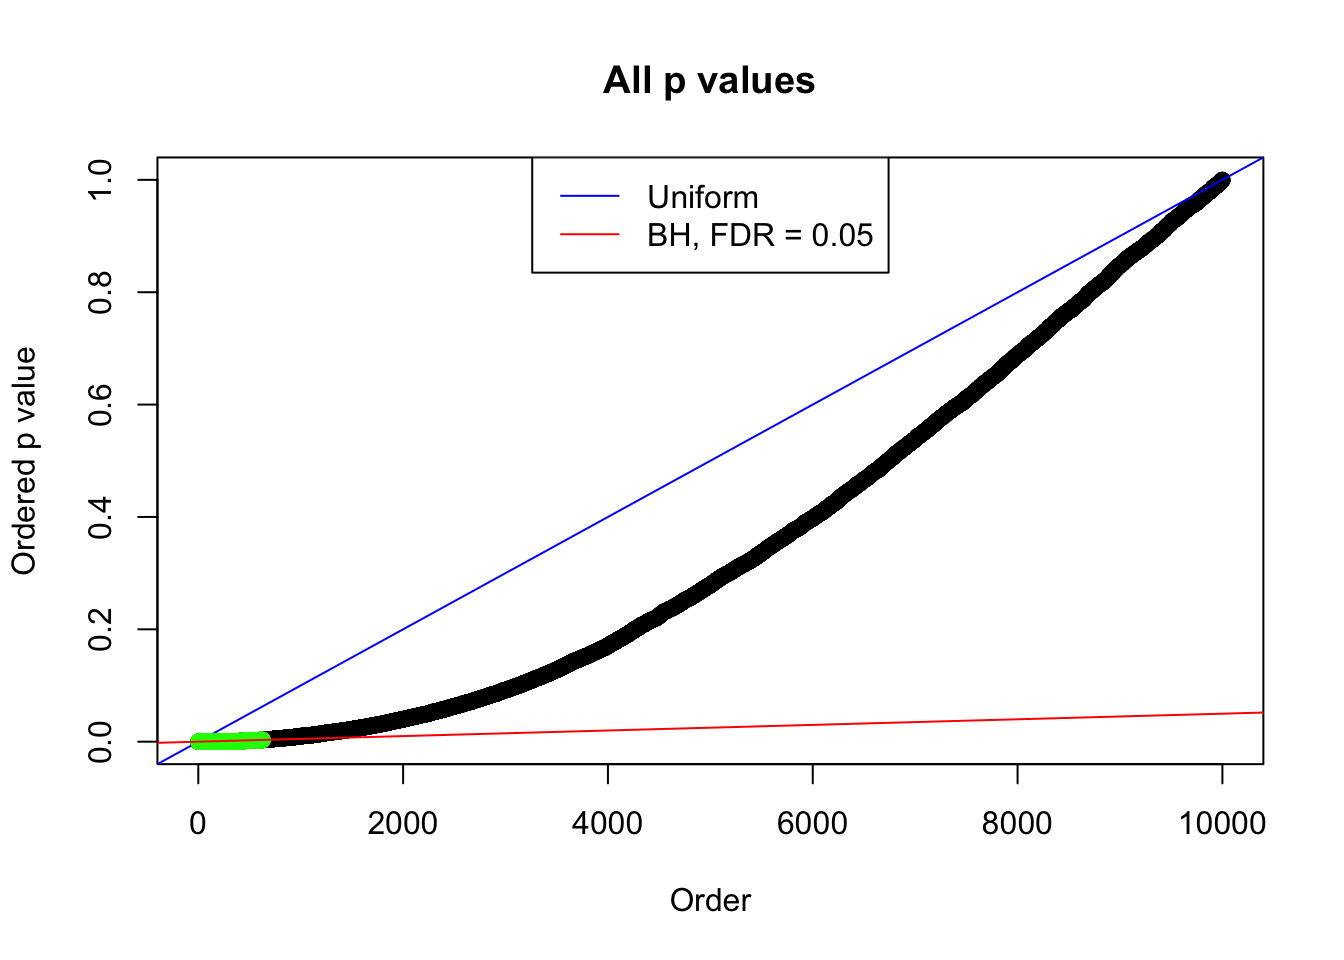
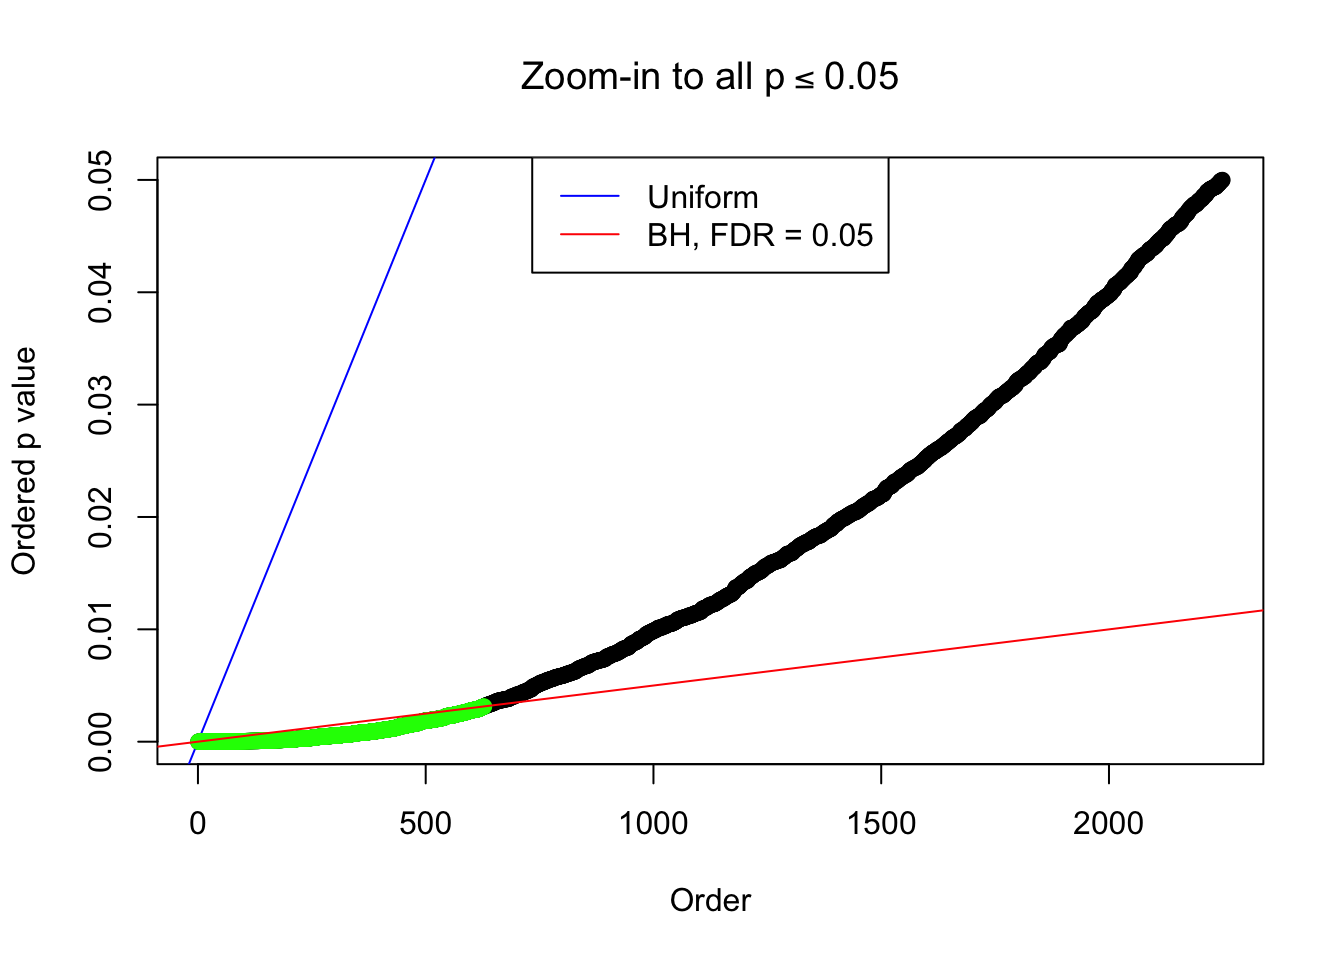
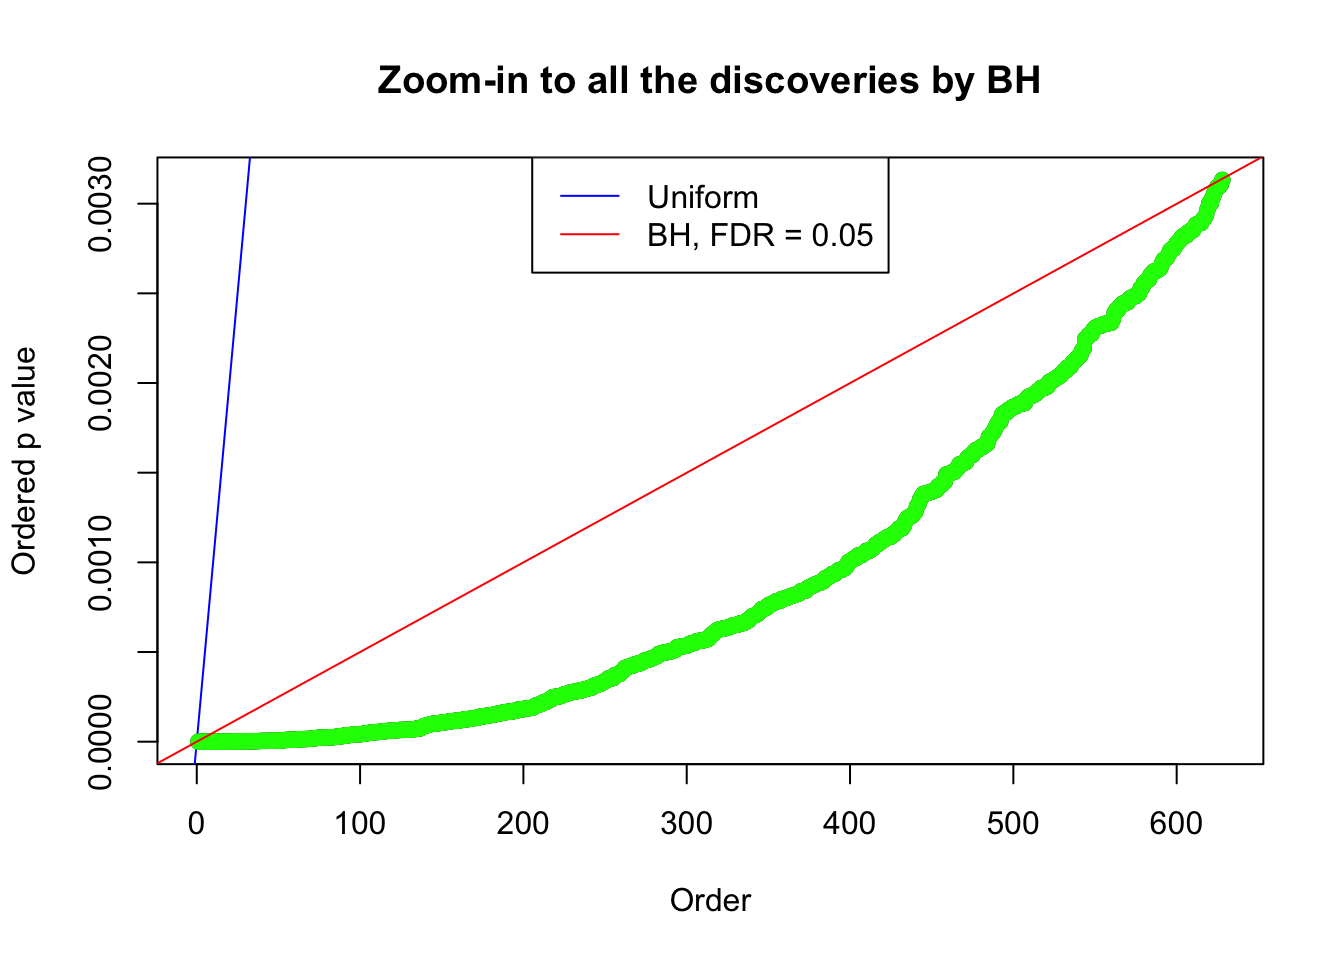
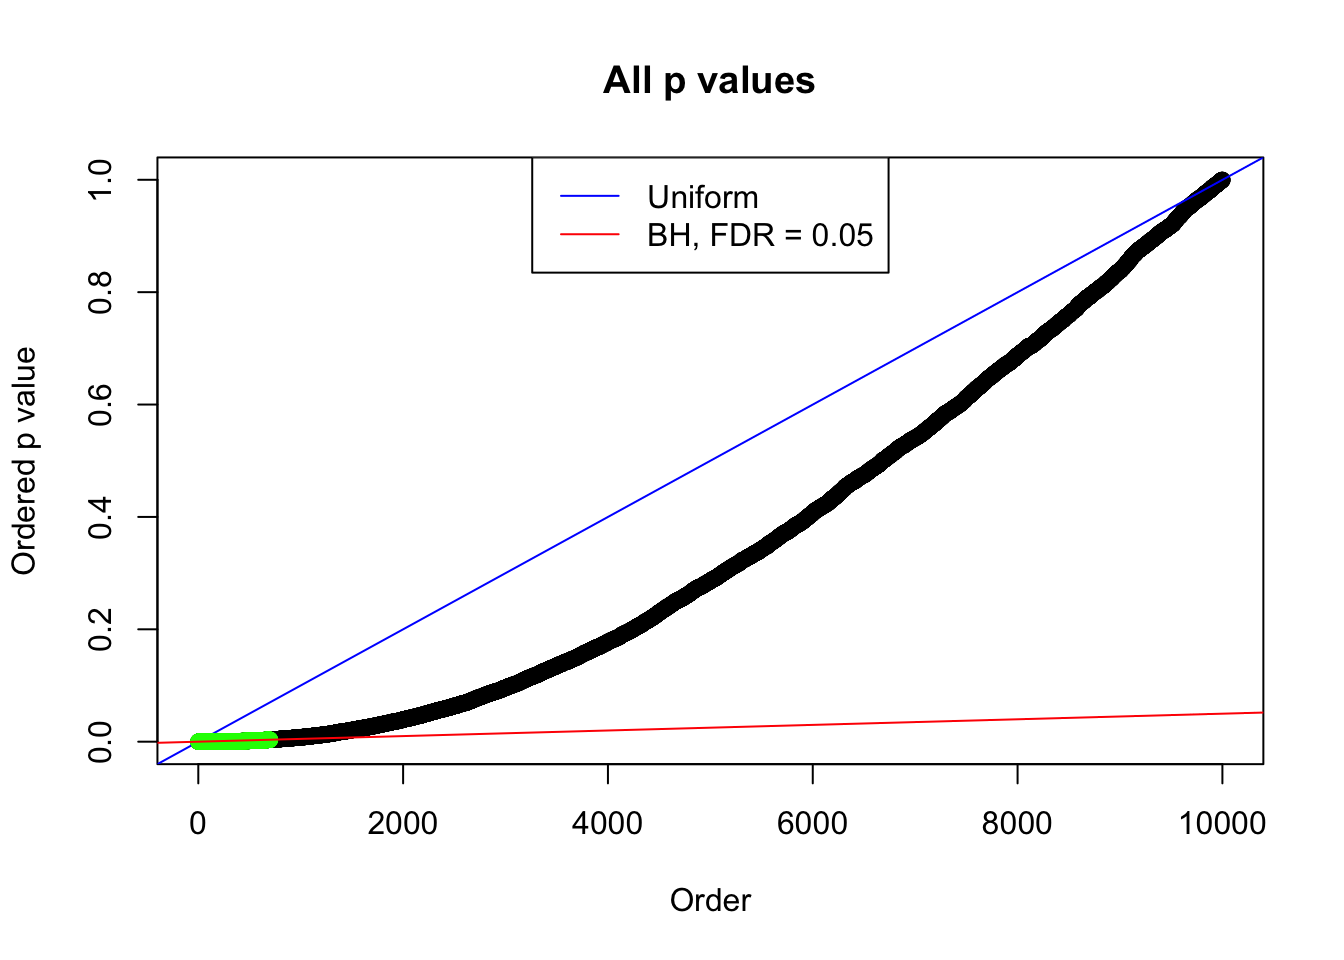
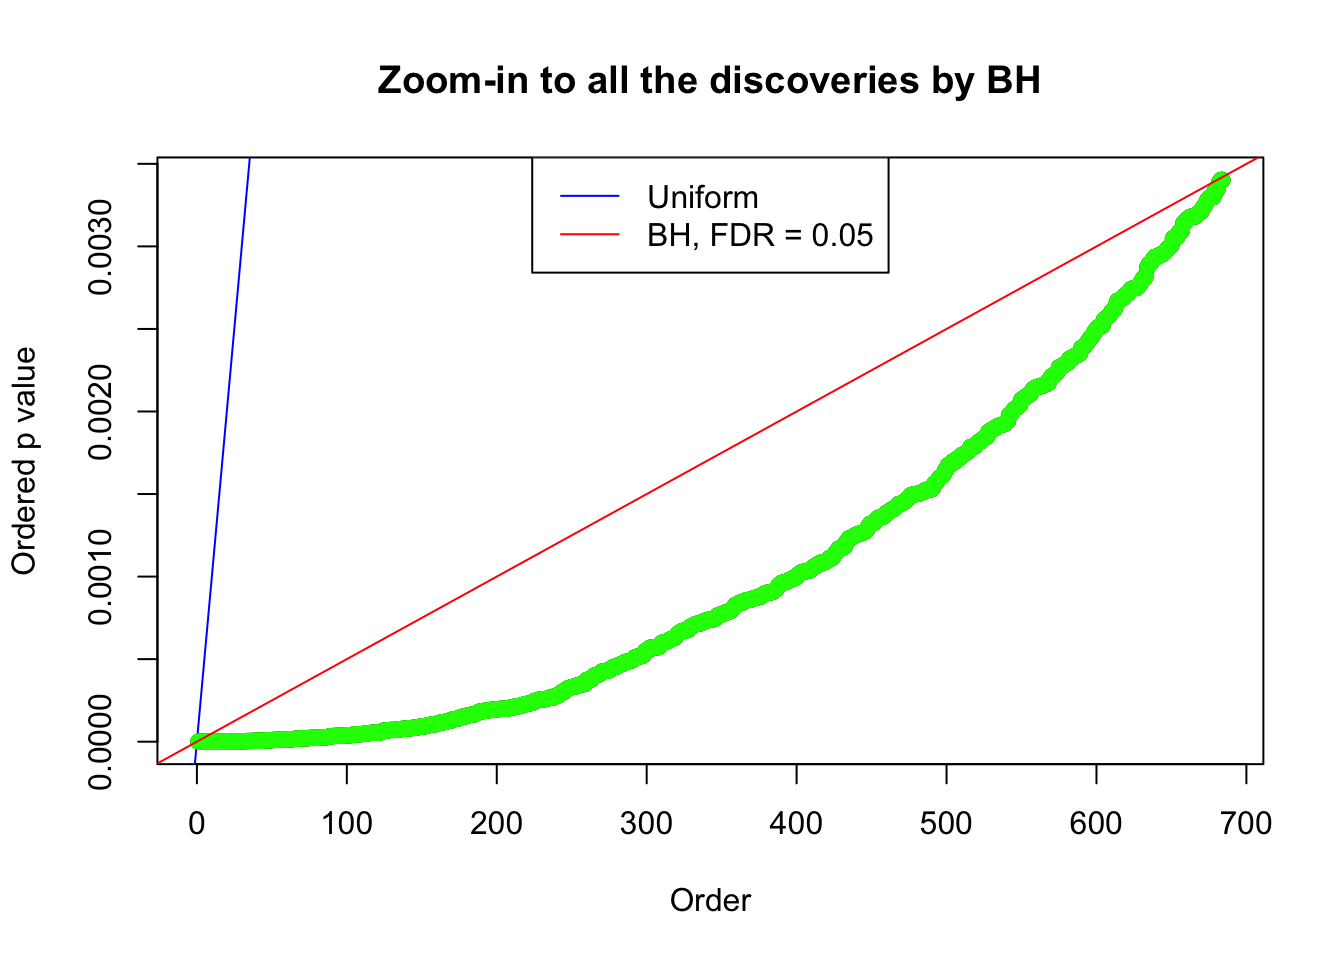
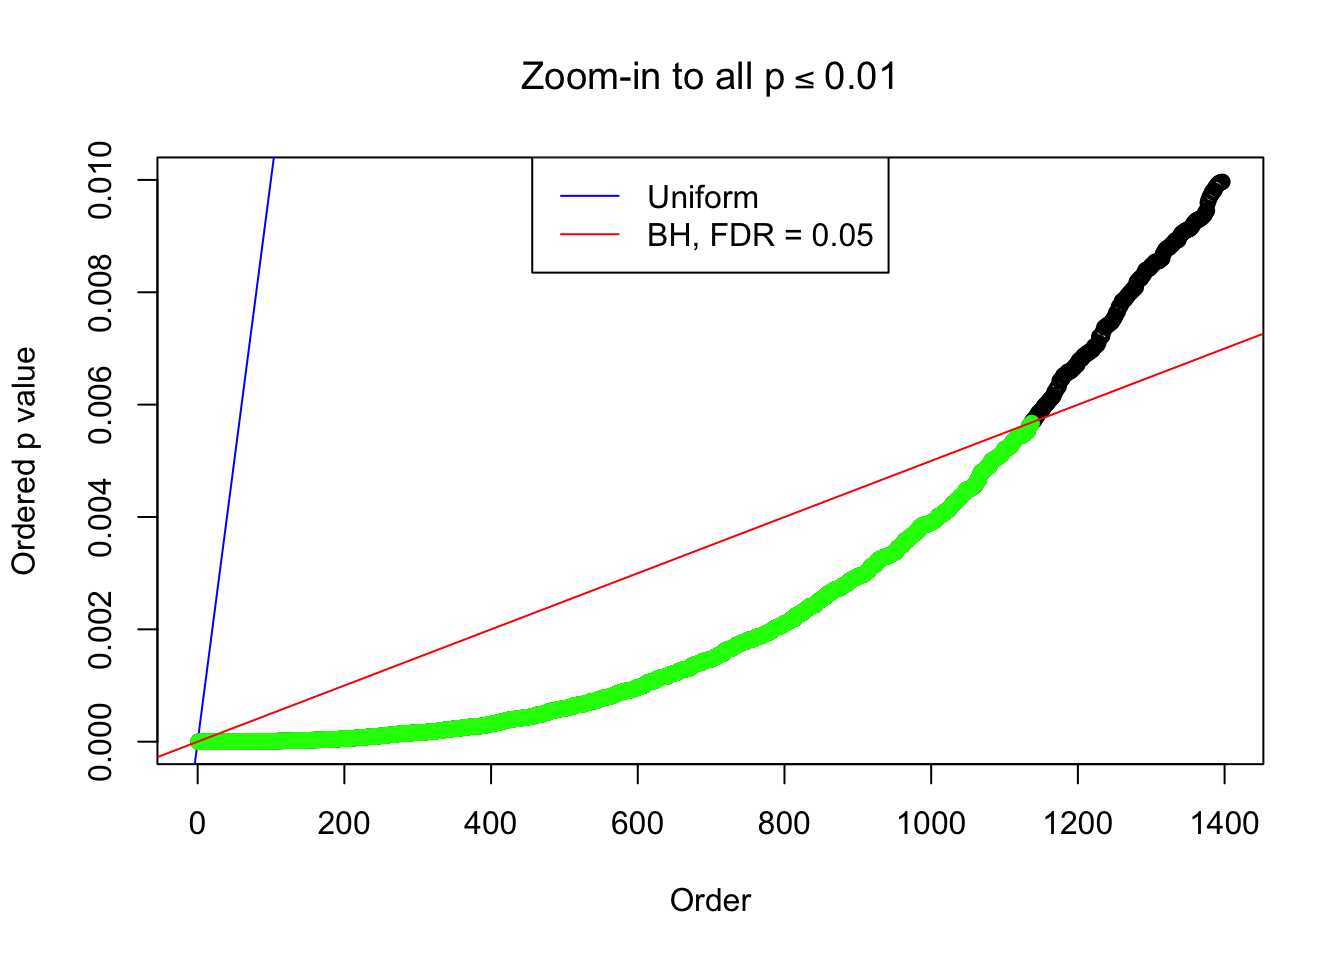
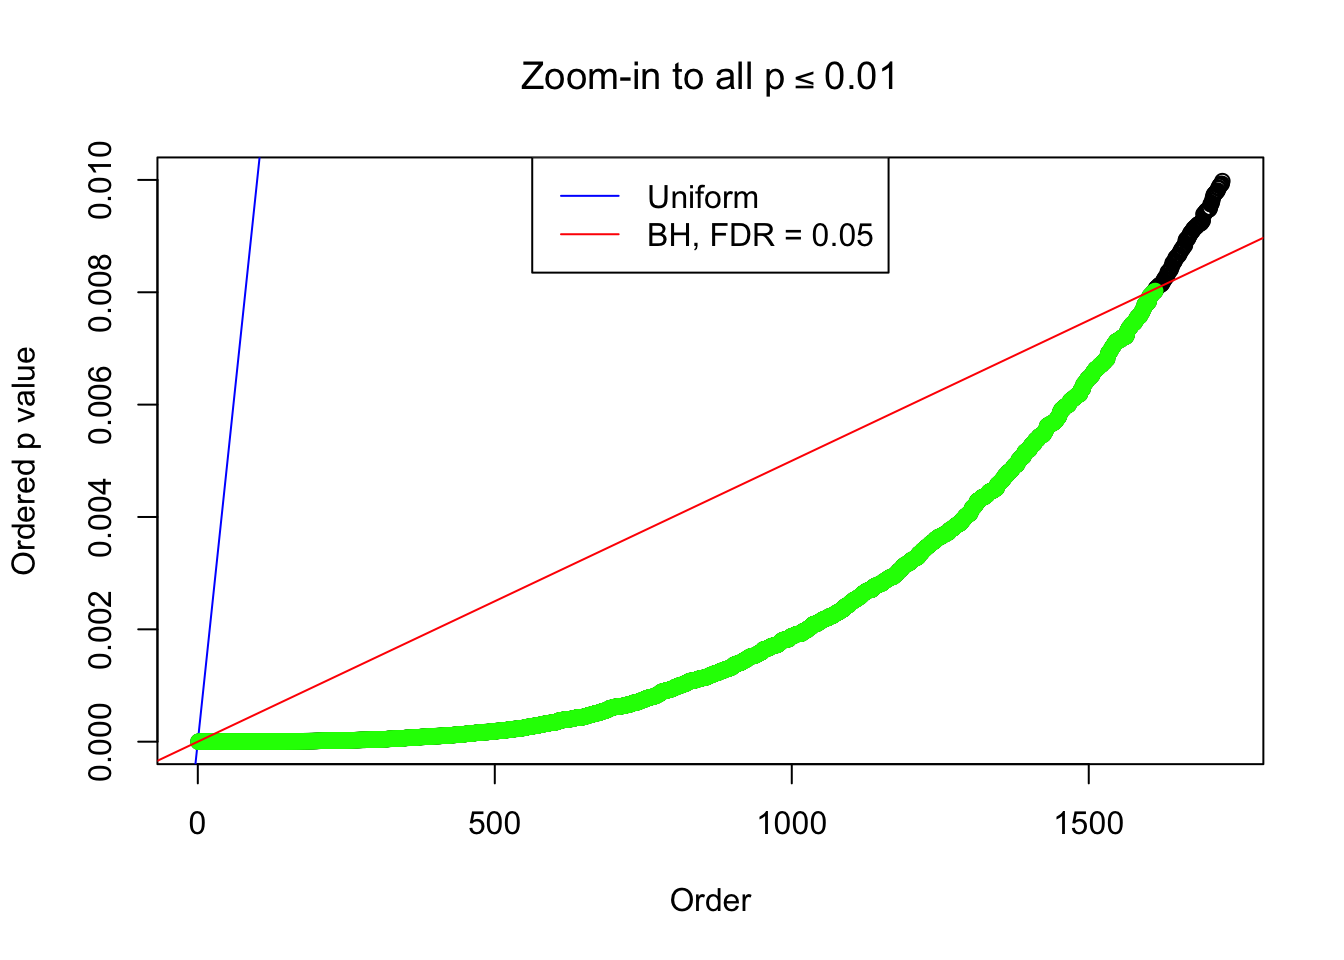
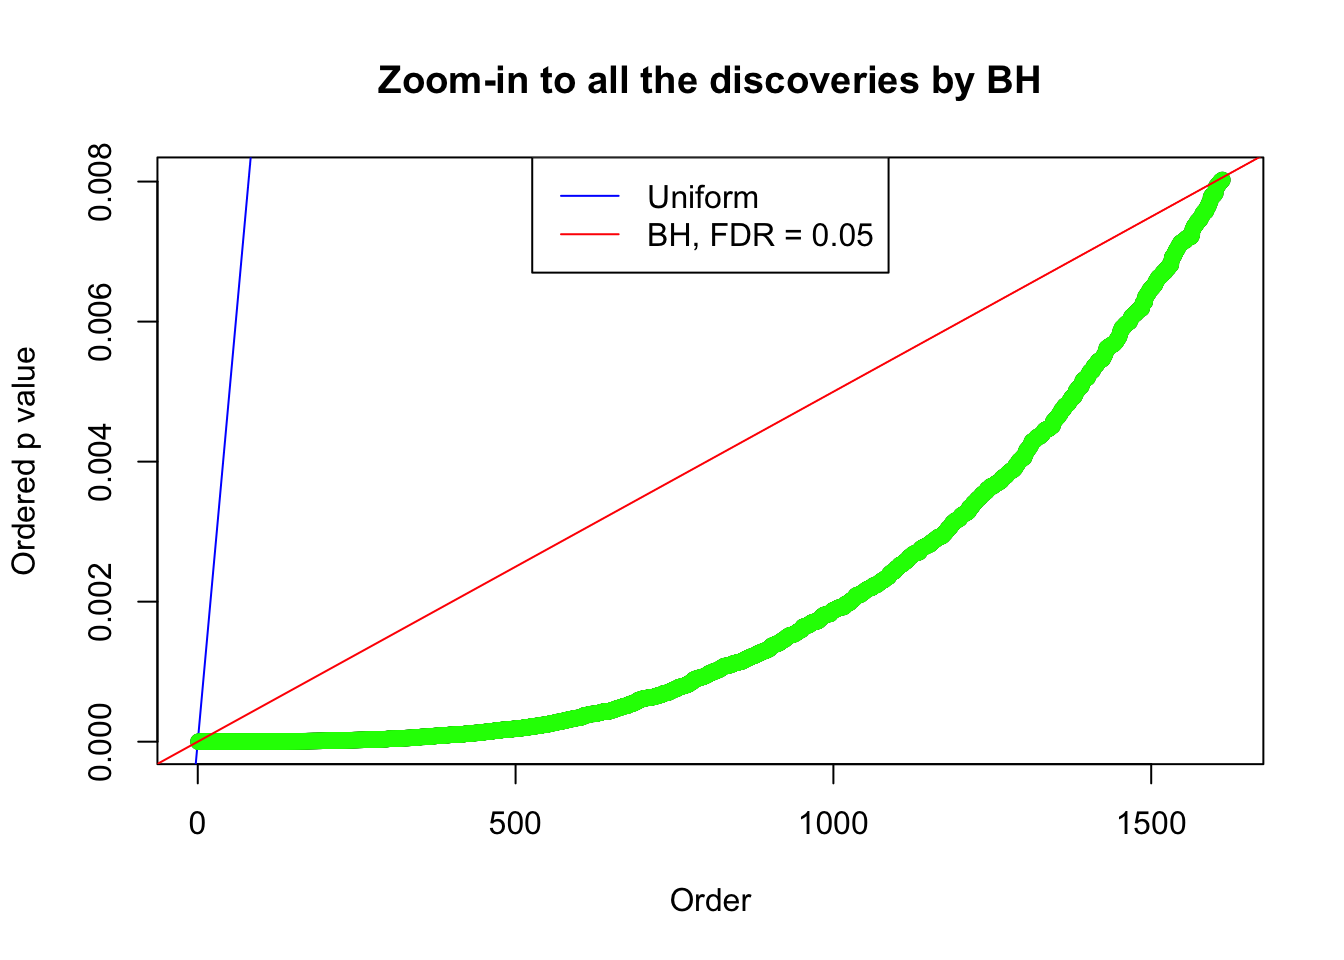
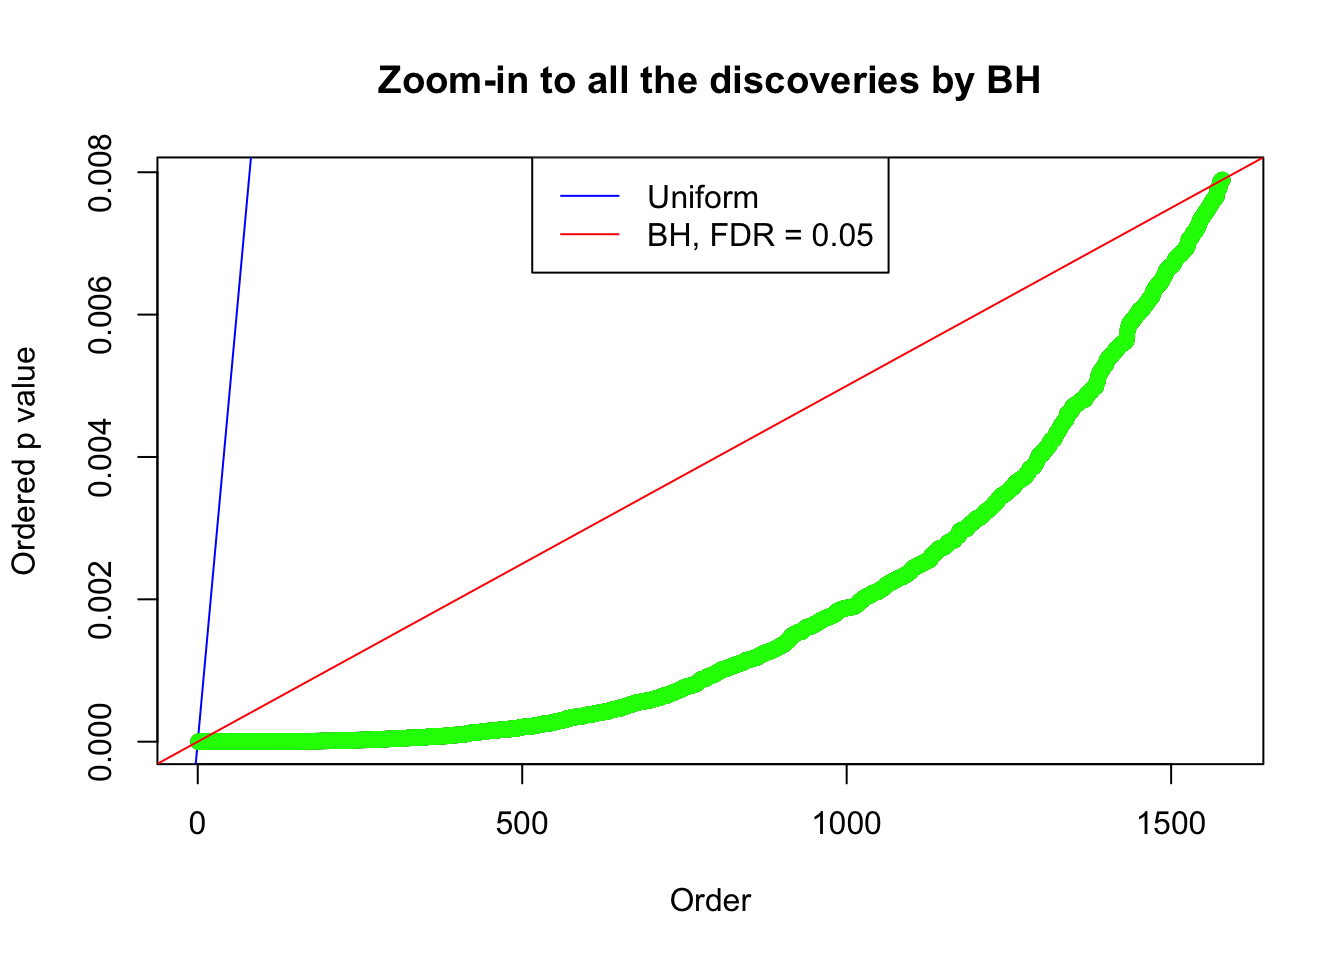
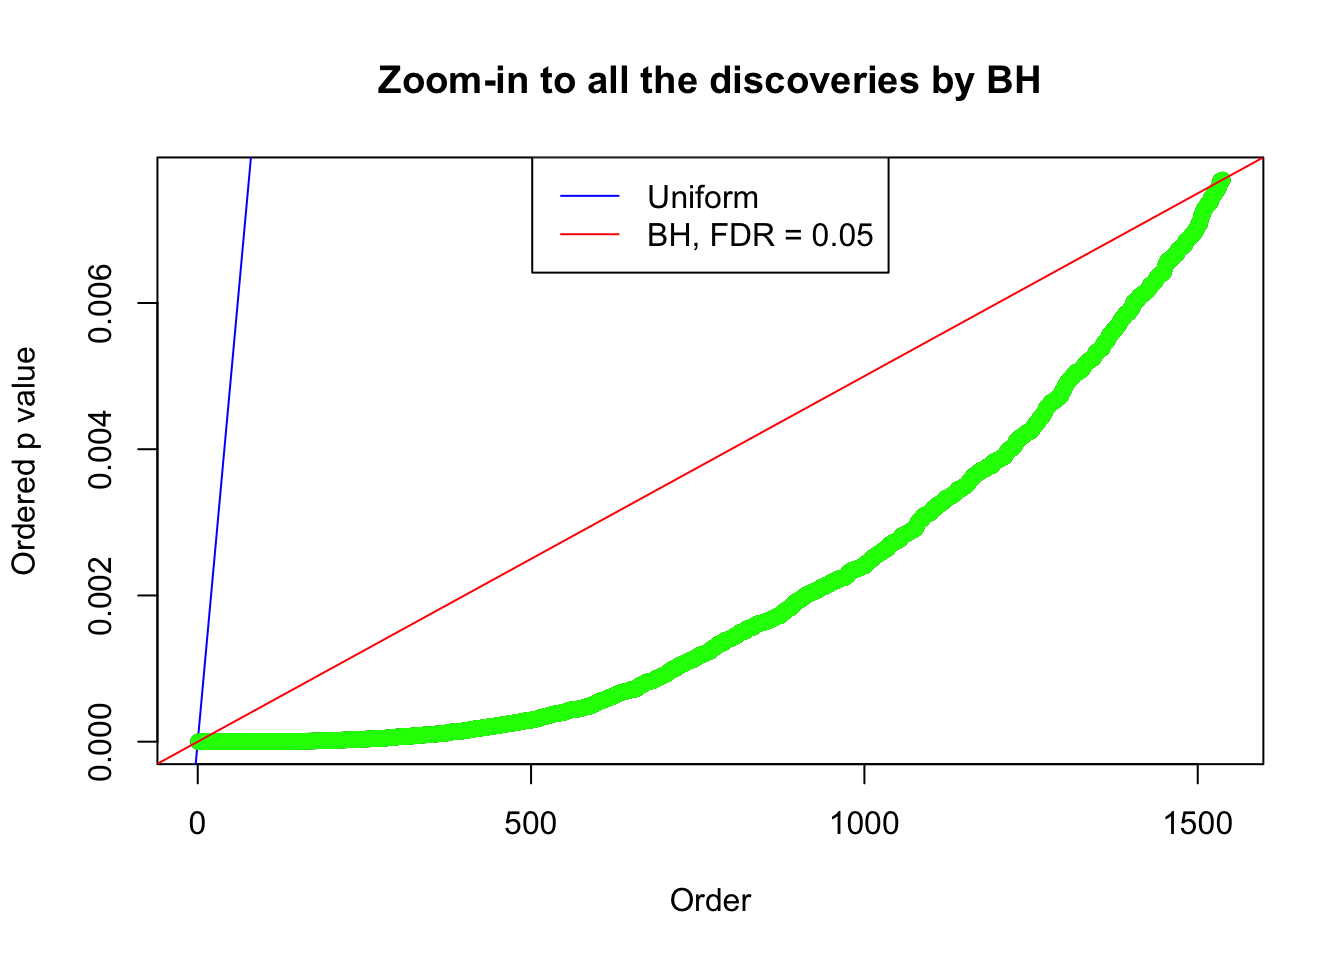
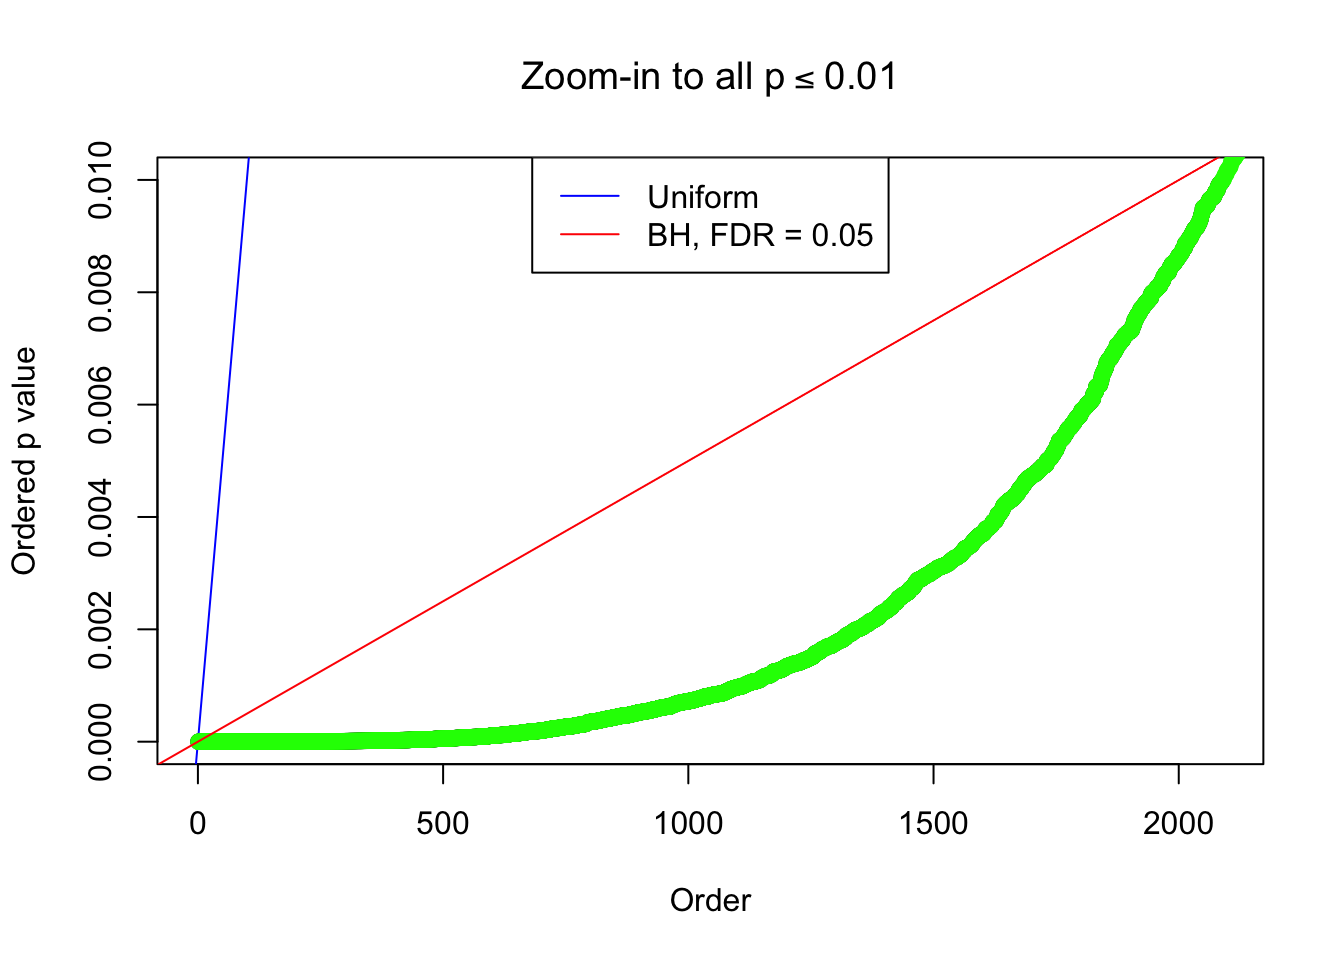
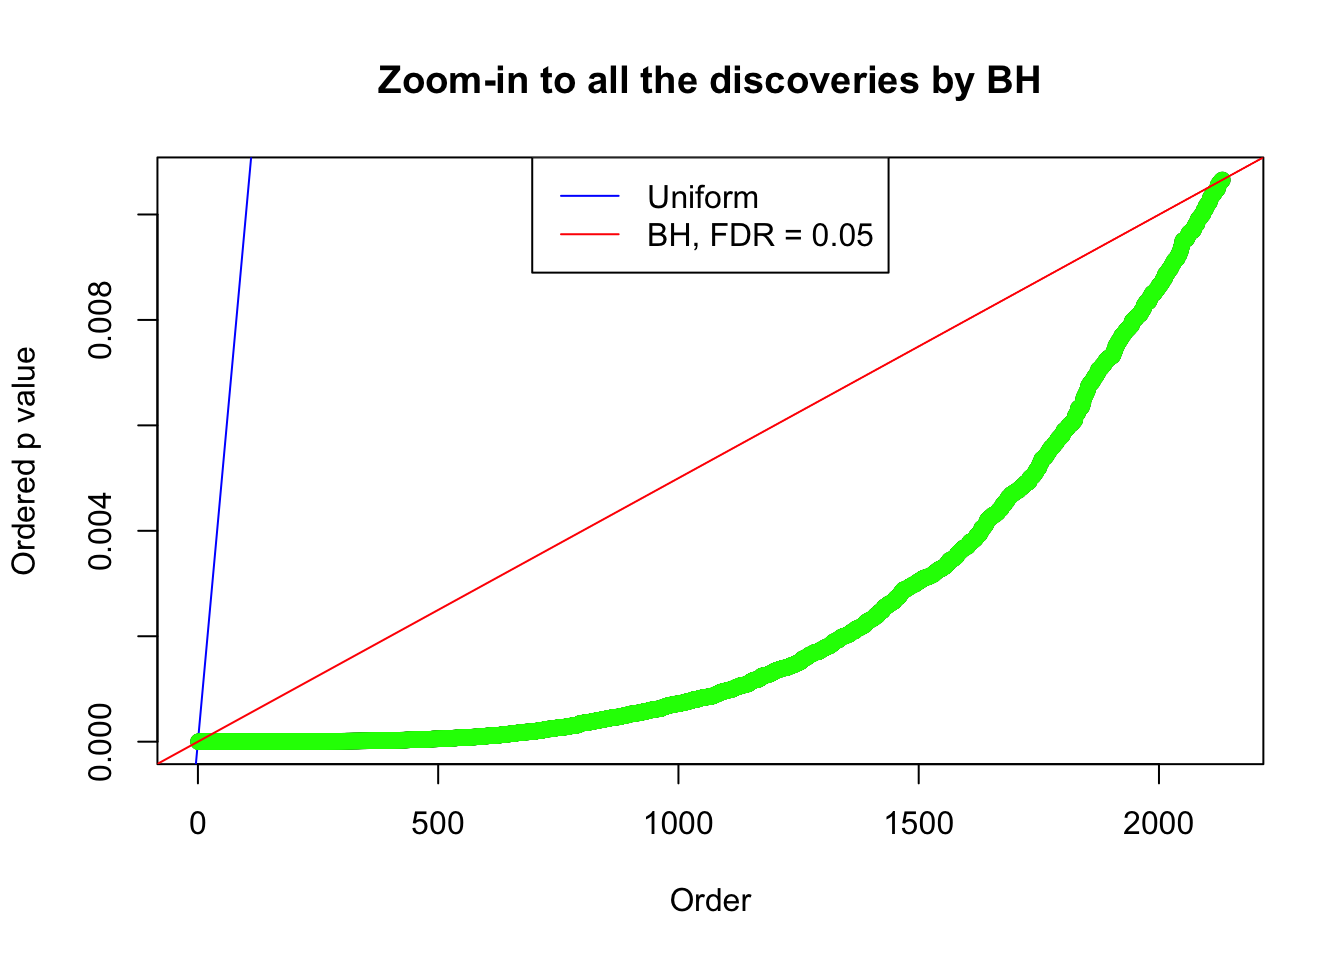
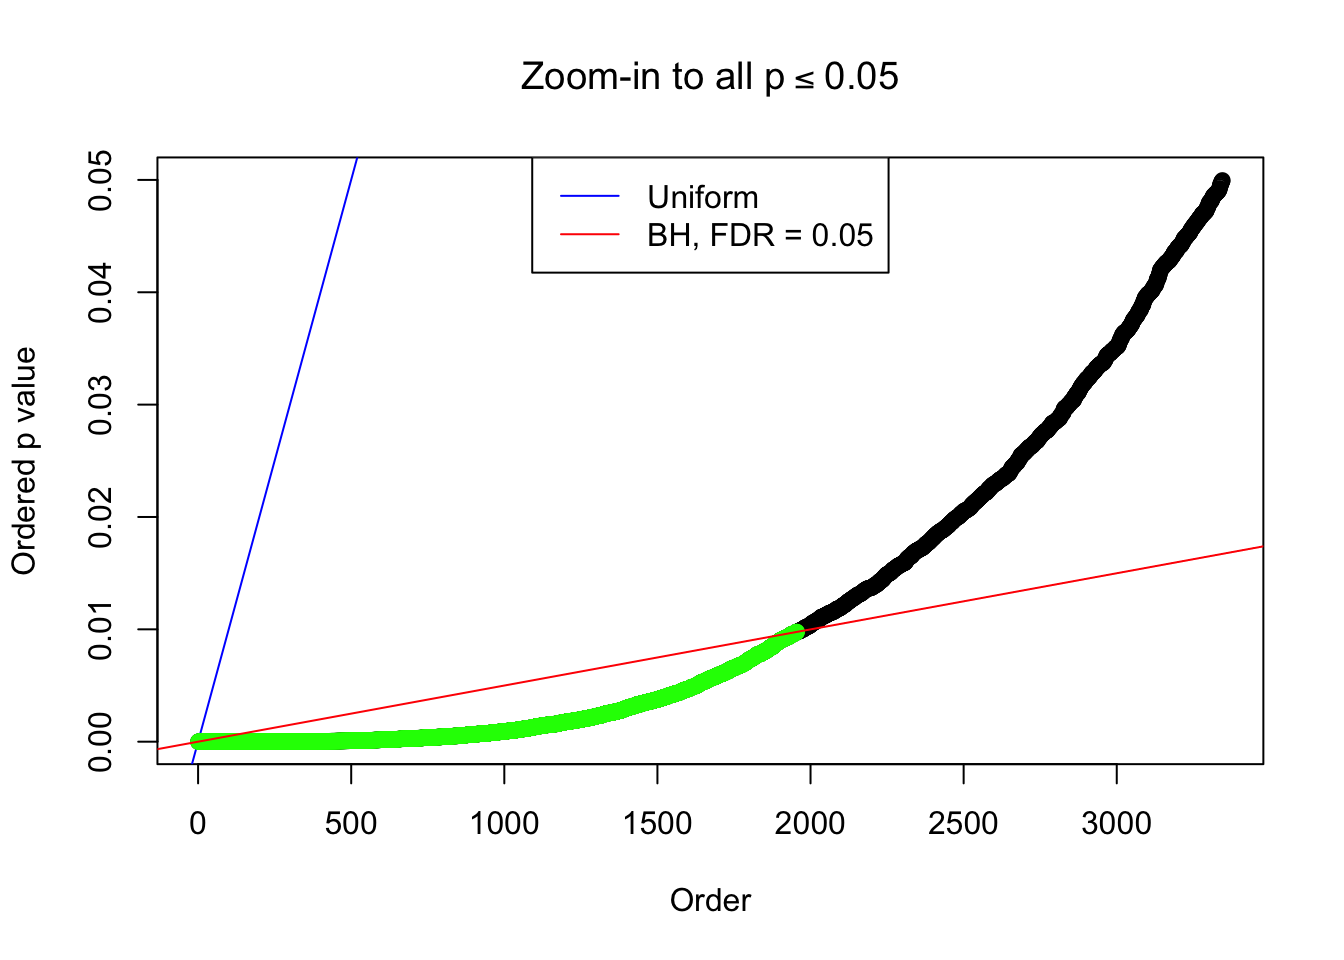
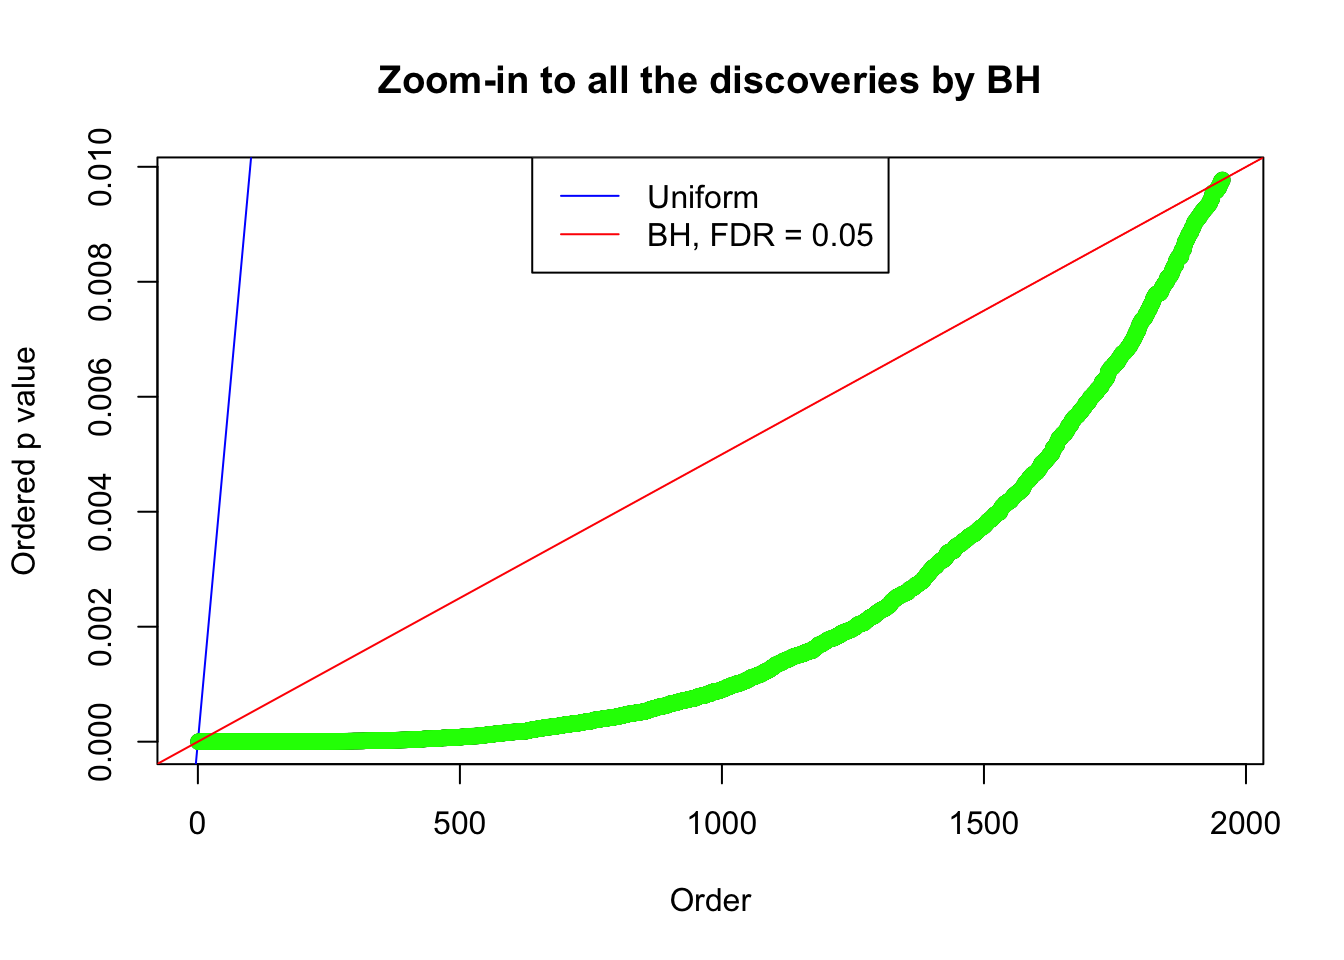
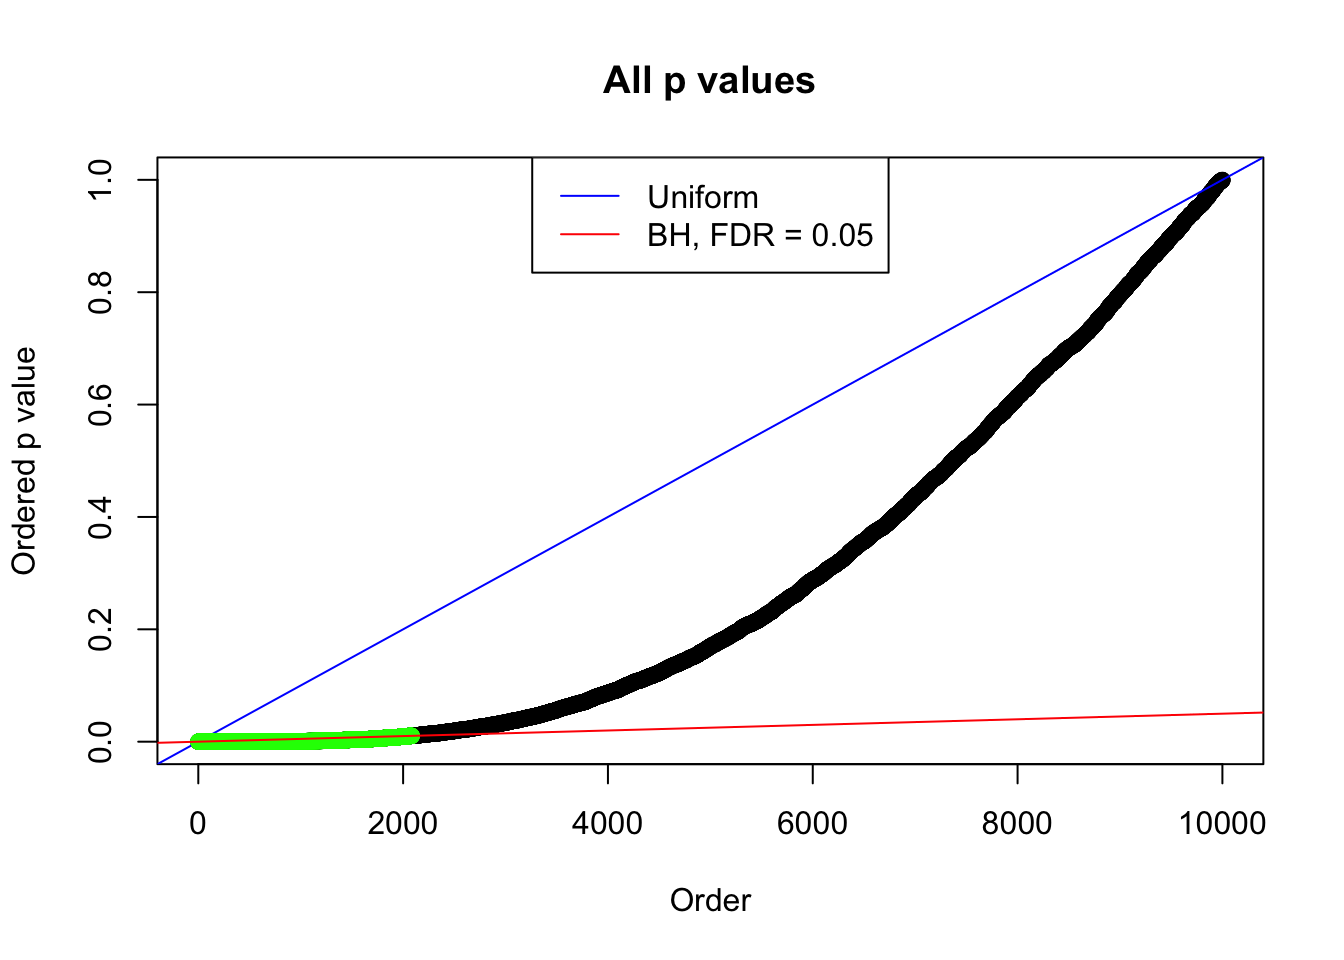
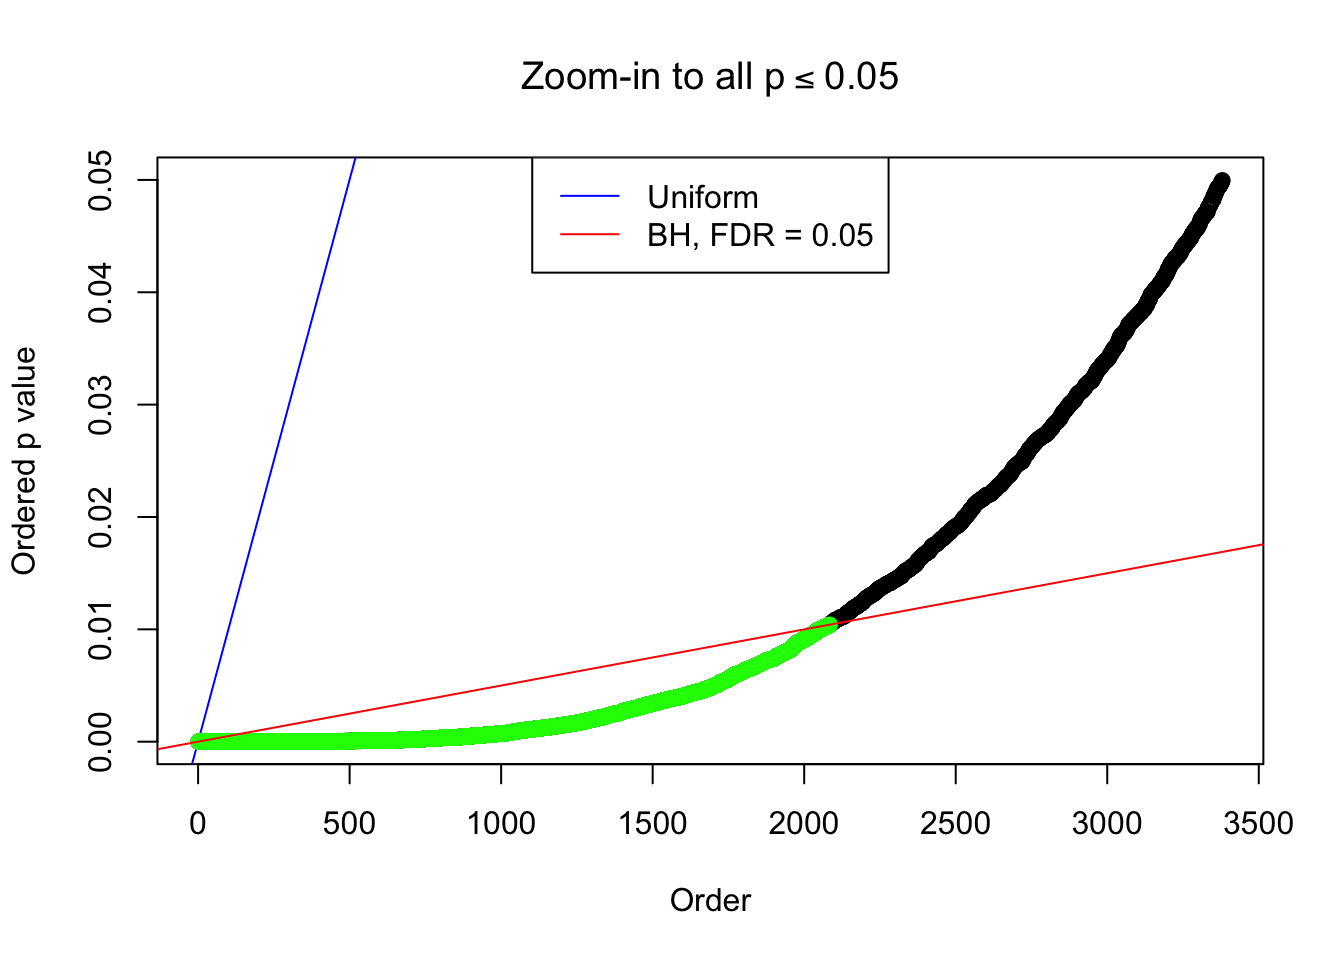
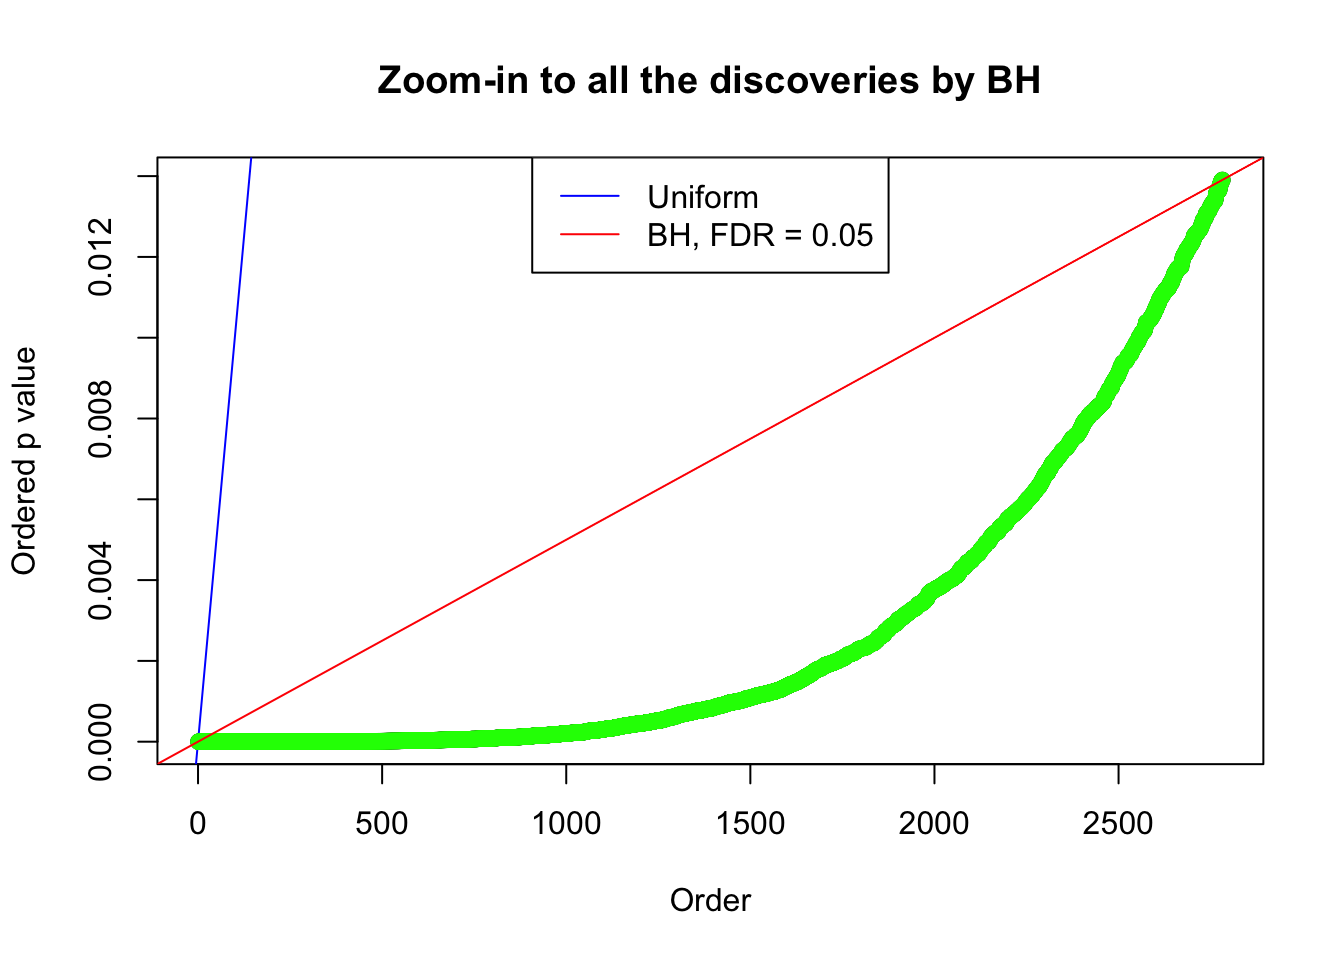
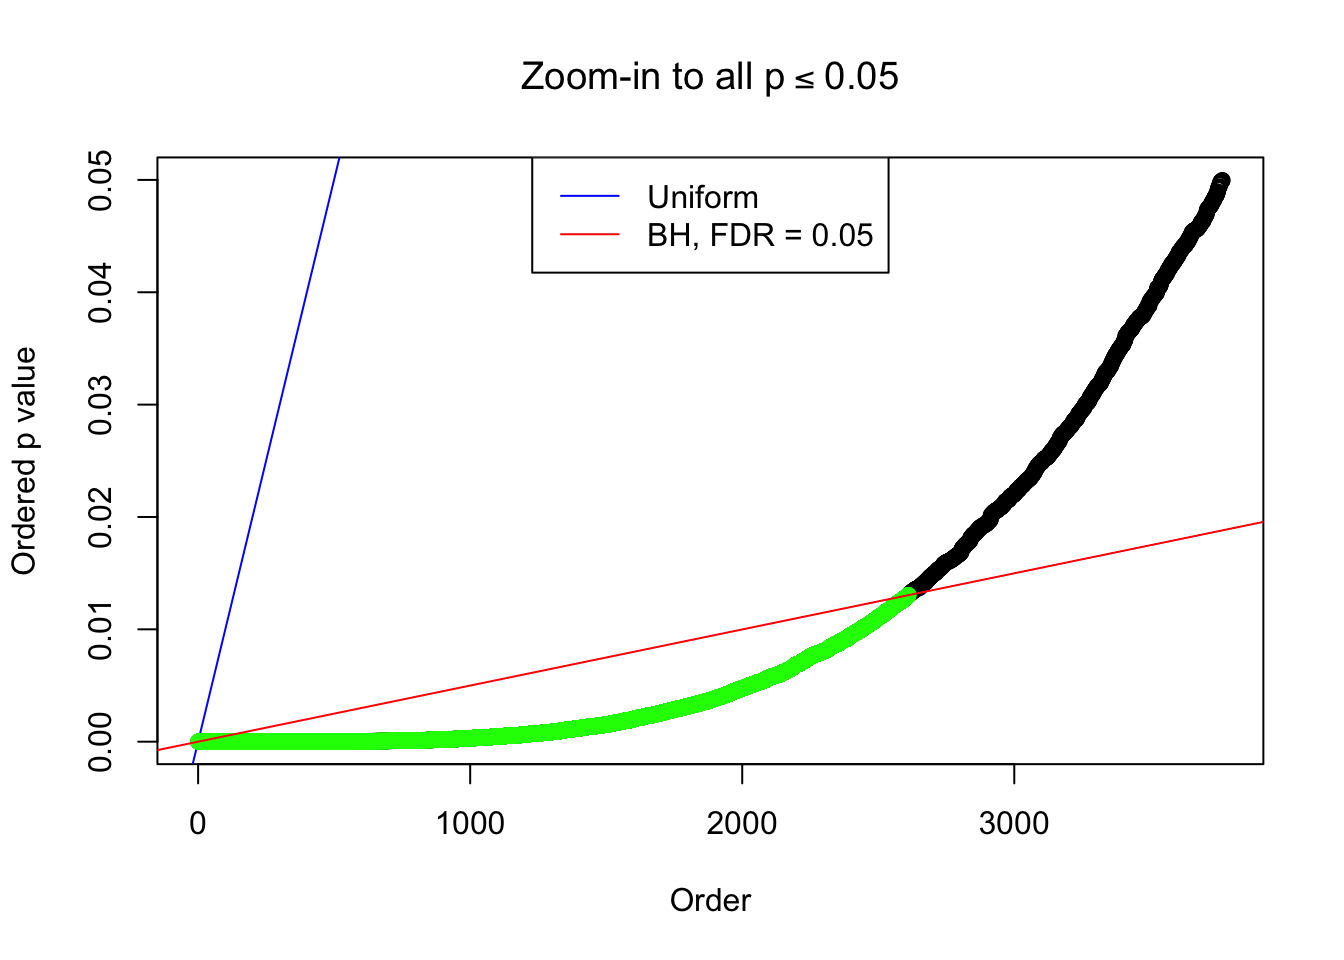
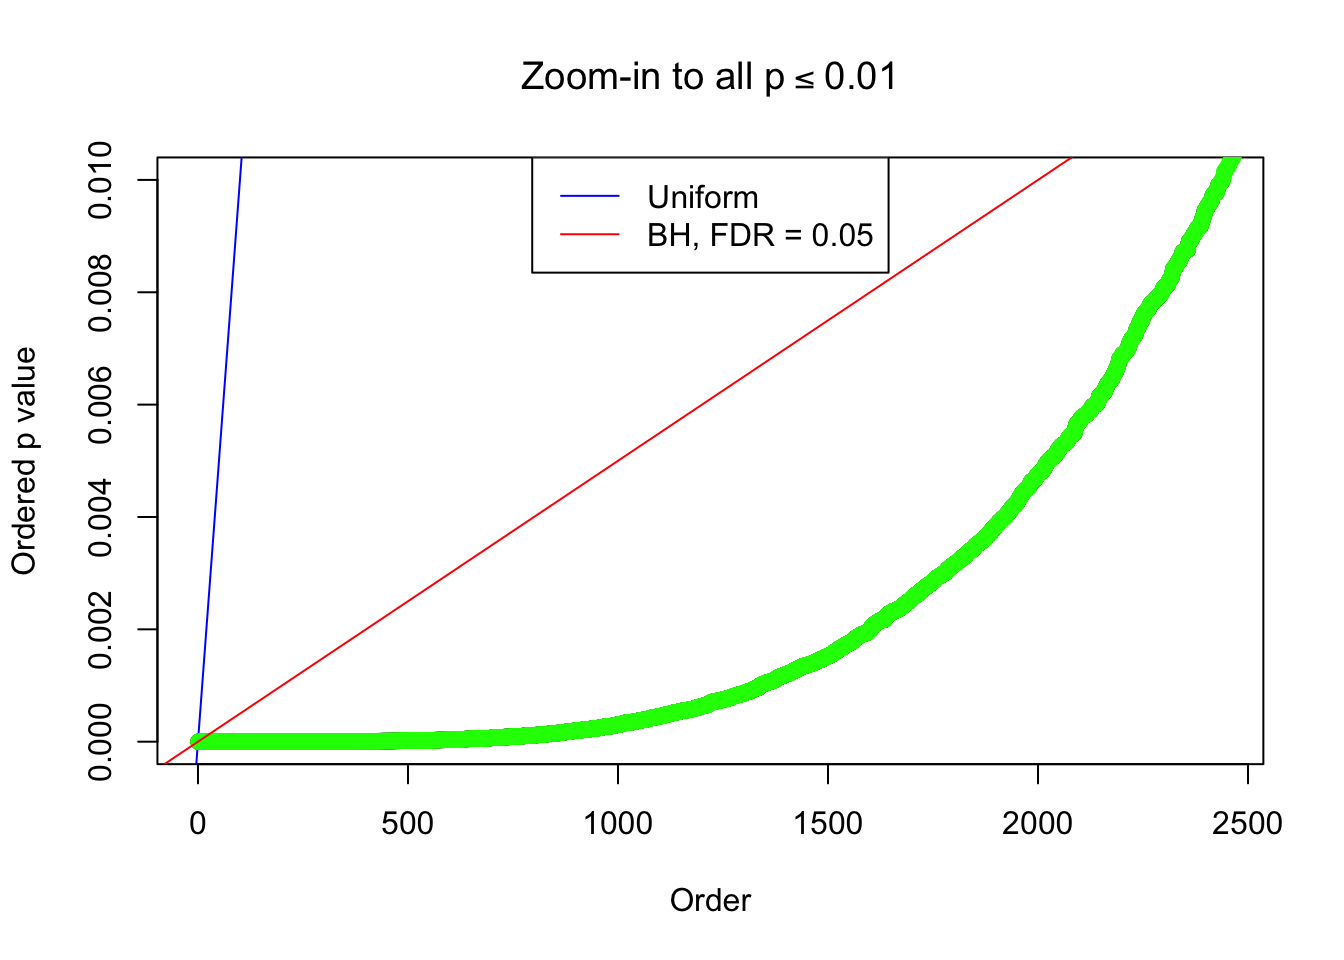
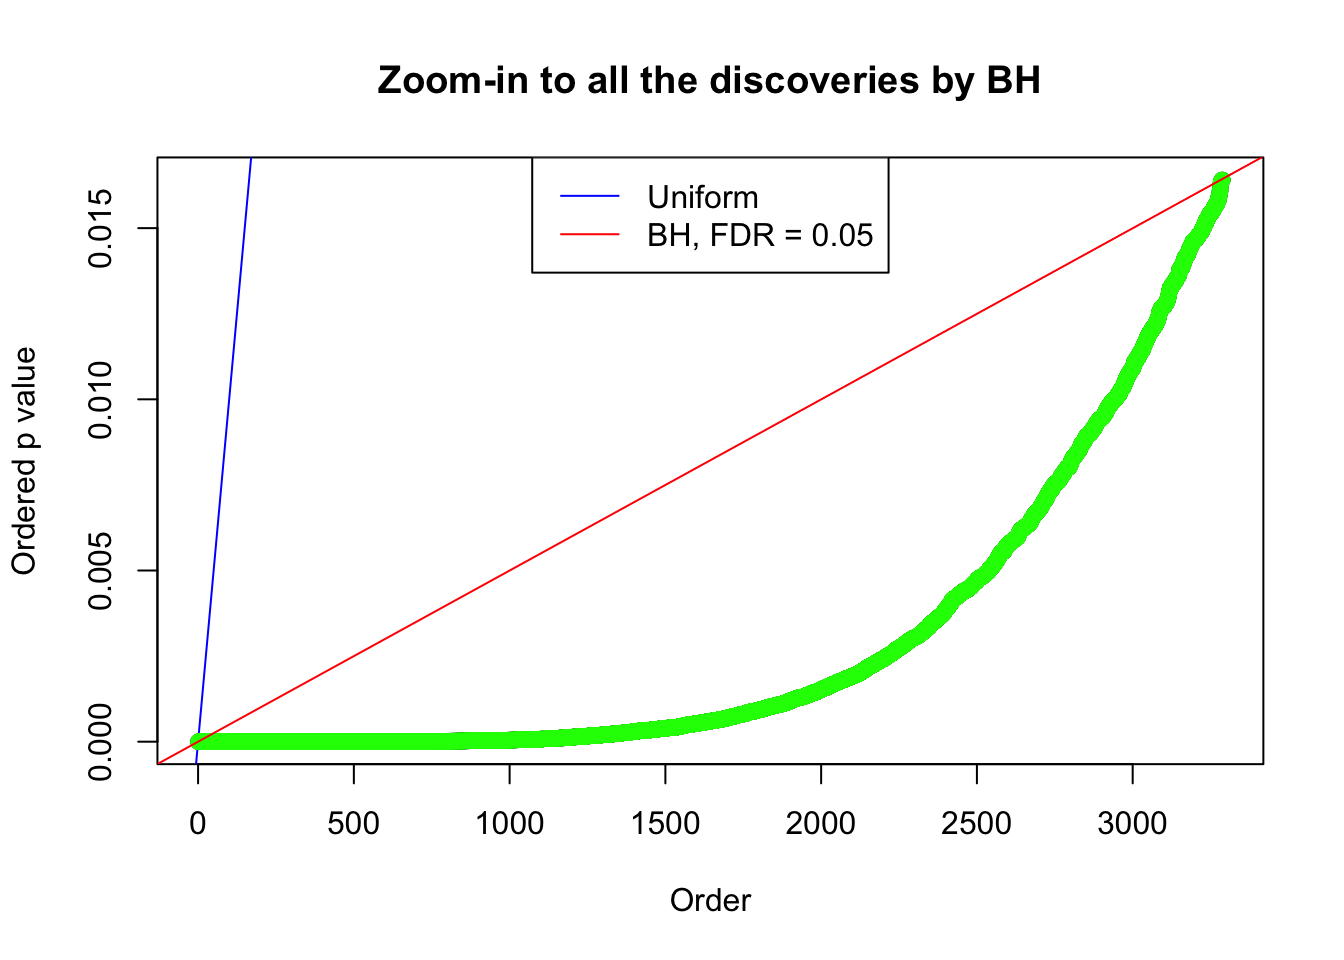
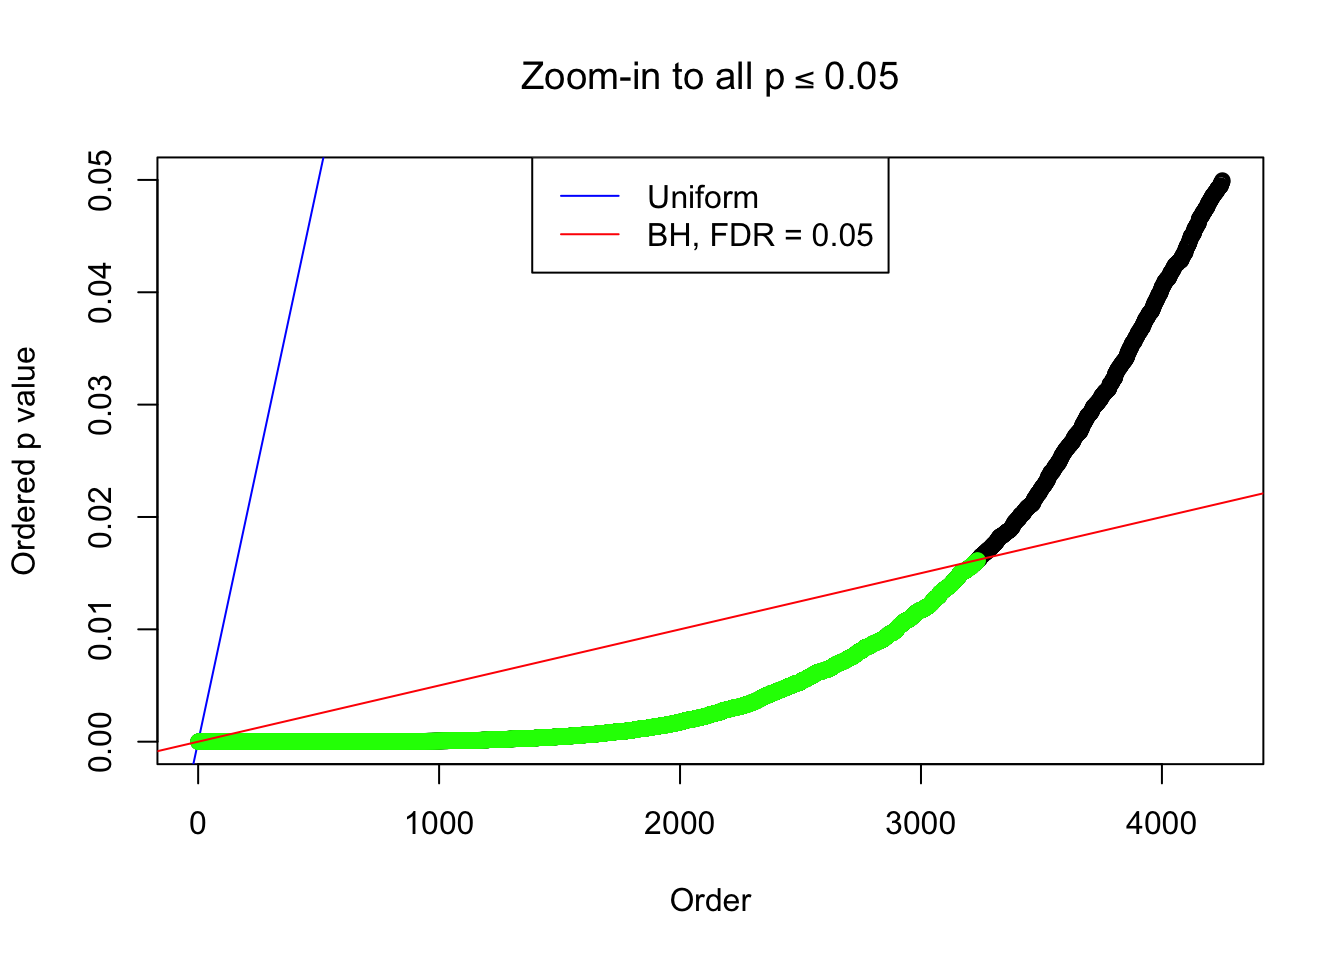
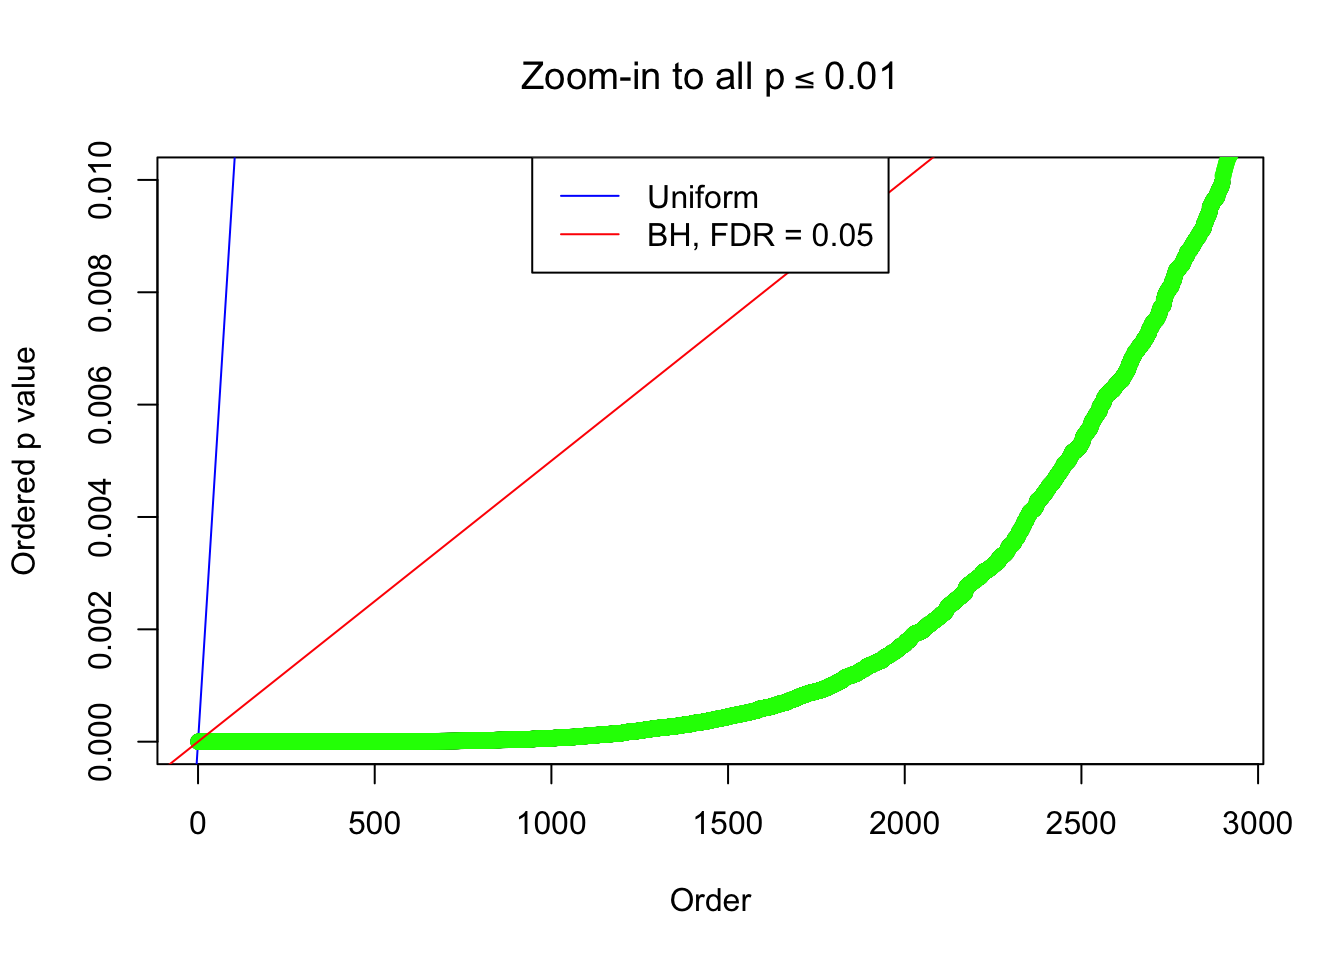
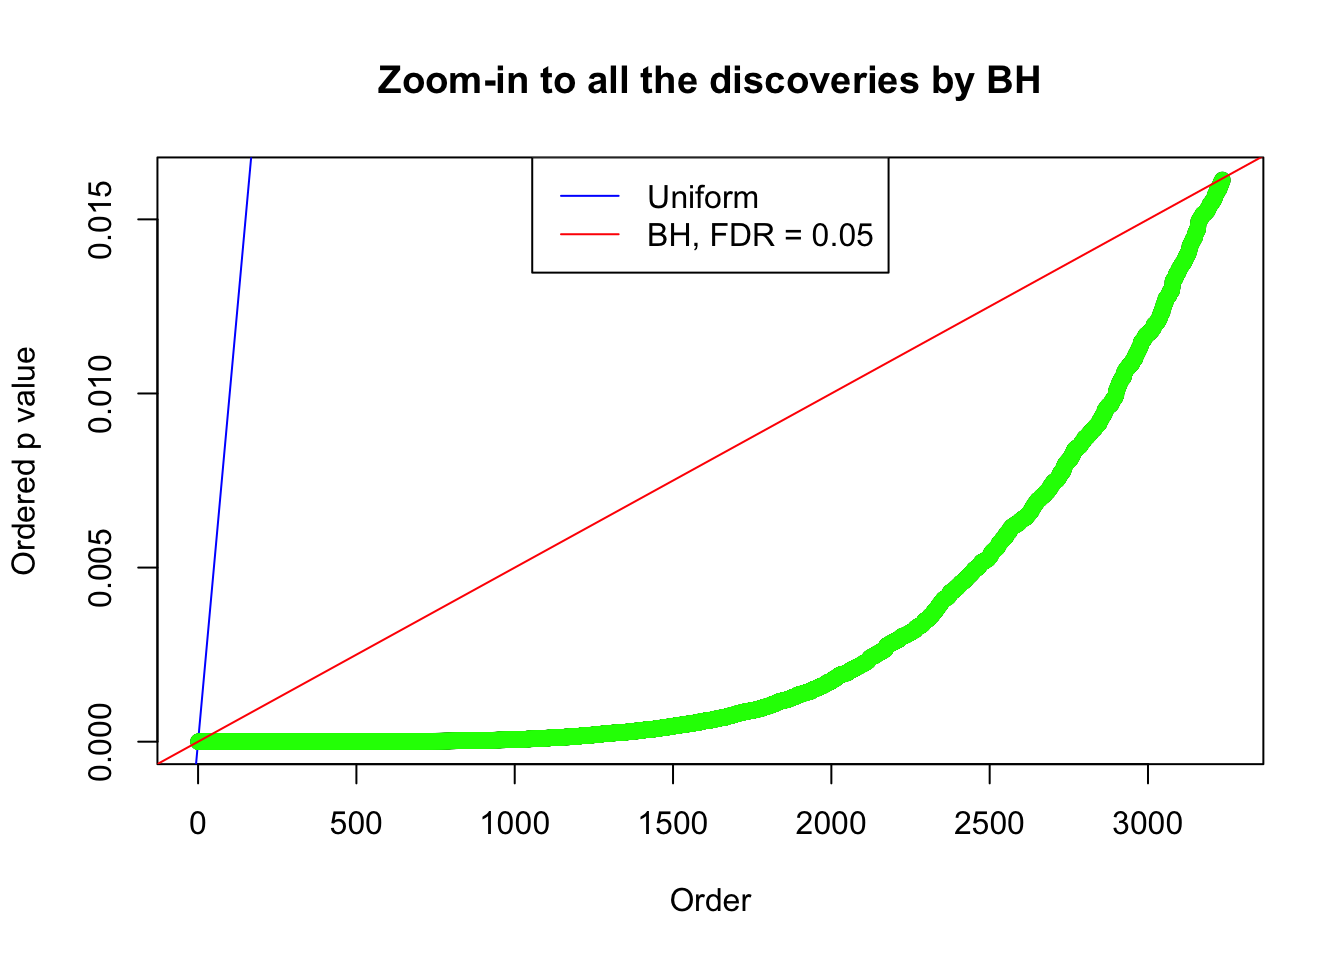
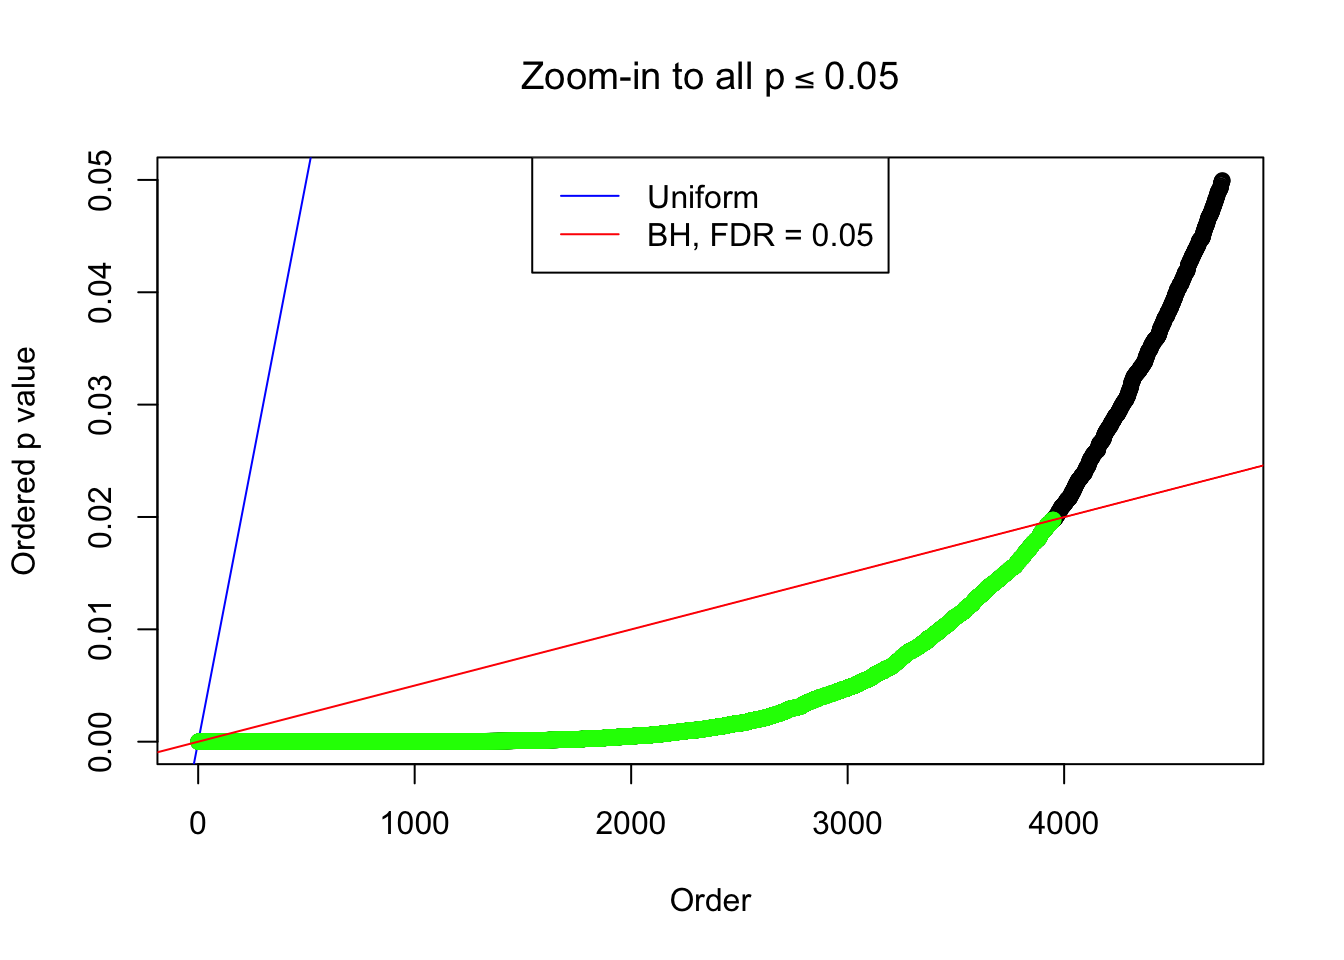
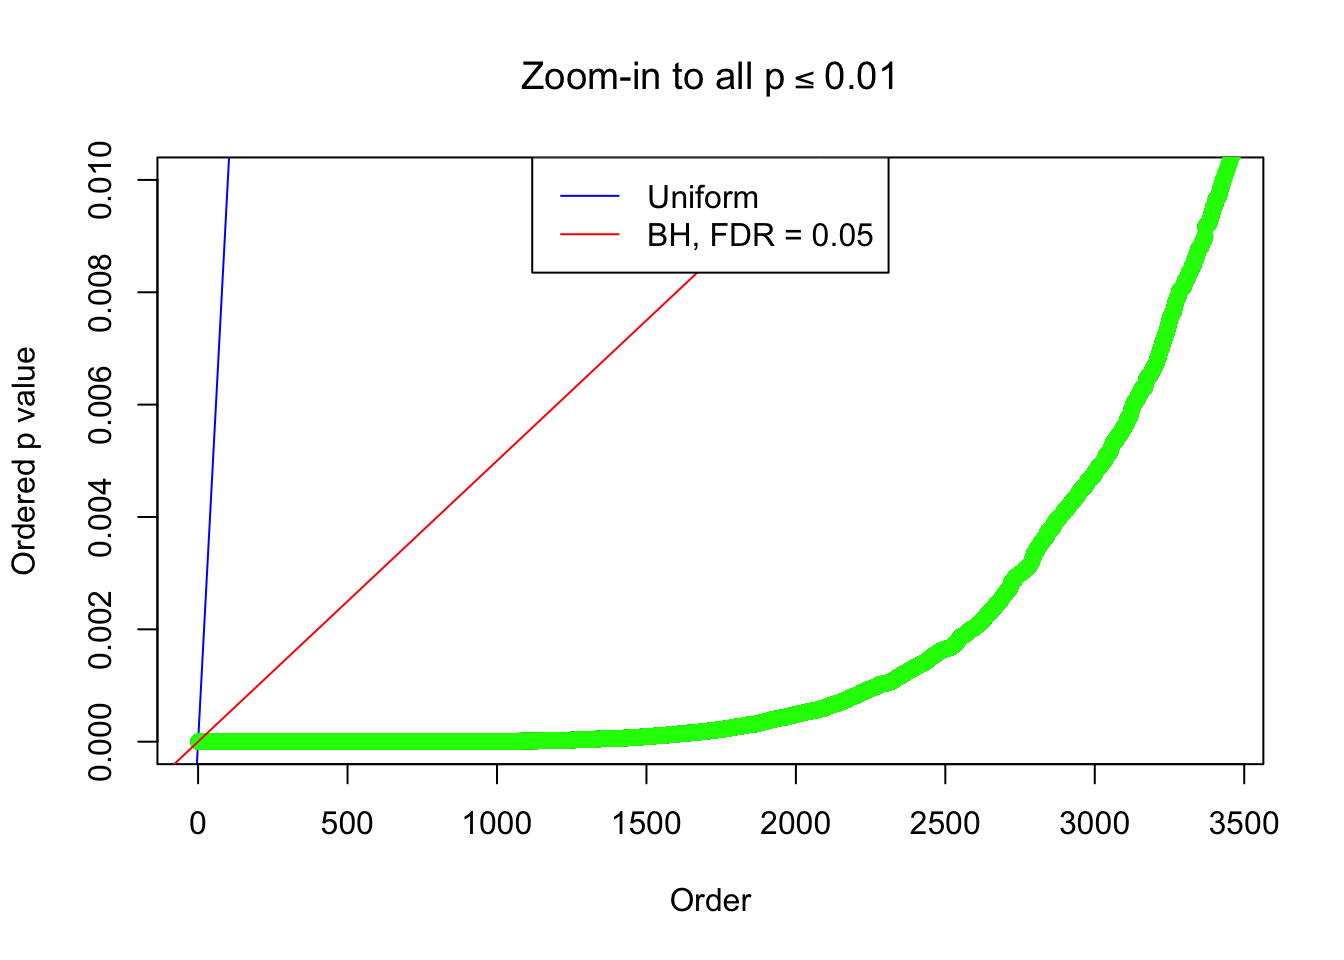
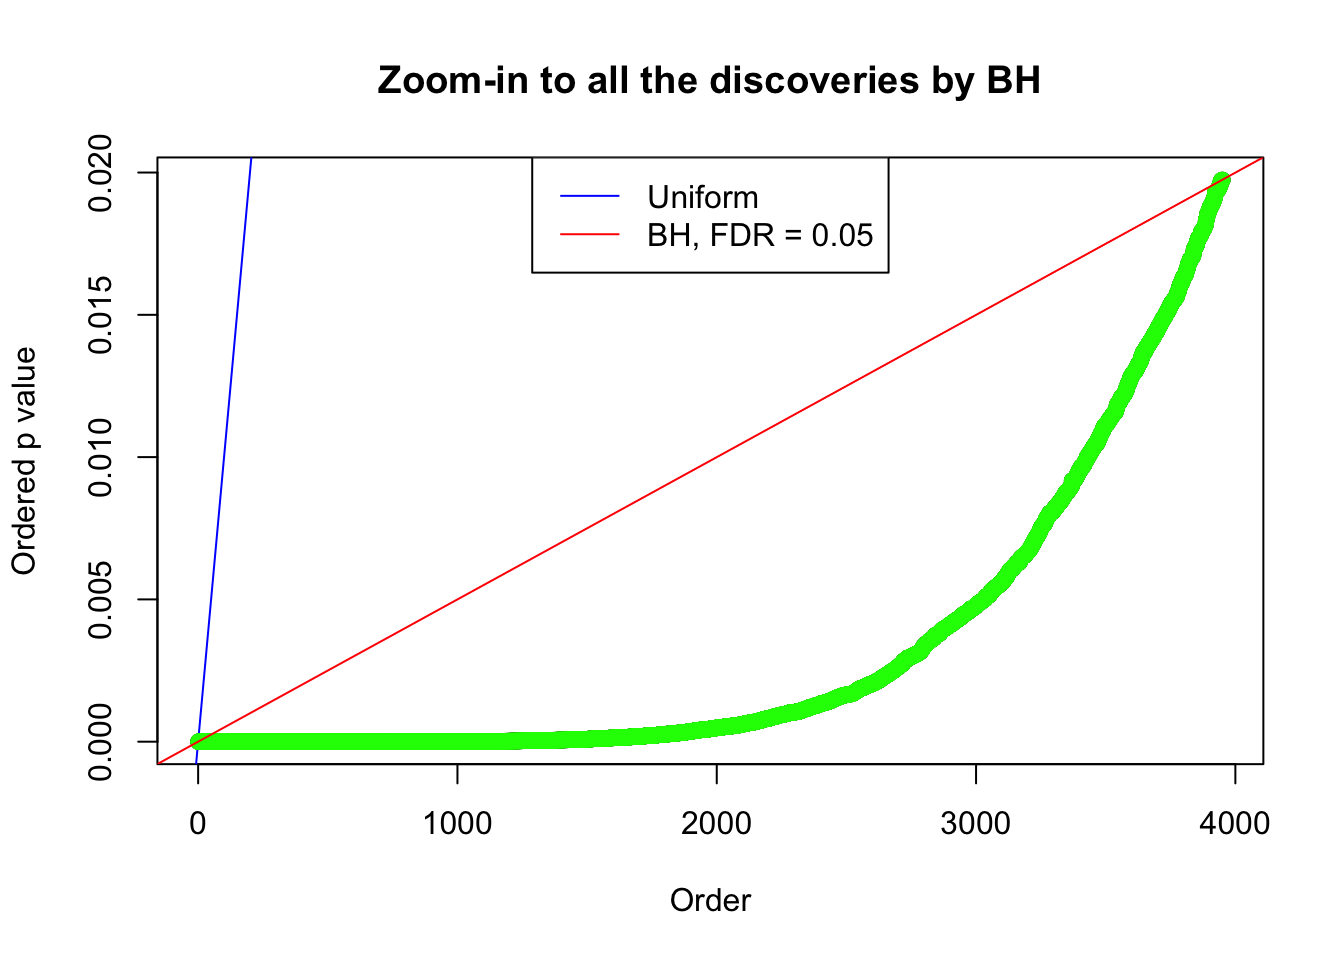
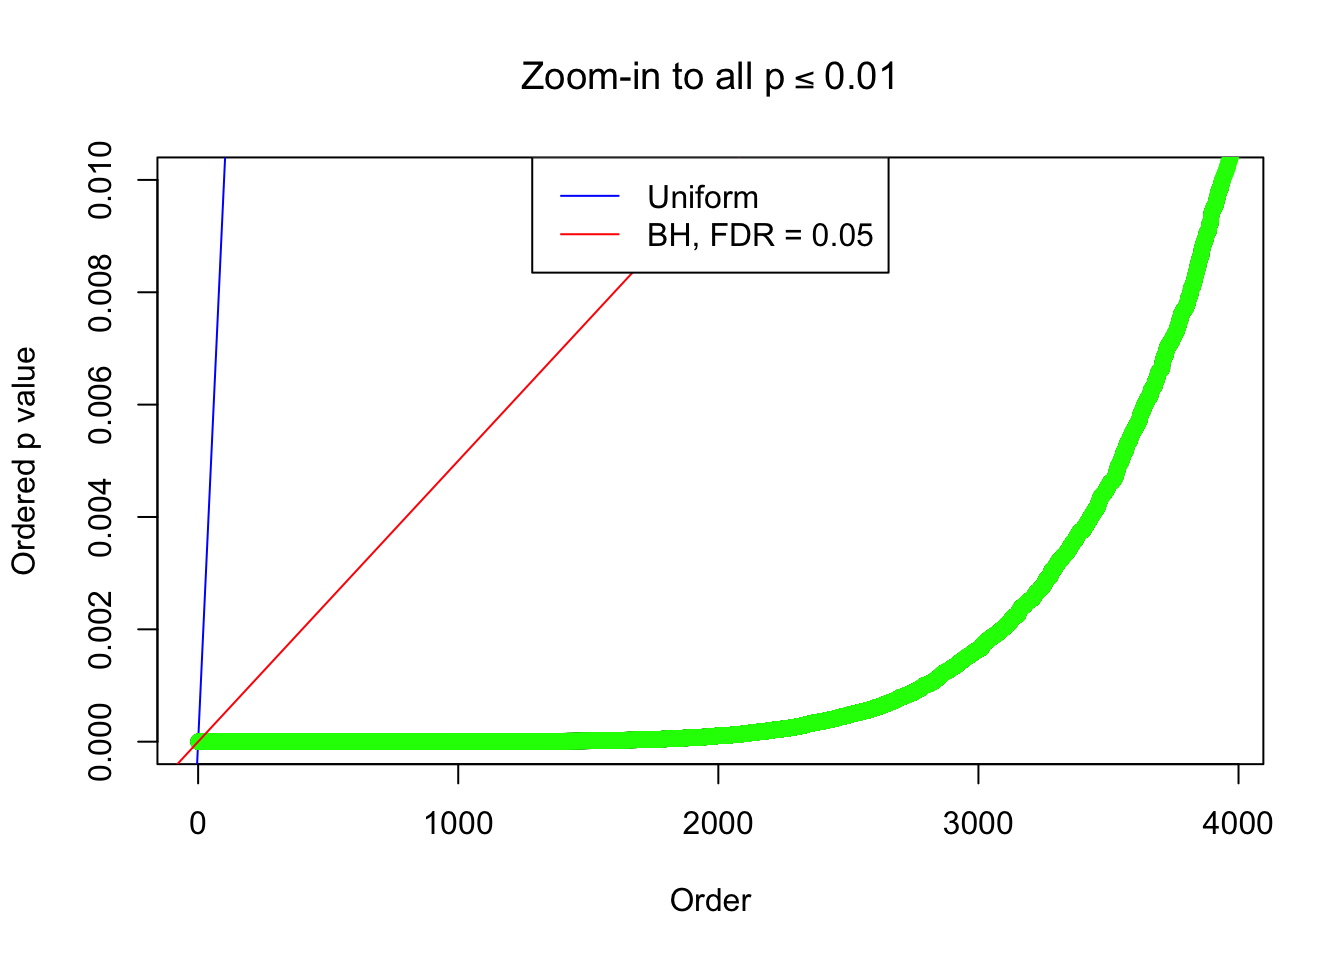
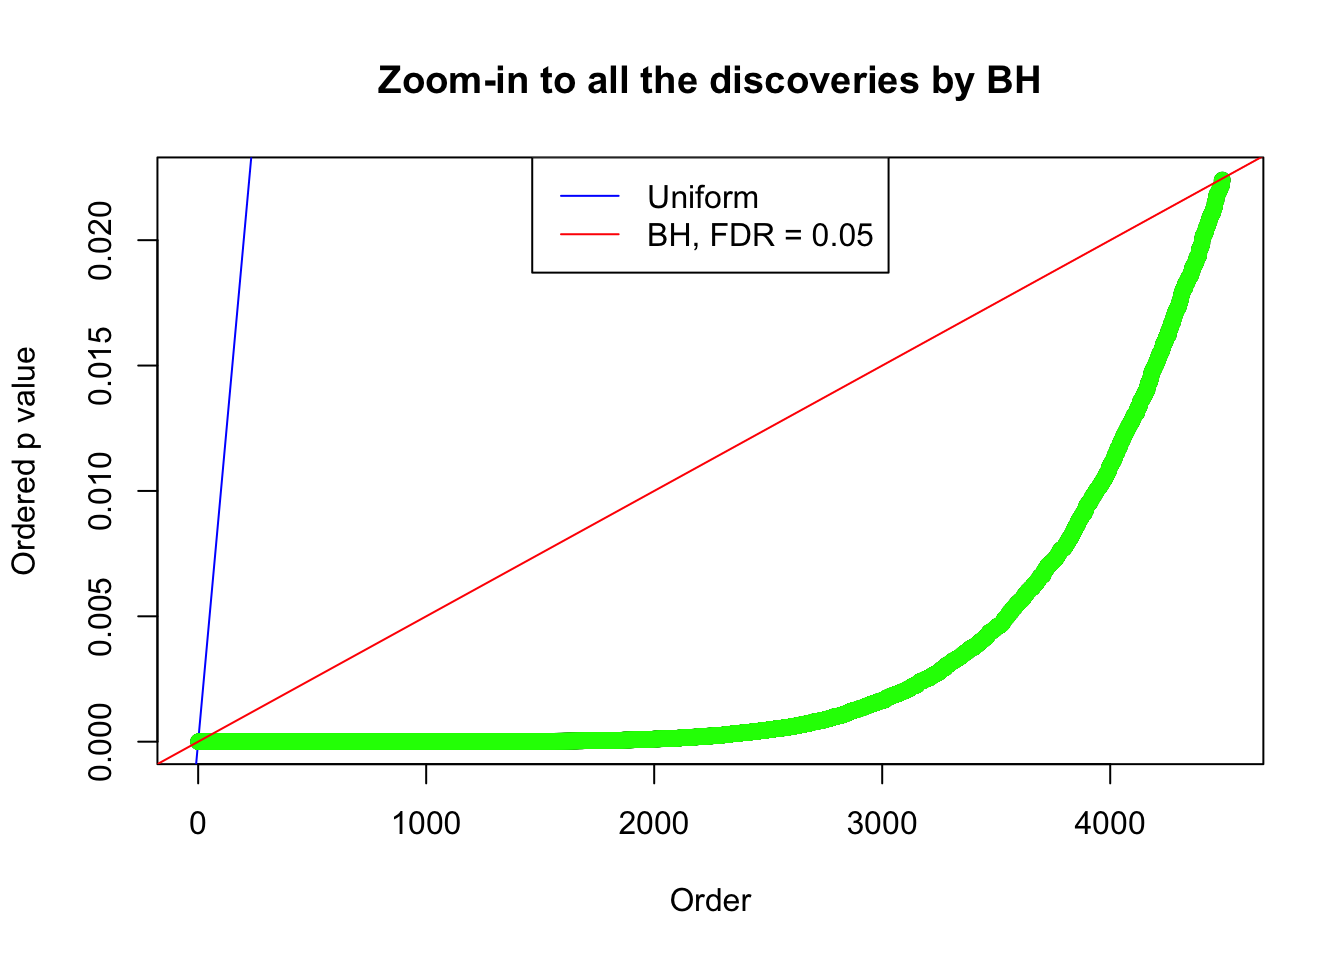
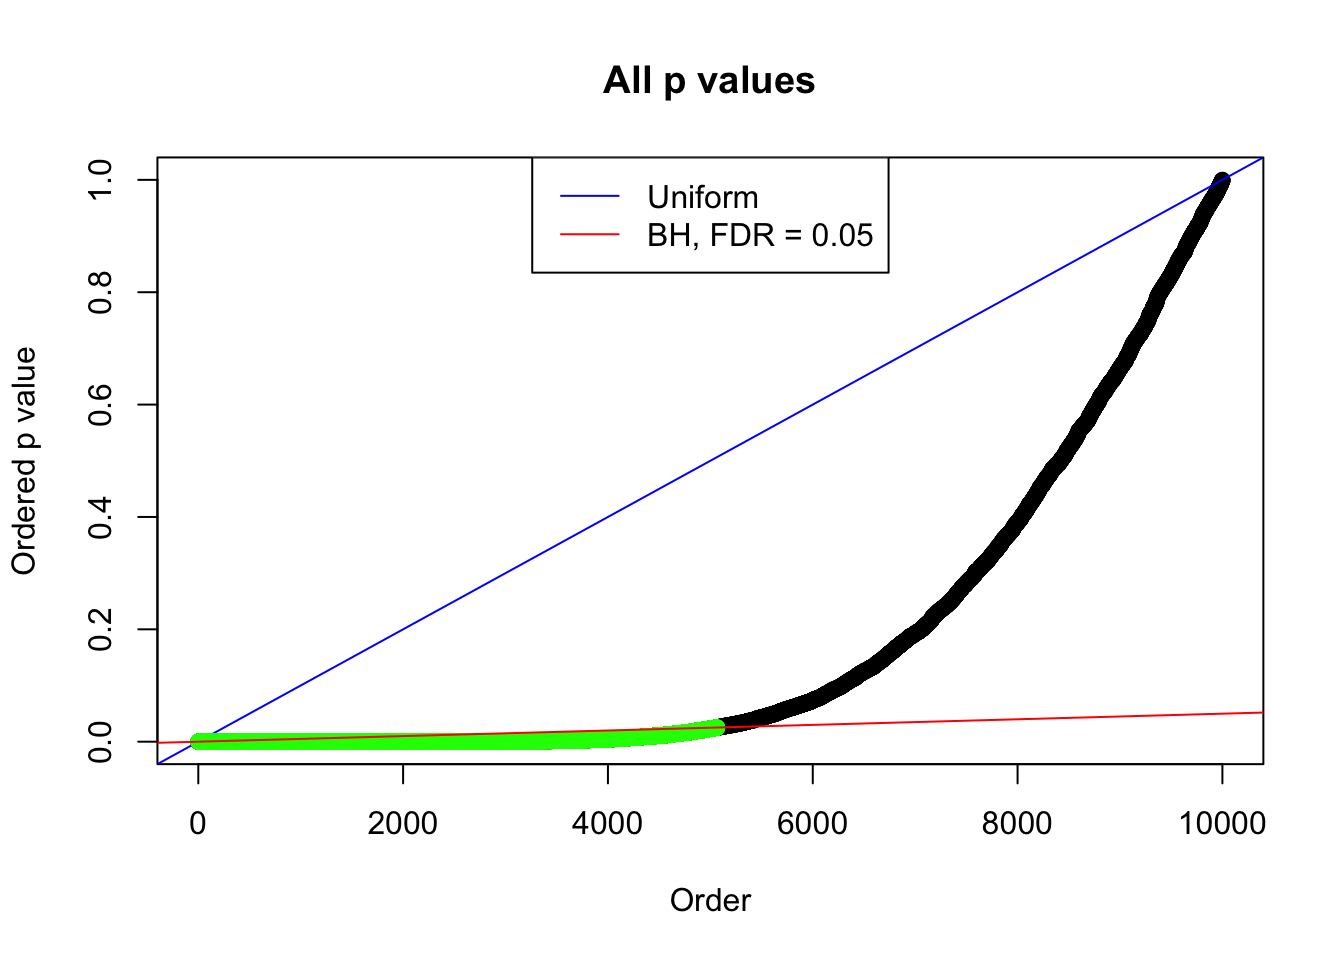
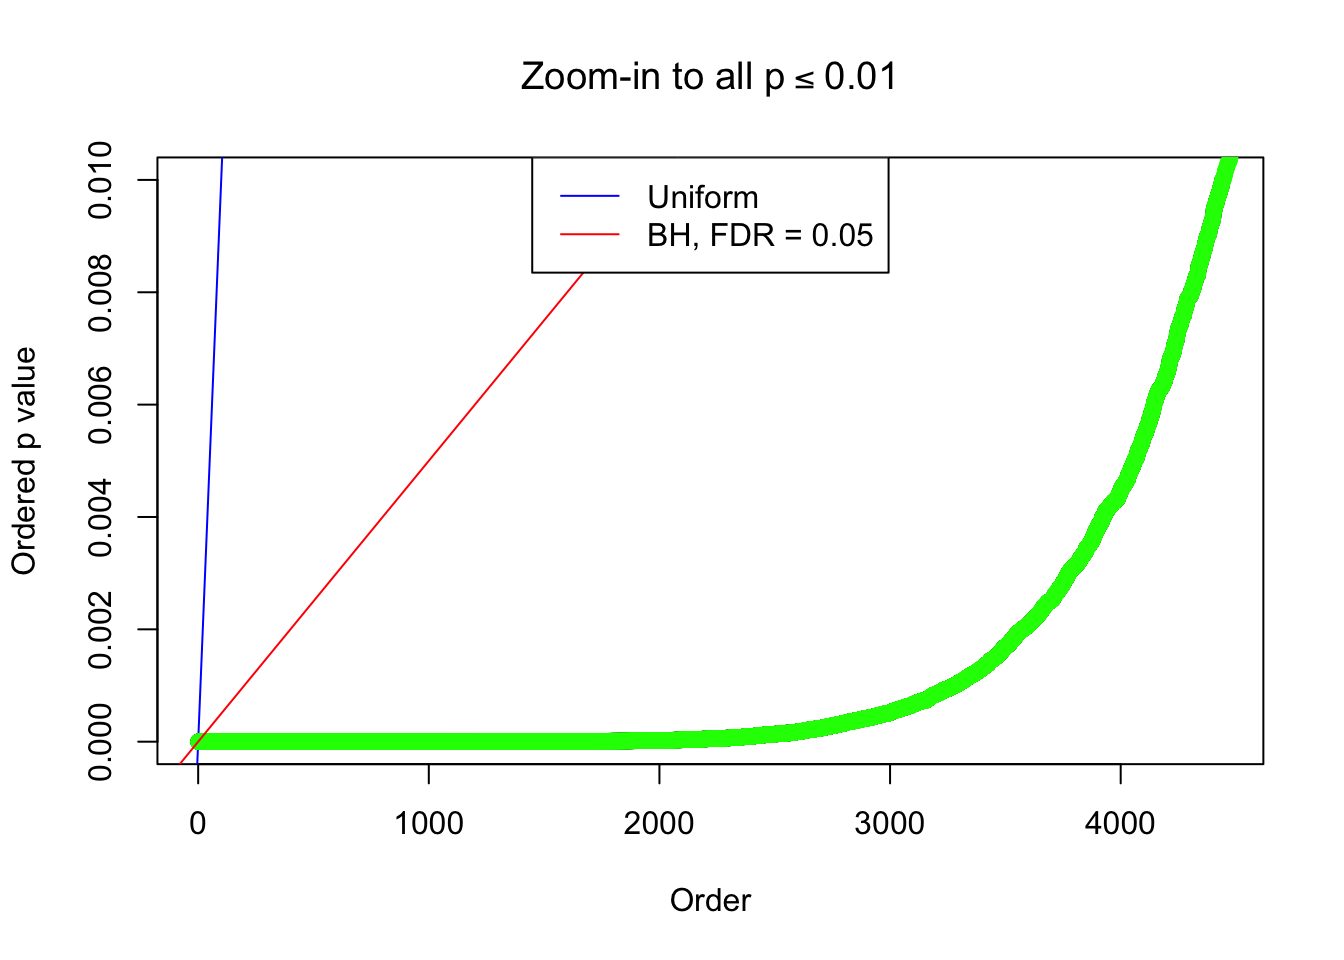
Number of Discoveries: 428 ;
pihat0 = 0.2709664 ;
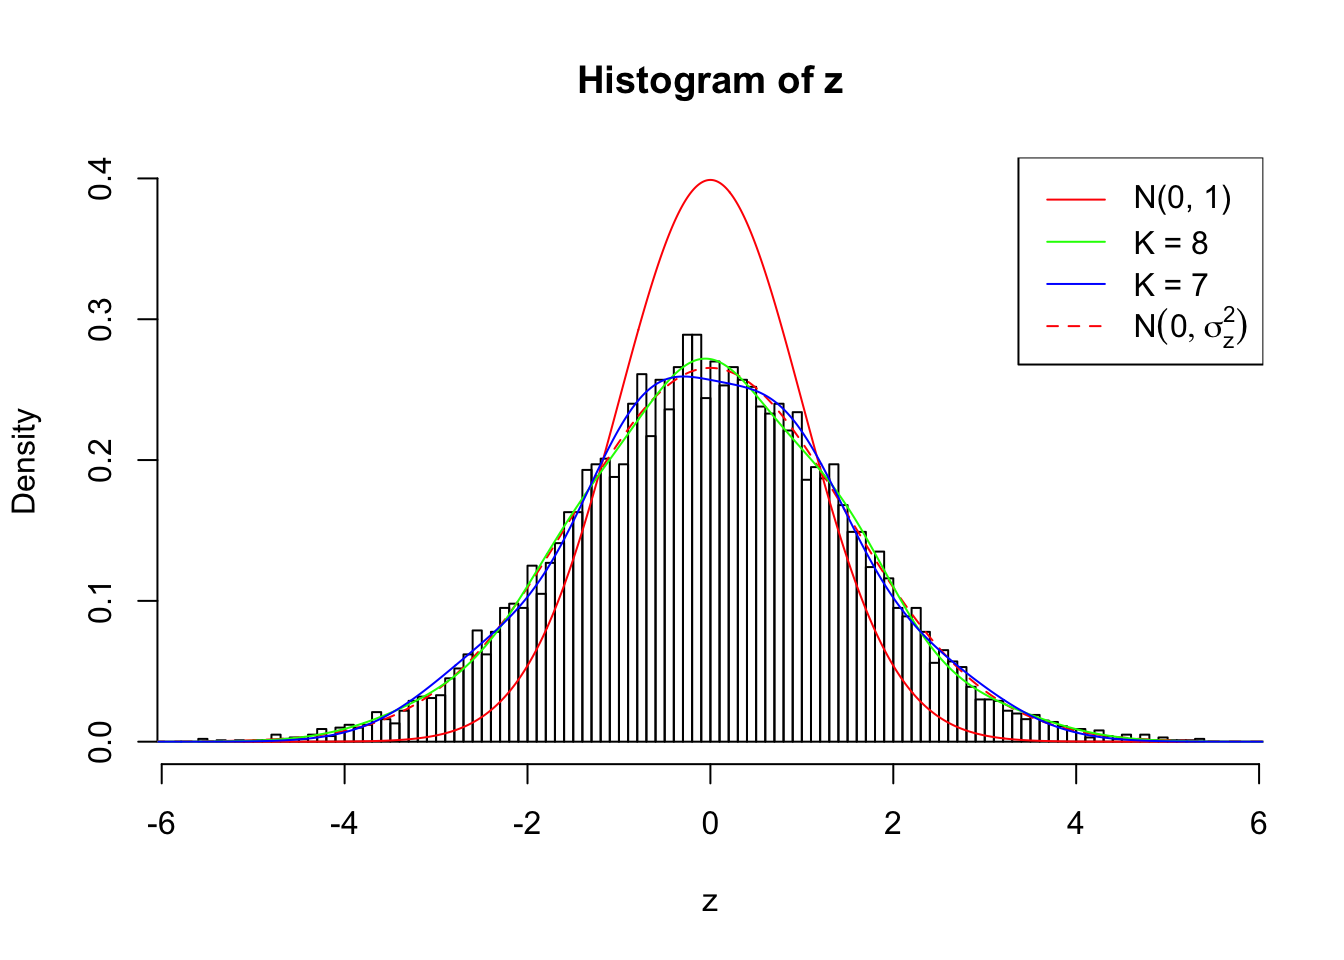
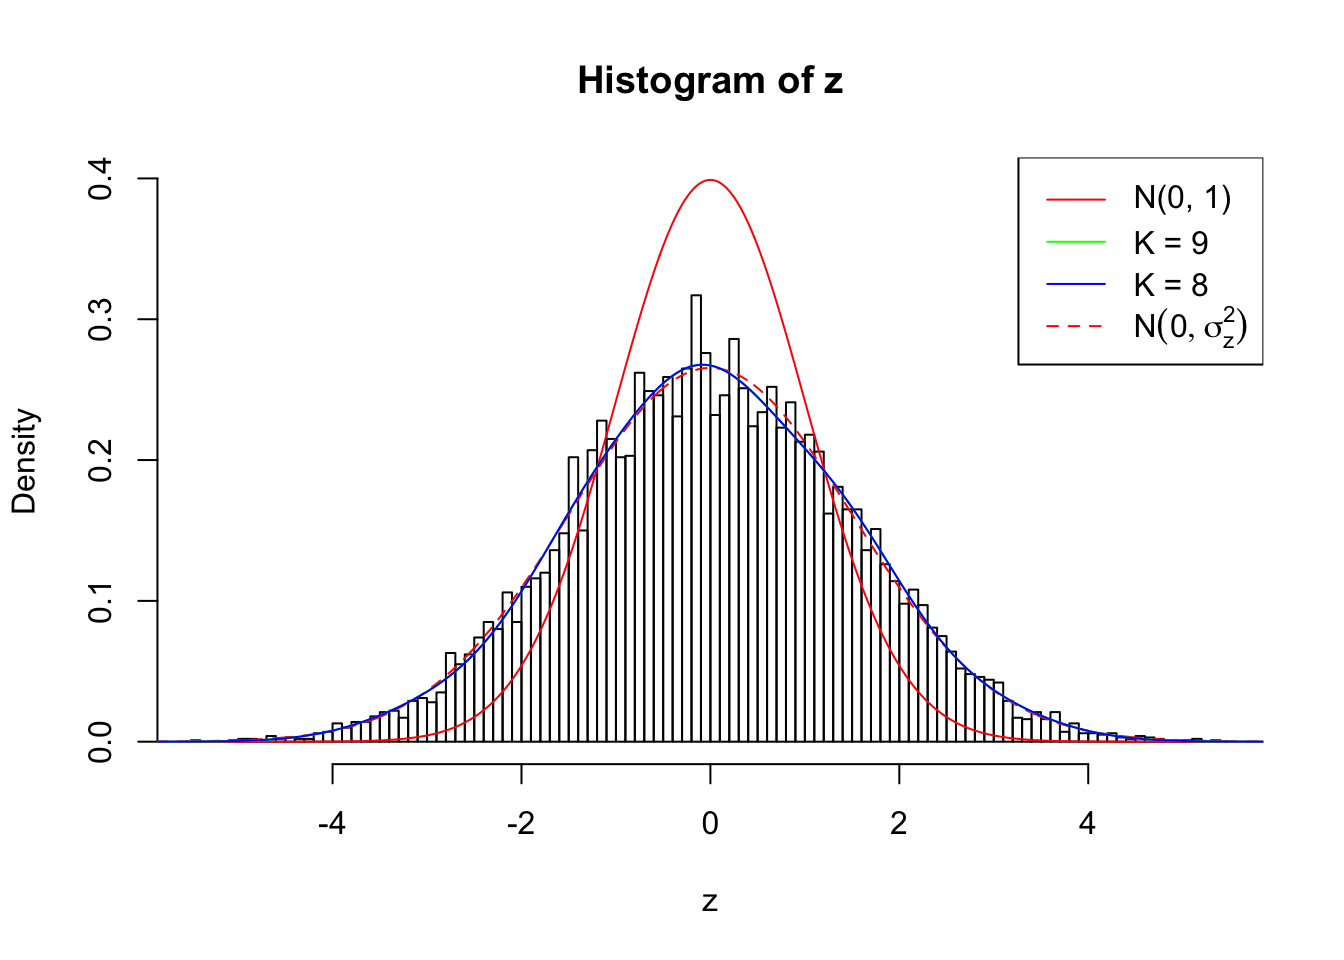
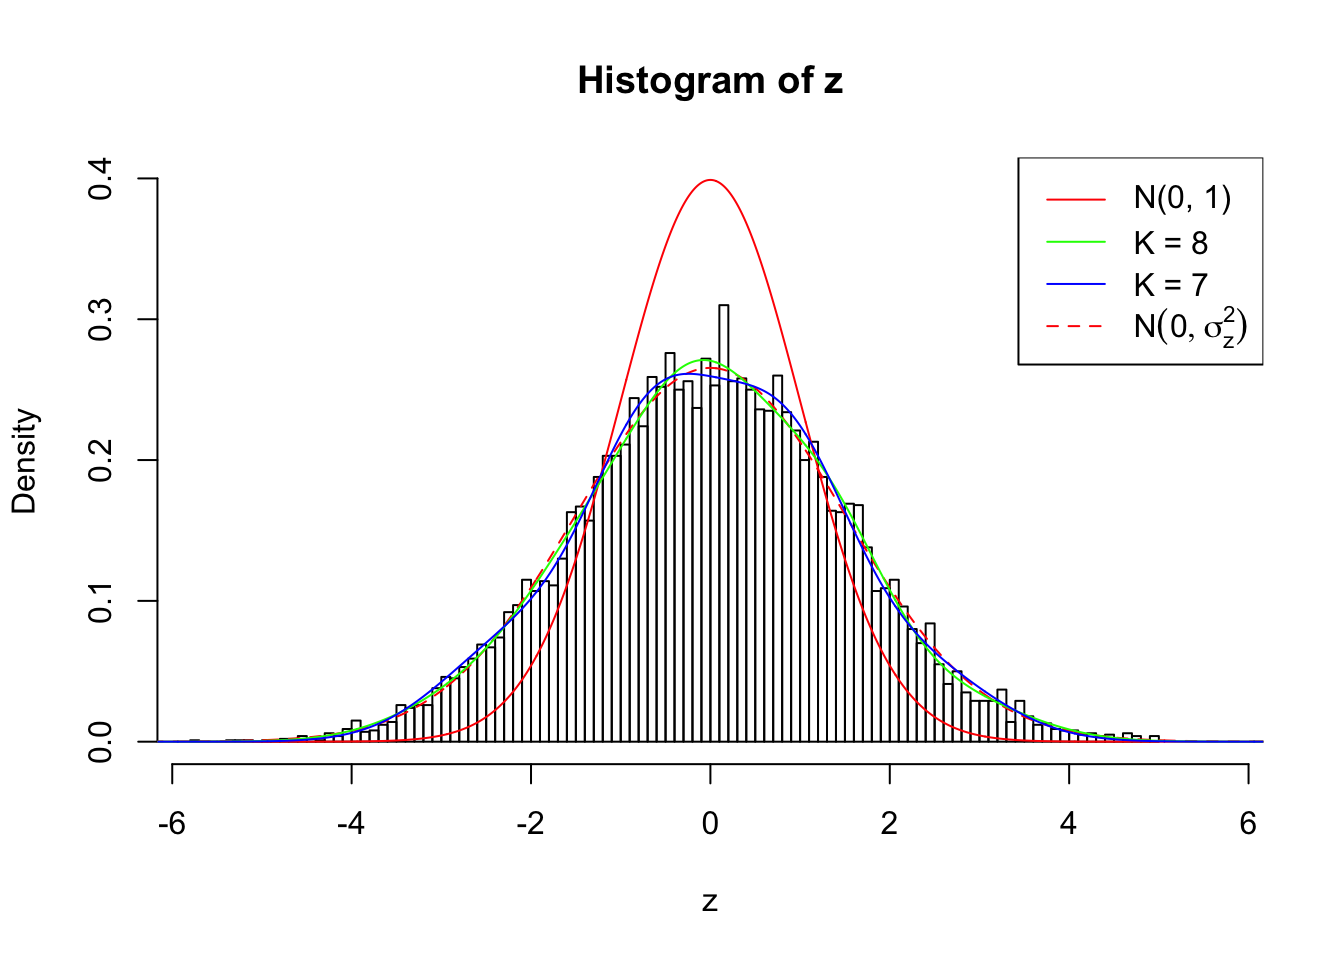
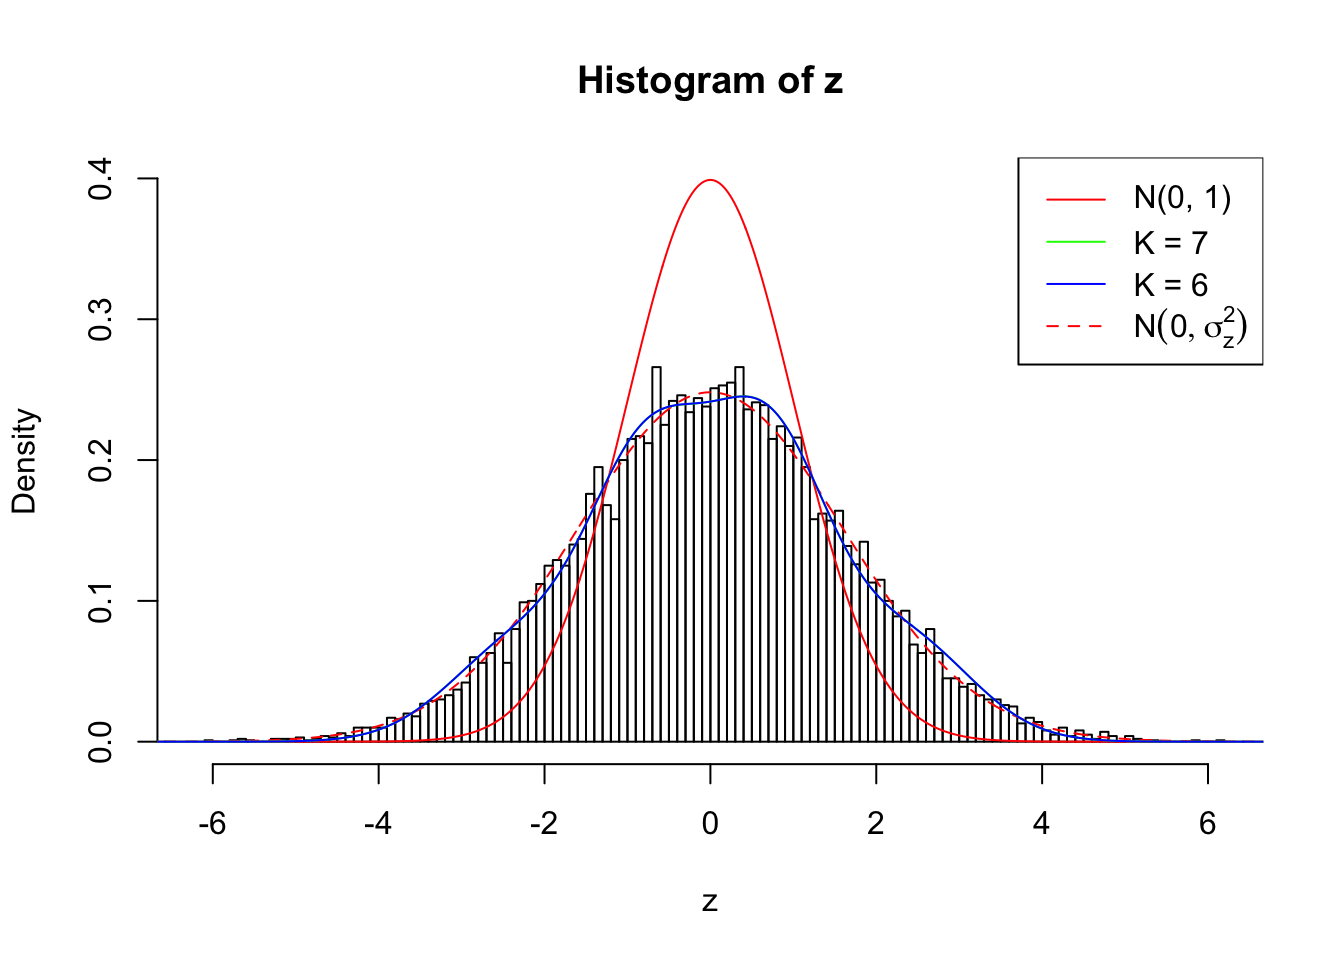
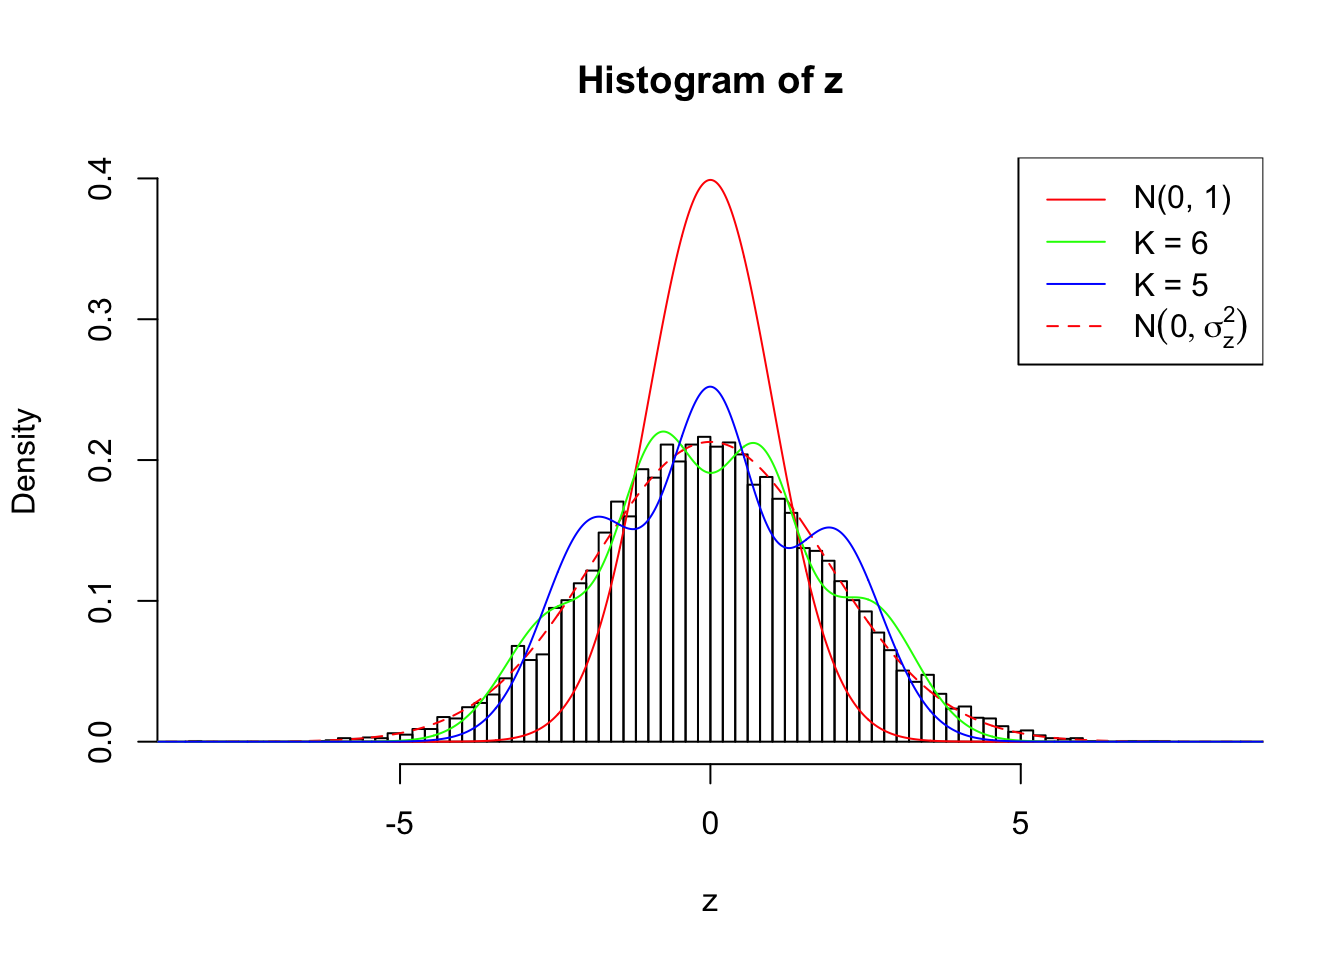
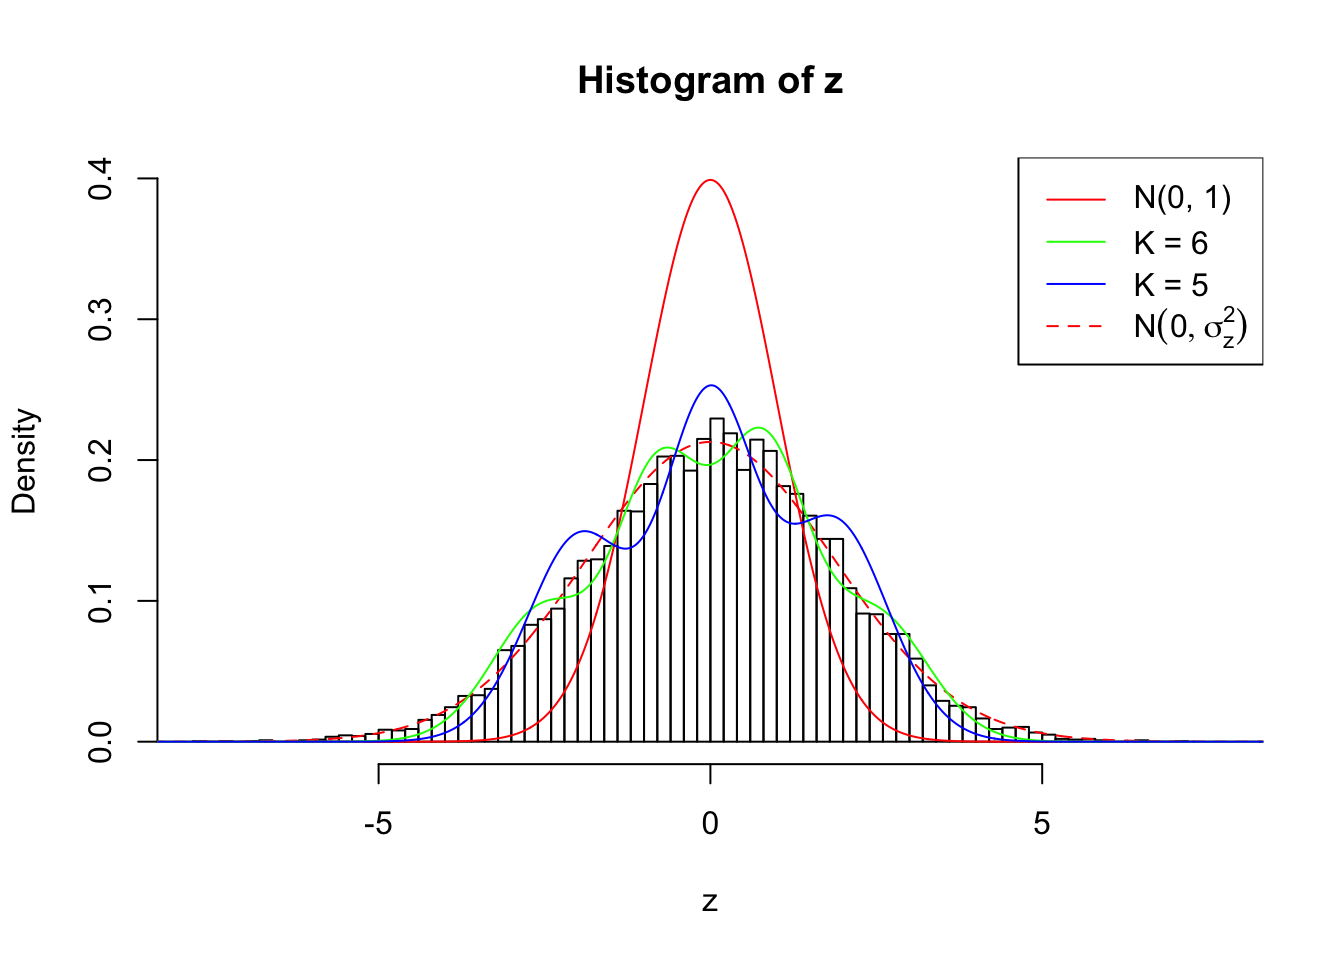
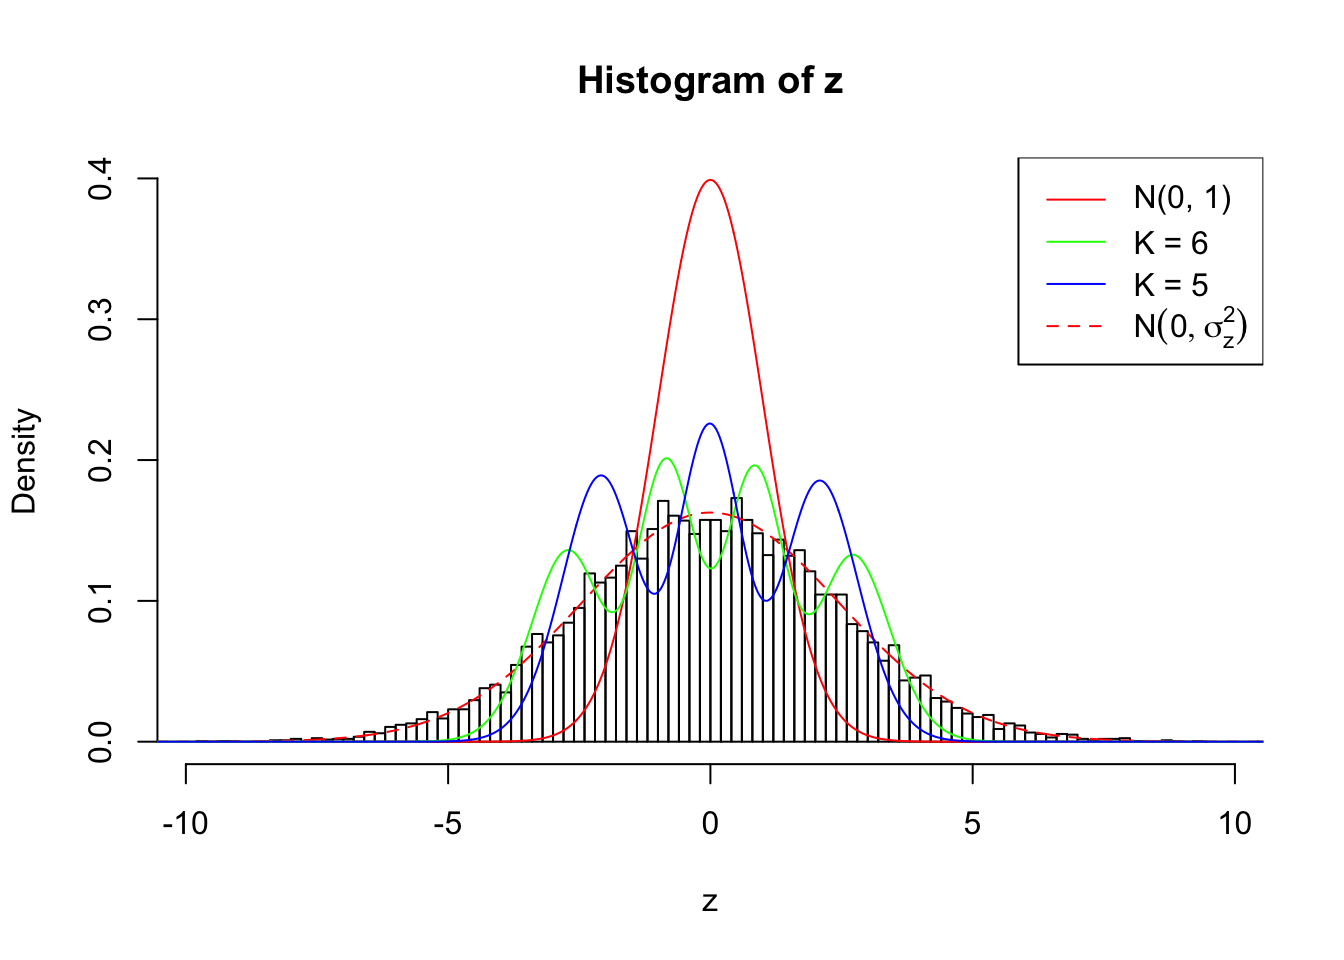
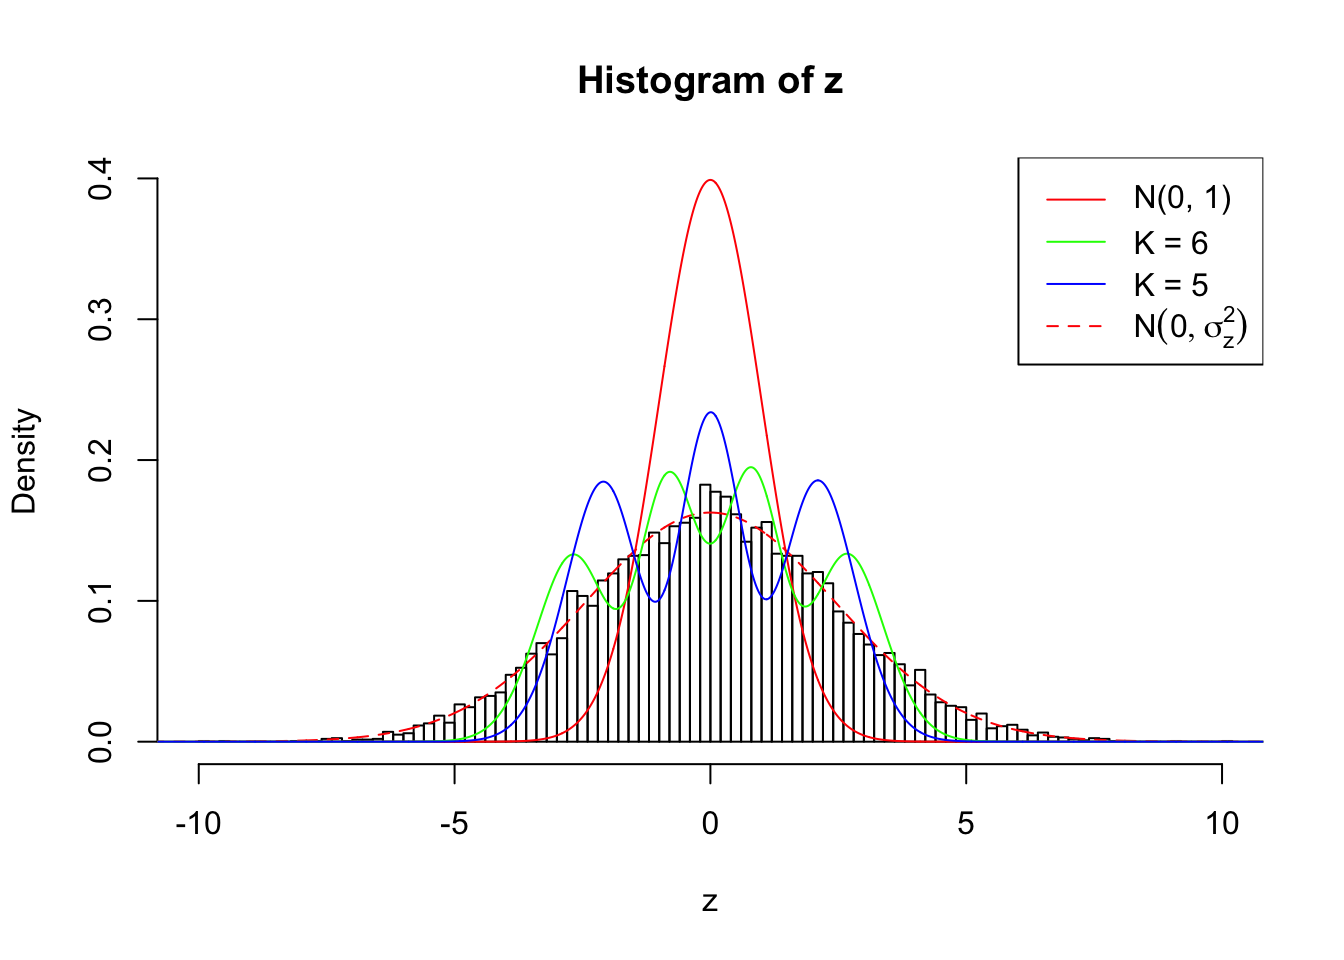
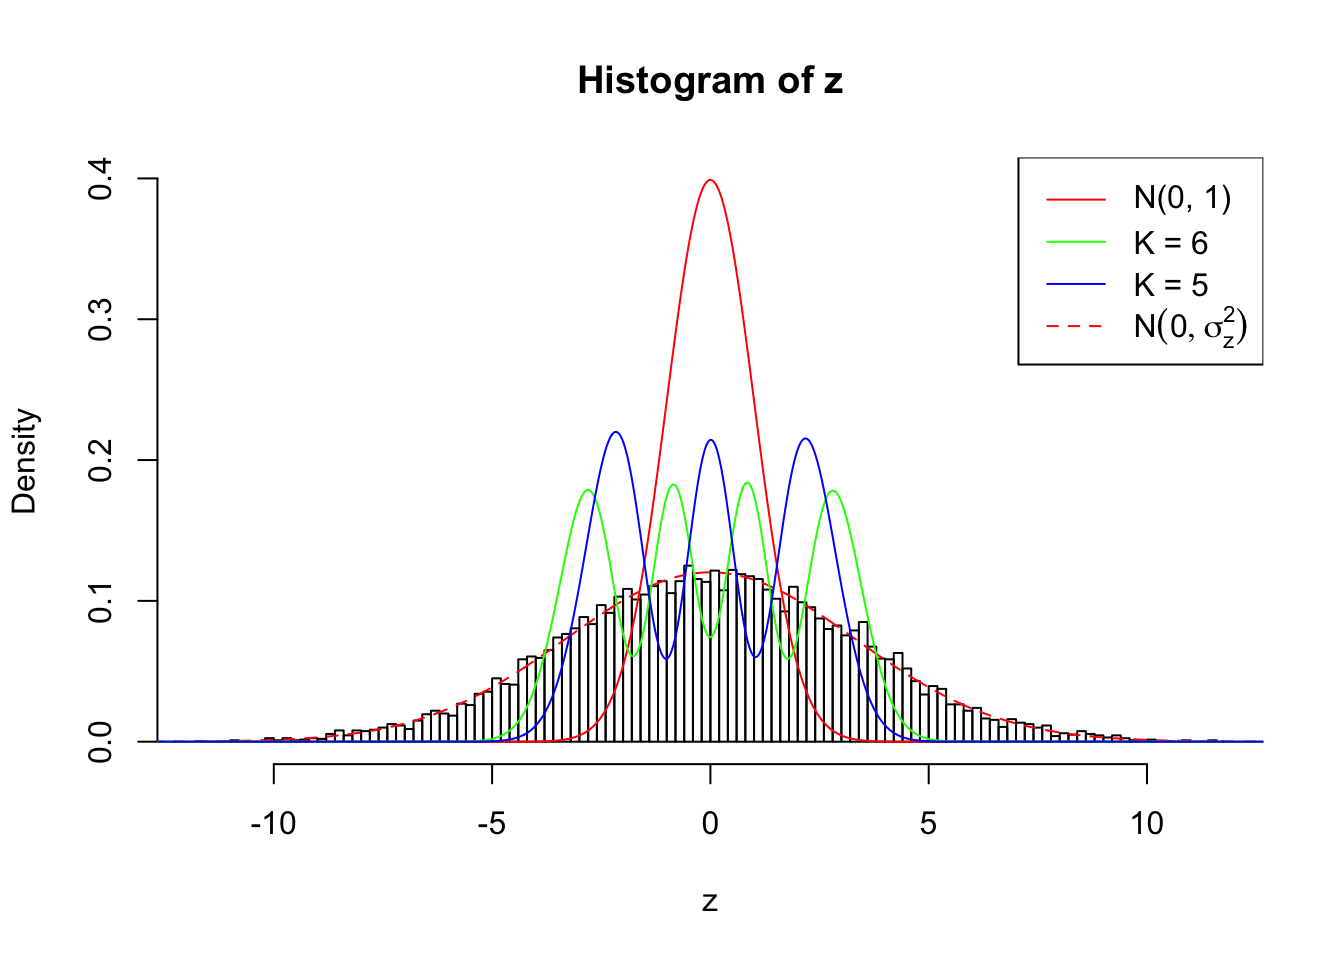
Log-likelihood by True Distribution N ( 0, 2.258925 ) : -18313.33 ;
Log-likelihood by Gaussian Derivatives with K = 8 : -18318.05 ;
Log-likelihood Ratio between True Distribution N ( 0, 2.258925 ) and Fitted Gaussian Derivatives with K = 8 : 4.720698 ;
Normalized Weights of Gaussian Derivatives with K = 8 :
1 : -0.0138740386442539 ; 2 : 0.892281011245653 ; 3 : -0.028567009630833 ; 4 : 0.94253139322481 ; 5 : -0.0113795882900605 ; 6 : 0.809509538283857 ; 7 : 0.0229744434384983 ; 8 : 0.358299621647272 ;
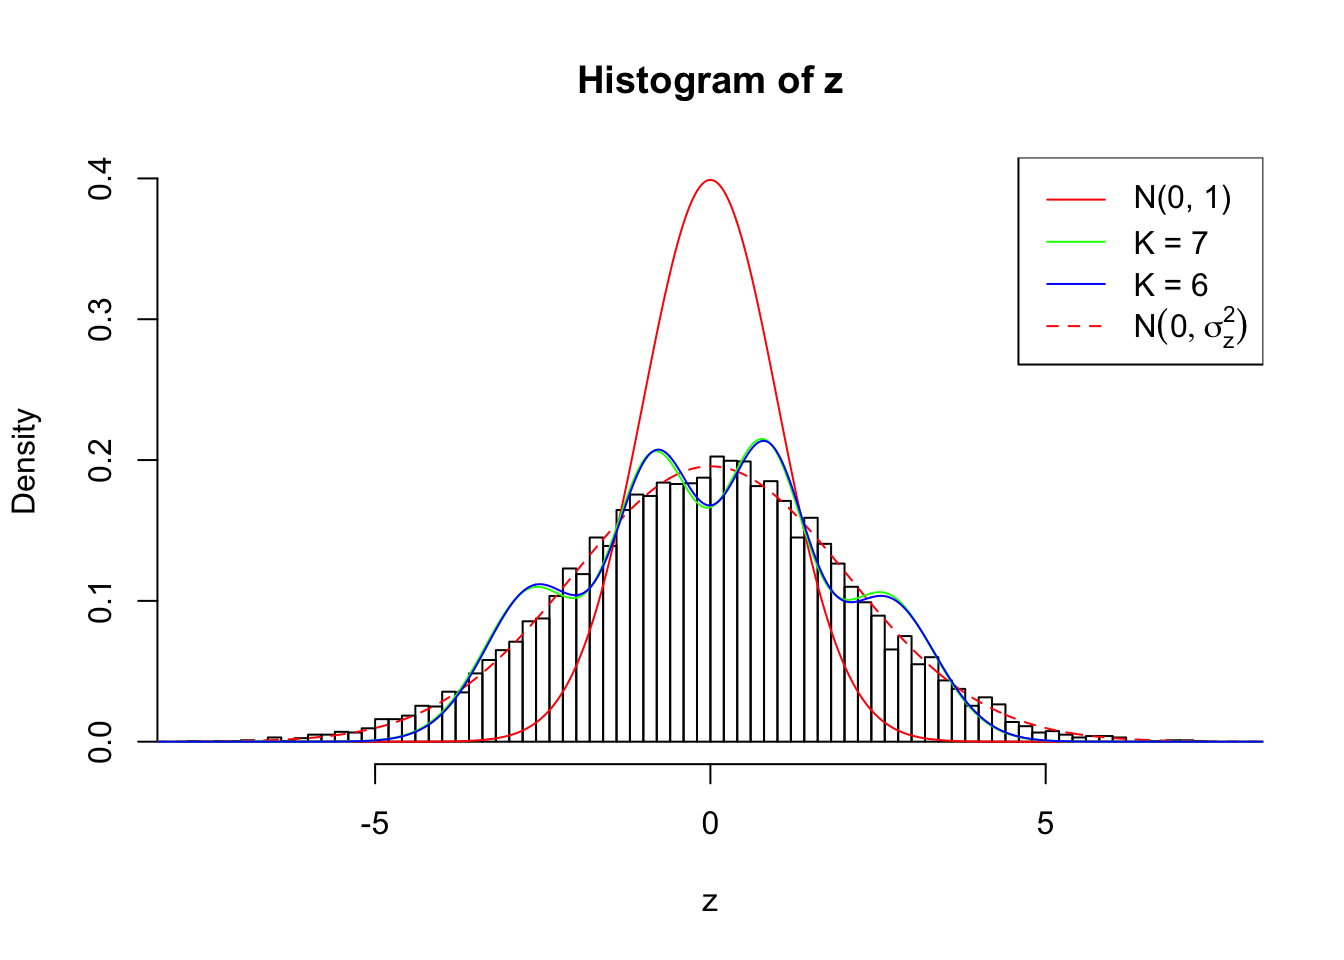
Log-likelihood by Gaussian Derivatives with K = 7 : -18348.81 ;
Log-likelihood Ratio between True Distribution N ( 0, 2.258925 ) and Fitted Gaussian Derivatives with K = 7 : 35.47763 ;
Normalized Weights of Gaussian Derivatives with K = 7 :
1 : -0.0149703048359138 ; 2 : 0.866692877952966 ; 3 : -0.0301089228458965 ; 4 : 0.767046792878629 ; 5 : -0.0110444822556435 ; 6 : 0.380758391289584 ; 7 : 0.0254012390742264 ; 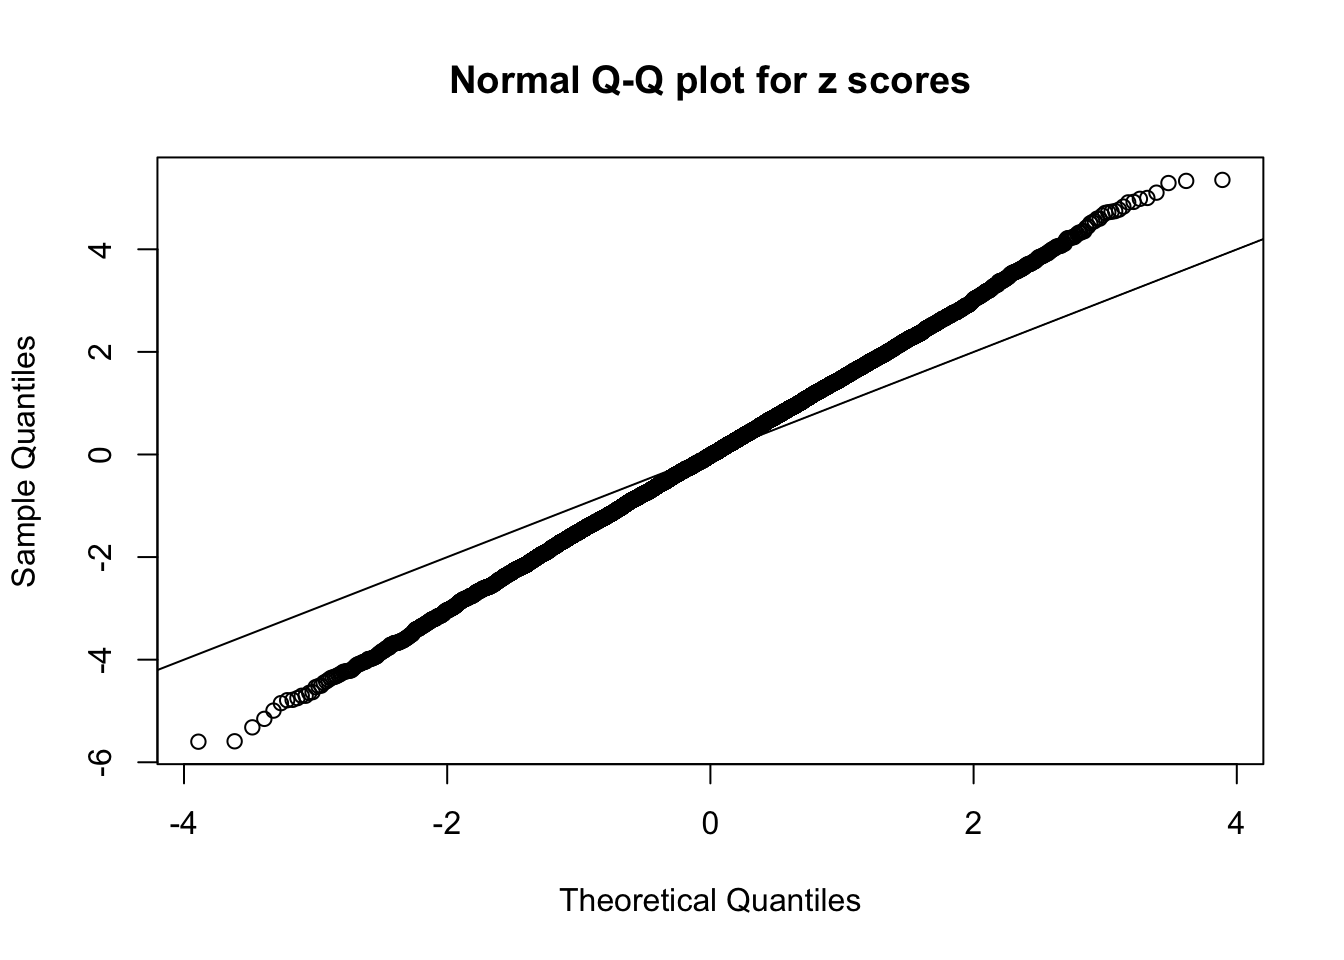


Zoom in to the left tail: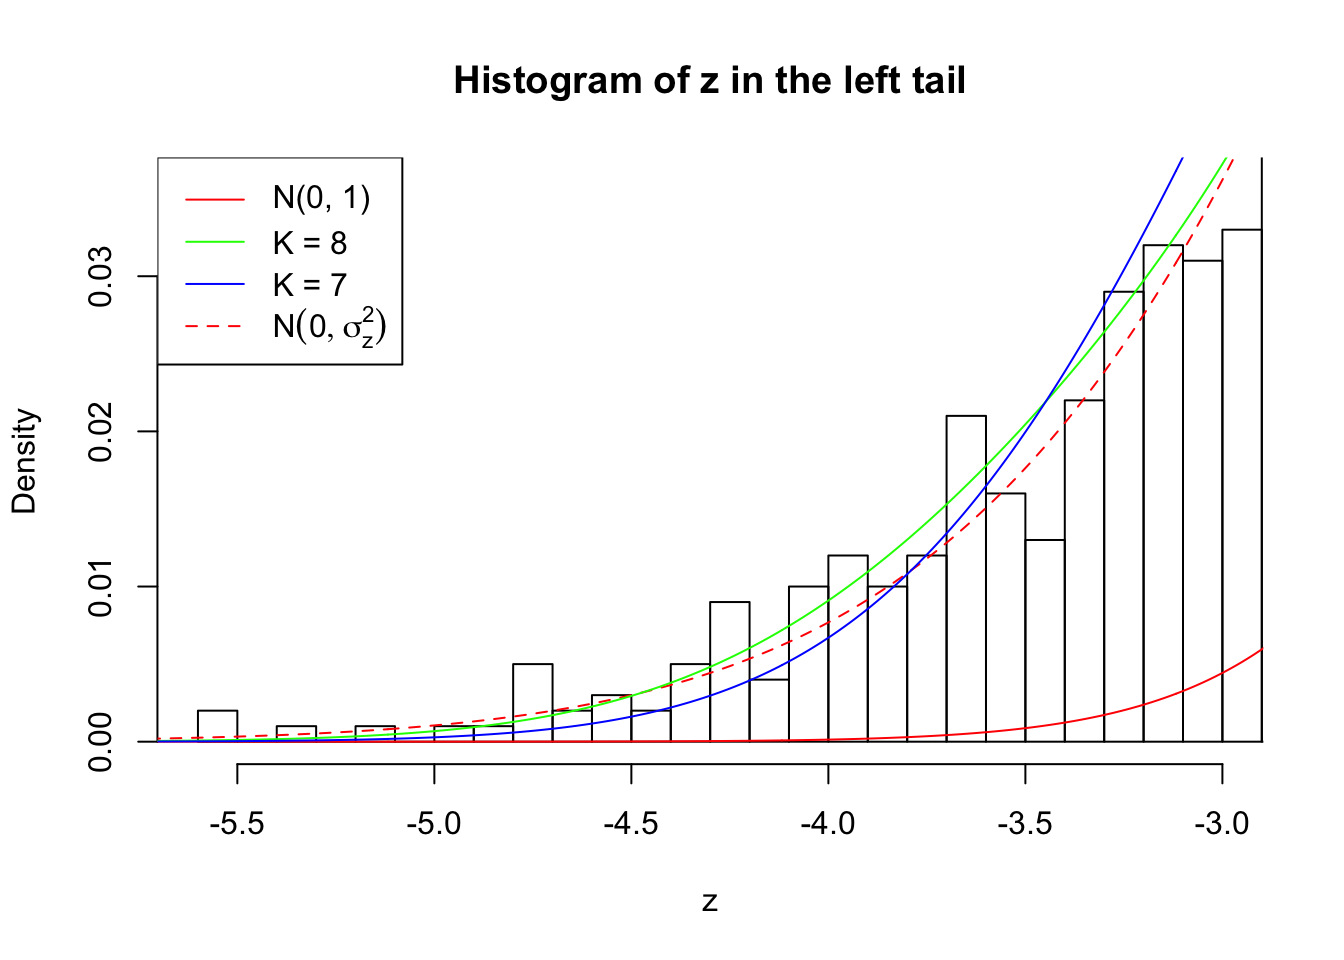
Zoom in to the right tail: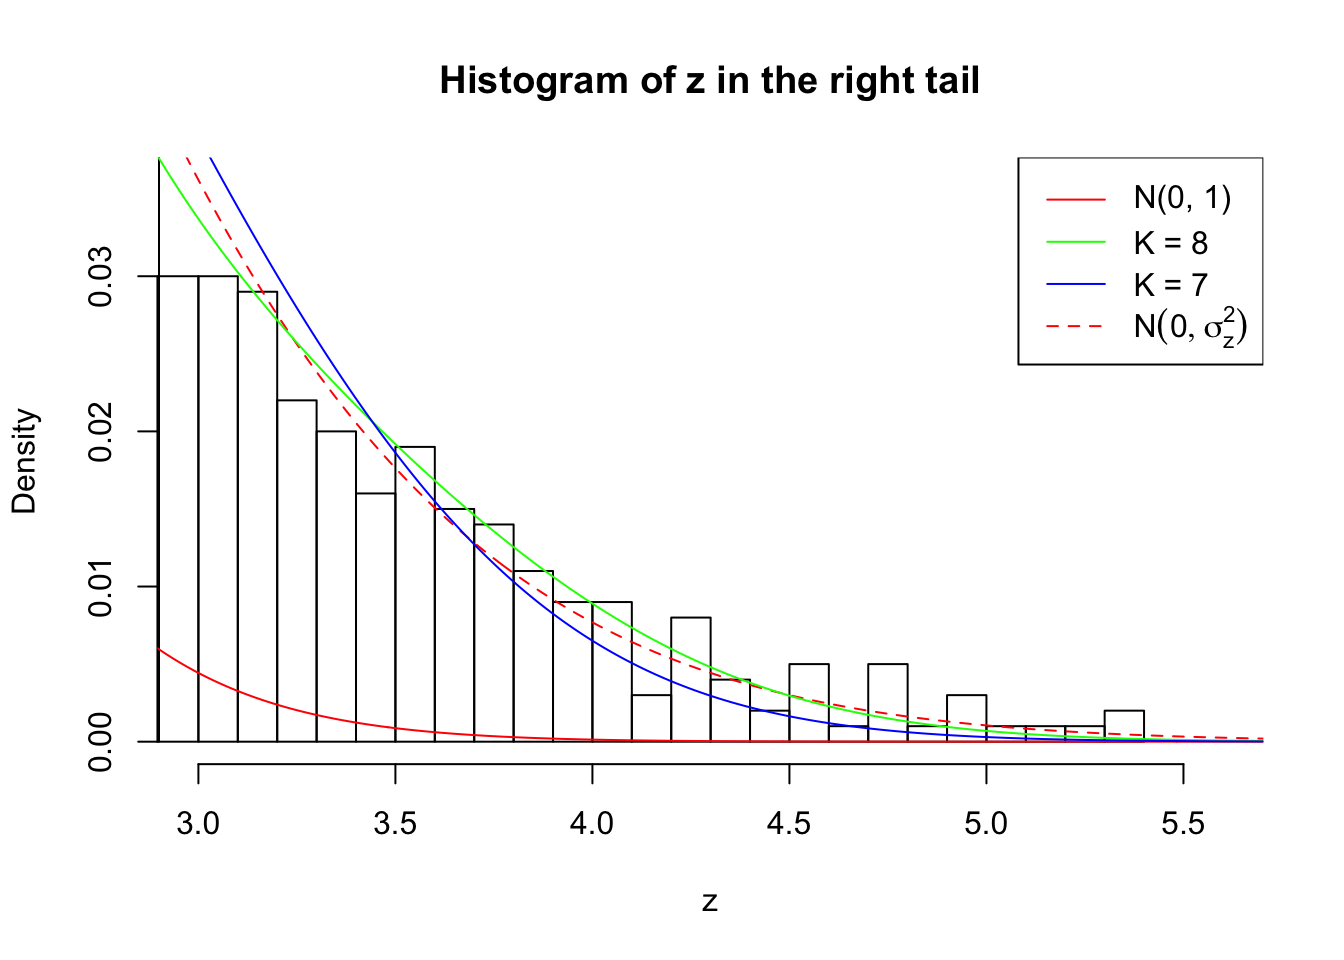
Example 2 :
SNR = 1 ;
True Distribution: N ( 0 , 2.258925 ) ;
Number of Discoveries: 367 ;
pihat0 = 0.2655976 ;
Log-likelihood by True Distribution N ( 0, 2.258925 ) : -18229.62 ;
Log-likelihood by Gaussian Derivatives with K = 9 : -18229.93 ;
Log-likelihood Ratio between True Distribution N ( 0, 2.258925 ) and Fitted Gaussian Derivatives with K = 9 : 0.3054308 ;
Normalized Weights of Gaussian Derivatives with K = 9 :
1 : 0.0109595744146466 ; 2 : 0.872494511525152 ; 3 : 0.0166435212643833 ; 4 : 0.834304921649212 ; 5 : -0.0172341620303621 ; 6 : 0.632087532212813 ; 7 : 0.00856994470962663 ; 8 : 0.246676236280596 ; 9 : 0.00960621718545015 ;
Log-likelihood by Gaussian Derivatives with K = 8 : -18230.02 ;
Log-likelihood Ratio between True Distribution N ( 0, 2.258925 ) and Fitted Gaussian Derivatives with K = 8 : 0.392468 ;
Normalized Weights of Gaussian Derivatives with K = 8 :
1 : 0.0108635572606931 ; 2 : 0.872487253460917 ; 3 : 0.0151674590792571 ; 4 : 0.834395095058209 ; 5 : -0.0241729589279682 ; 6 : 0.632309611264995 ; 7 : -0.00494246114453377 ; 8 : 0.246809387644906 ; 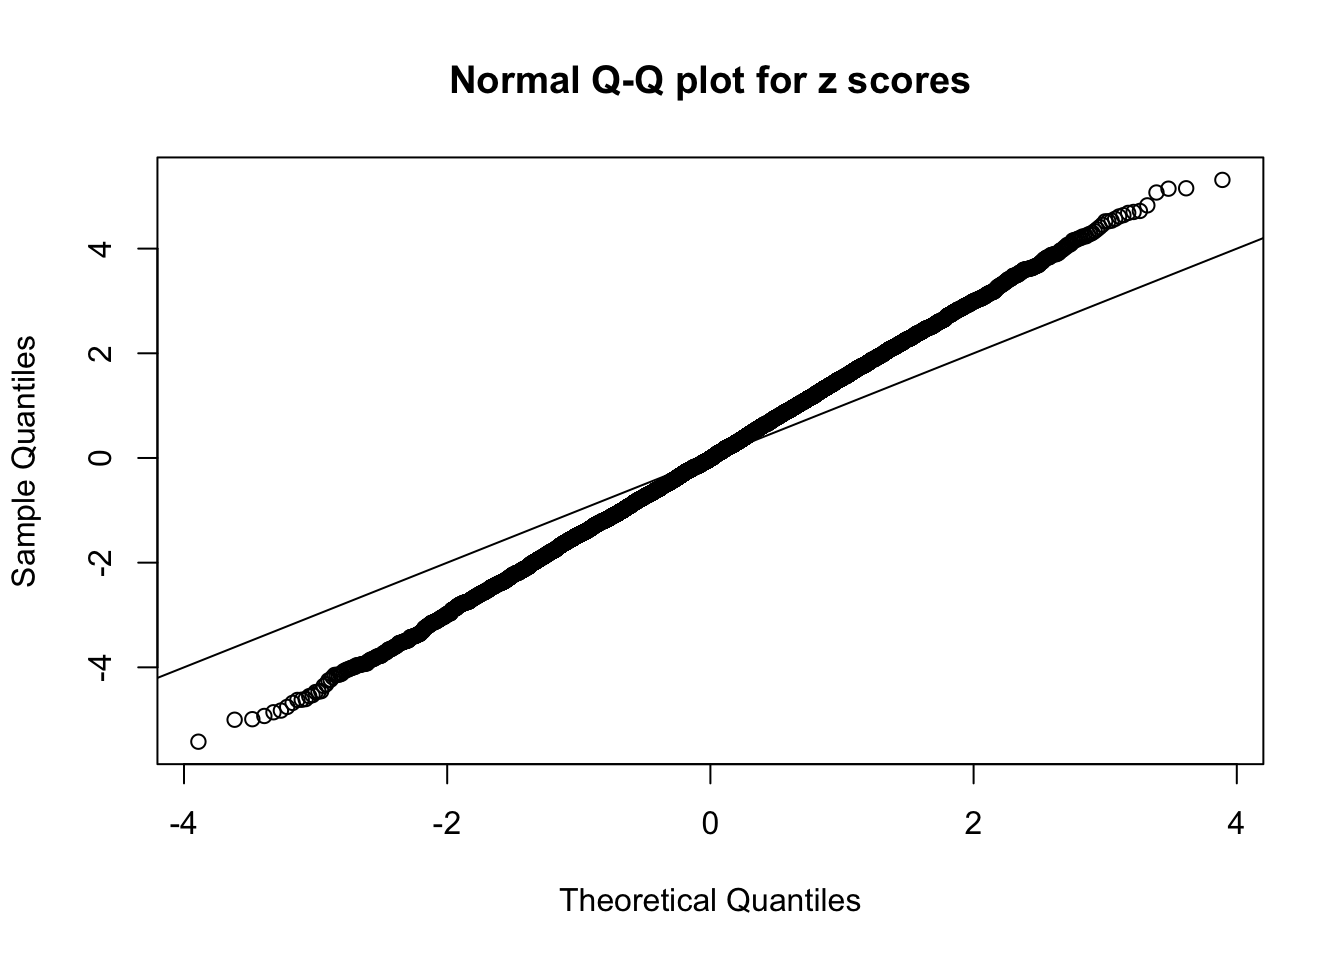
Zoom in to the left tail: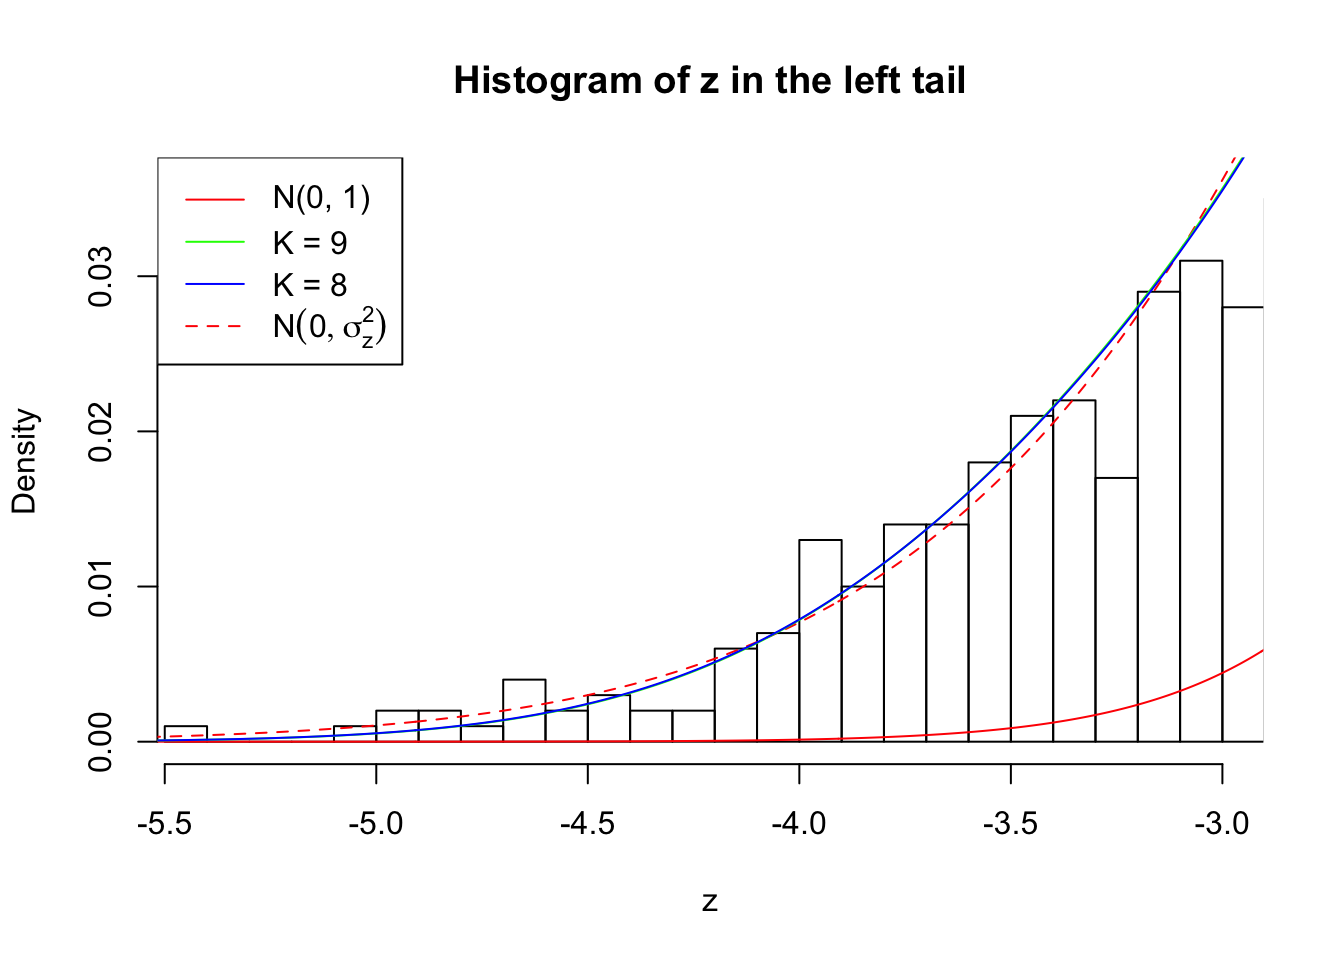
Zoom in to the right tail: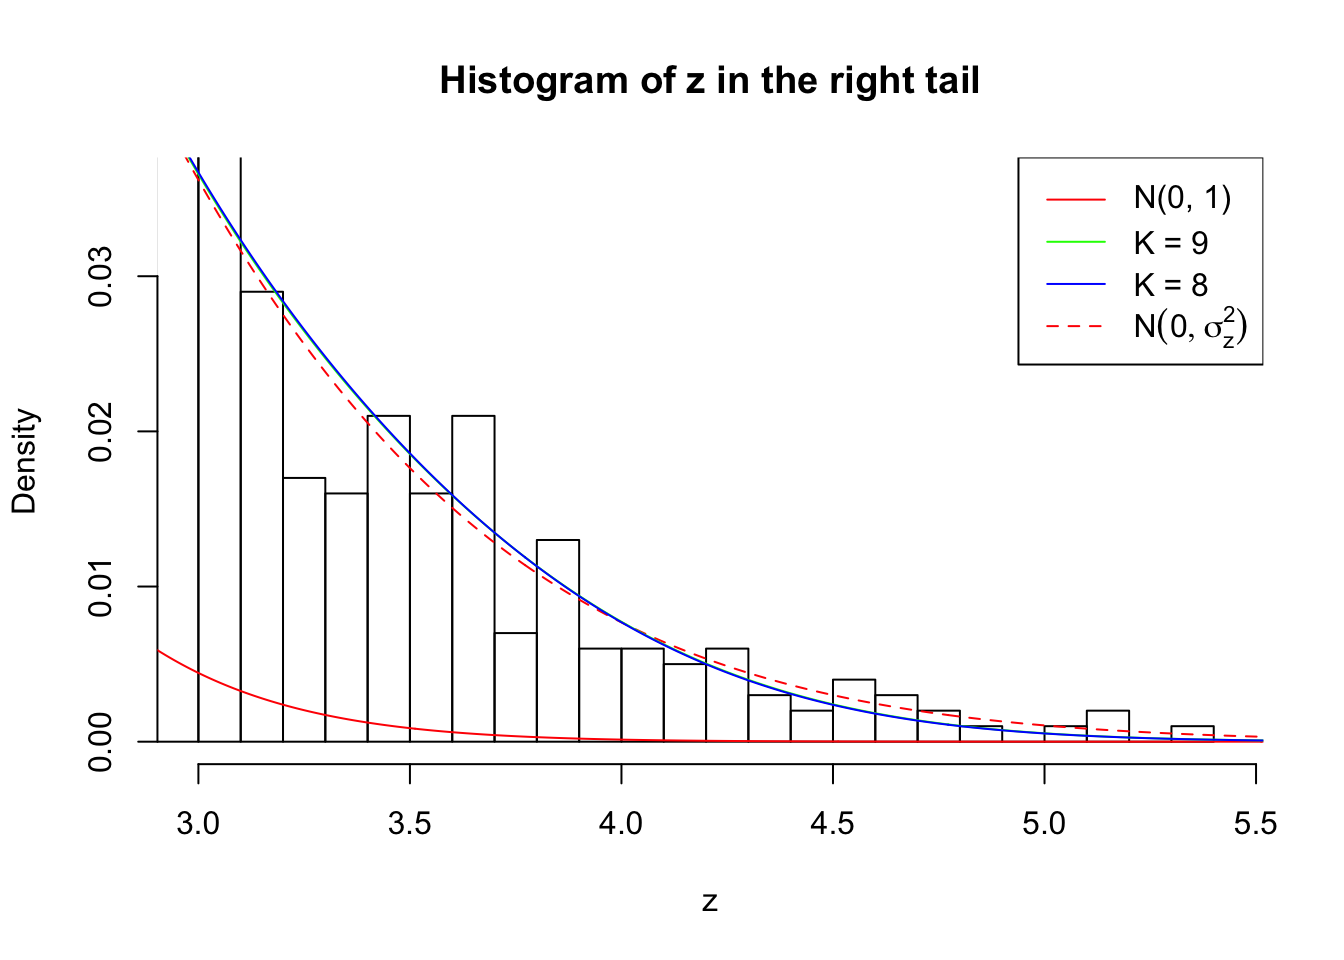
Example 3 :
SNR = 1 ;
True Distribution: N ( 0 , 2.258925 ) ;
Number of Discoveries: 414 ;
pihat0 = 0.3111735 ;
Log-likelihood by True Distribution N ( 0, 2.258925 ) : -18236.37 ;
Log-likelihood by Gaussian Derivatives with K = 8 : -18234.66 ;
Log-likelihood Ratio between True Distribution N ( 0, 2.258925 ) and Fitted Gaussian Derivatives with K = 8 : -1.715201 ;
Normalized Weights of Gaussian Derivatives with K = 8 :
1 : -0.000572287615513397 ; 2 : 0.873484974327661 ; 3 : -0.0126862795911764 ; 4 : 0.891280588085513 ; 5 : 0.0448702002588981 ; 6 : 0.699292716557123 ; 7 : 0.0739176259383721 ; 8 : 0.269359515626305 ;
Log-likelihood by Gaussian Derivatives with K = 7 : -18253.01 ;
Log-likelihood Ratio between True Distribution N ( 0, 2.258925 ) and Fitted Gaussian Derivatives with K = 7 : 16.64117 ;
Normalized Weights of Gaussian Derivatives with K = 7 :
1 : -0.00223200243361907 ; 2 : 0.853439452681122 ; 3 : -0.0206175539095362 ; 4 : 0.754777072315358 ; 5 : 0.0300355184347576 ; 6 : 0.37248254074971 ; 7 : 0.0629162247280905 ; 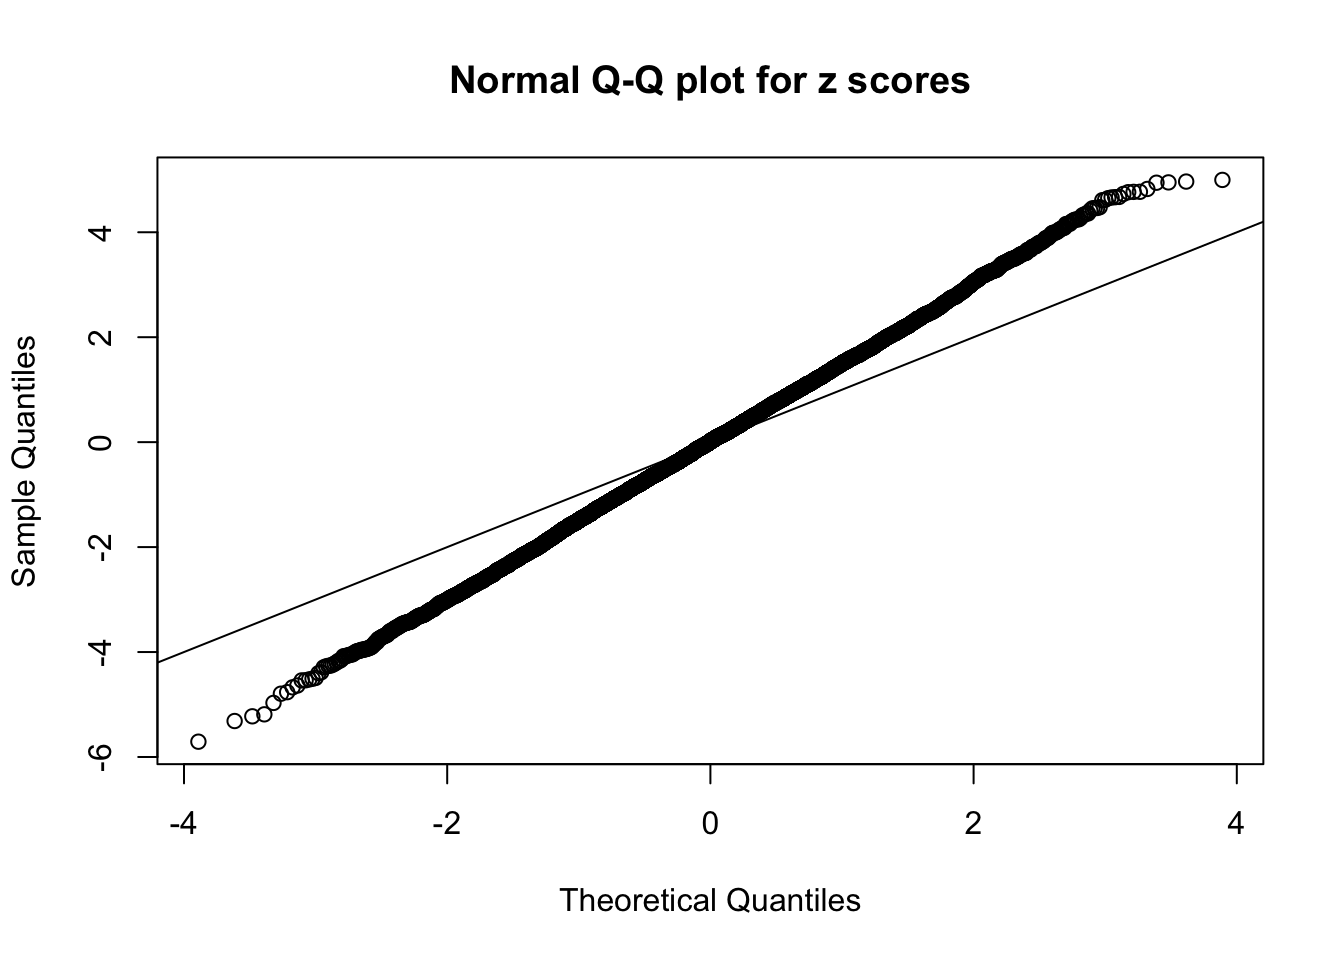

Zoom in to the left tail: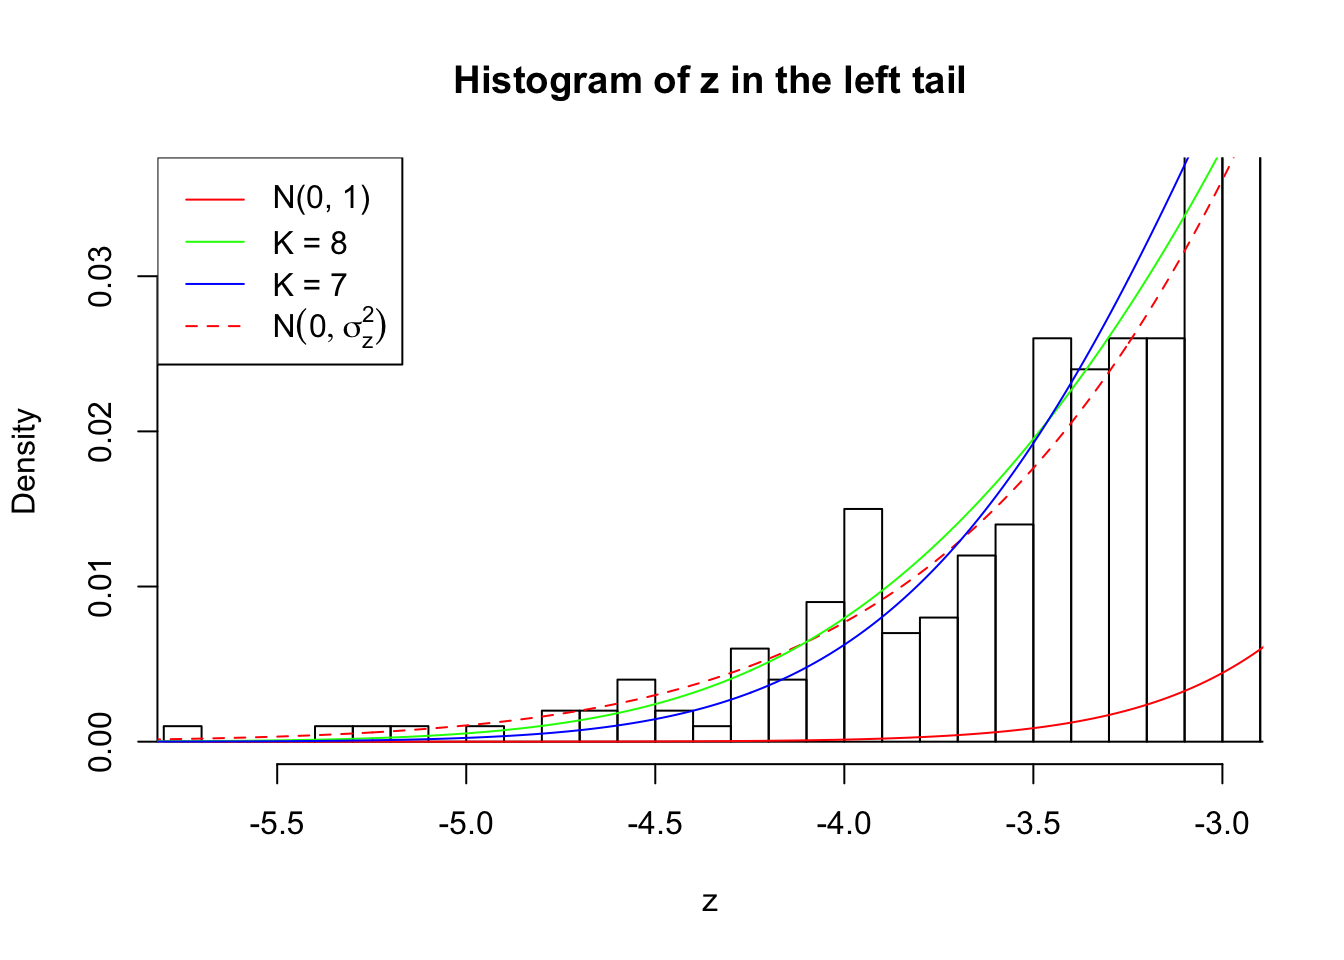
Zoom in to the right tail: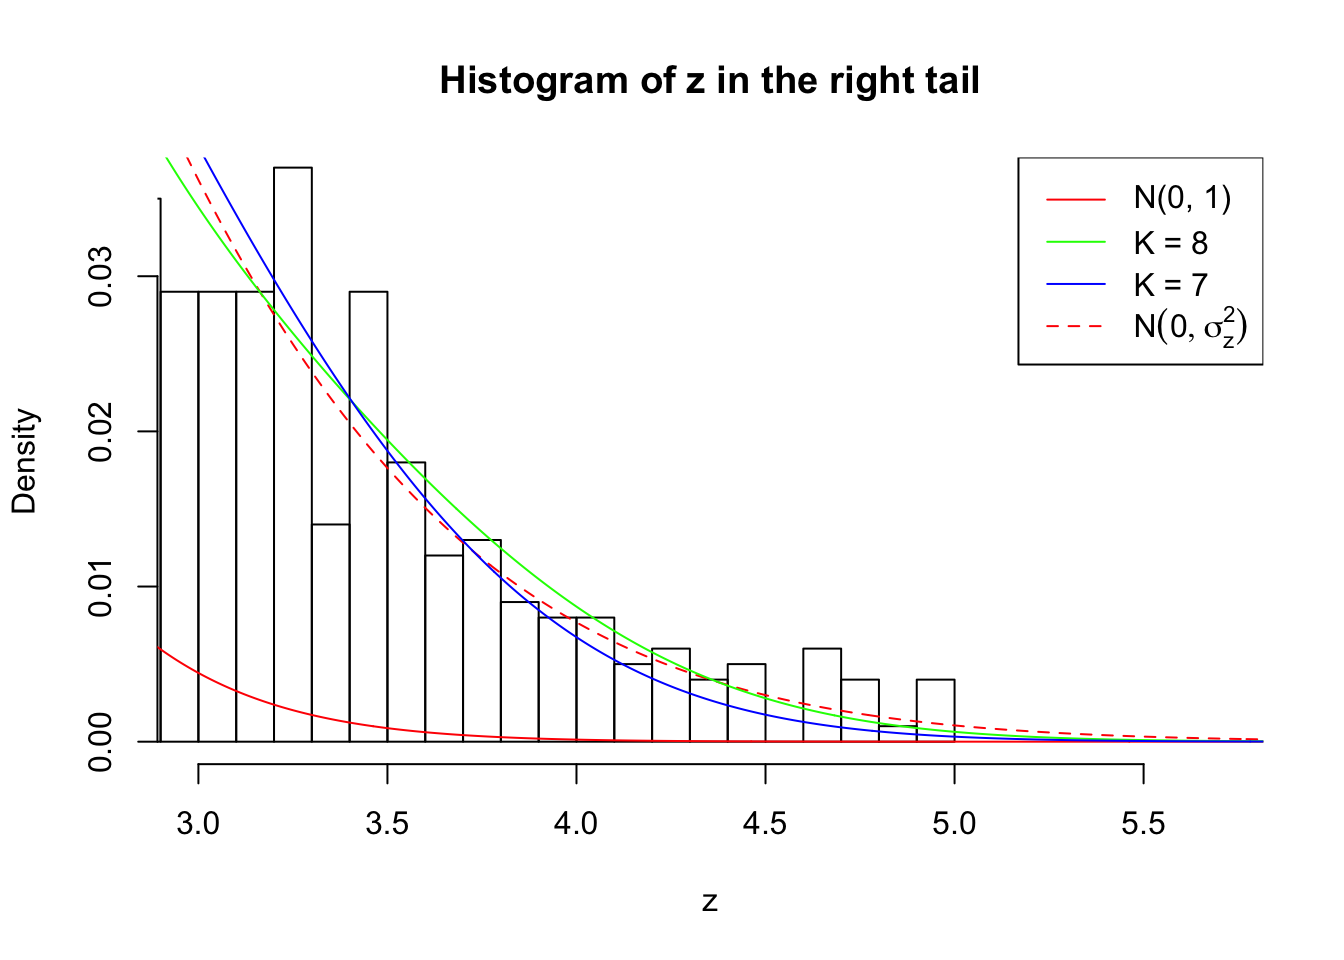
Example 4 :
SNR = 1 ;
True Distribution: N ( 0 , 2.258925 ) ;
Number of Discoveries: 279 ;
pihat0 = 0.2883564 ;
Log-likelihood by True Distribution N ( 0, 2.258925 ) : -18180.99 ;
Log-likelihood by Gaussian Derivatives with K = 7 : -18211.86 ;
Log-likelihood Ratio between True Distribution N ( 0, 2.258925 ) and Fitted Gaussian Derivatives with K = 7 : 30.87149 ;
Normalized Weights of Gaussian Derivatives with K = 7 :
1 : -0.00253181066300101 ; 2 : 0.835740744054015 ; 3 : -0.00828147519737005 ; 4 : 0.658405272063464 ; 5 : -0.0056181233262792 ; 6 : 0.279018029700389 ; 7 : 0.031205122505456 ;
Log-likelihood by Gaussian Derivatives with K = 6 : -18217.69 ;
Log-likelihood Ratio between True Distribution N ( 0, 2.258925 ) and Fitted Gaussian Derivatives with K = 6 : 36.69734 ;
Normalized Weights of Gaussian Derivatives with K = 6 :
1 : -0.00342033433603602 ; 2 : 0.835461789922238 ; 3 : -0.0179069743937475 ; 4 : 0.658486690747026 ; 5 : -0.0365069966123492 ; 6 : 0.279269504553461 ; 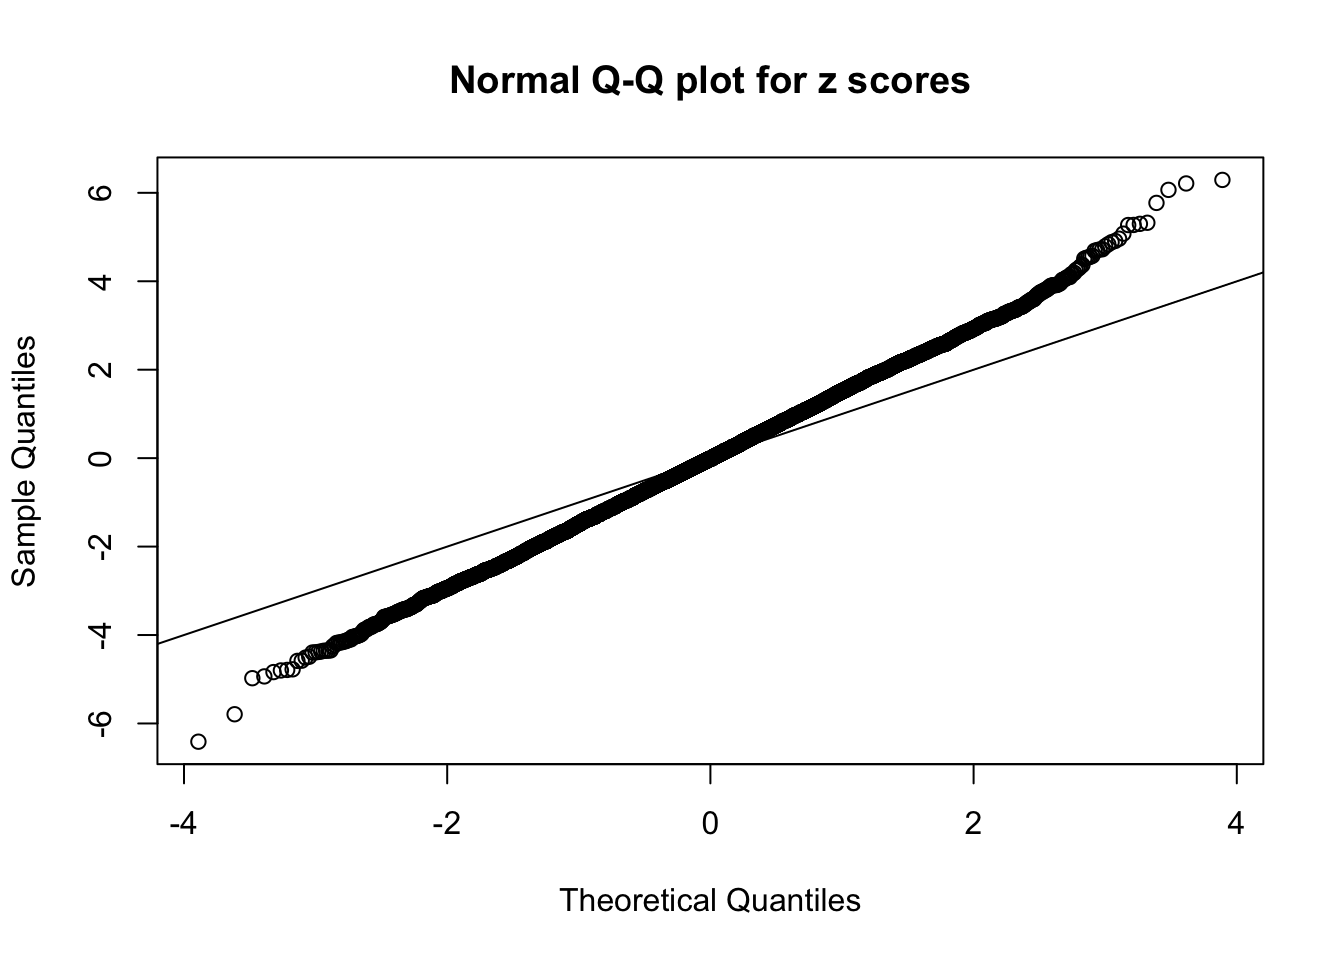

Zoom in to the left tail: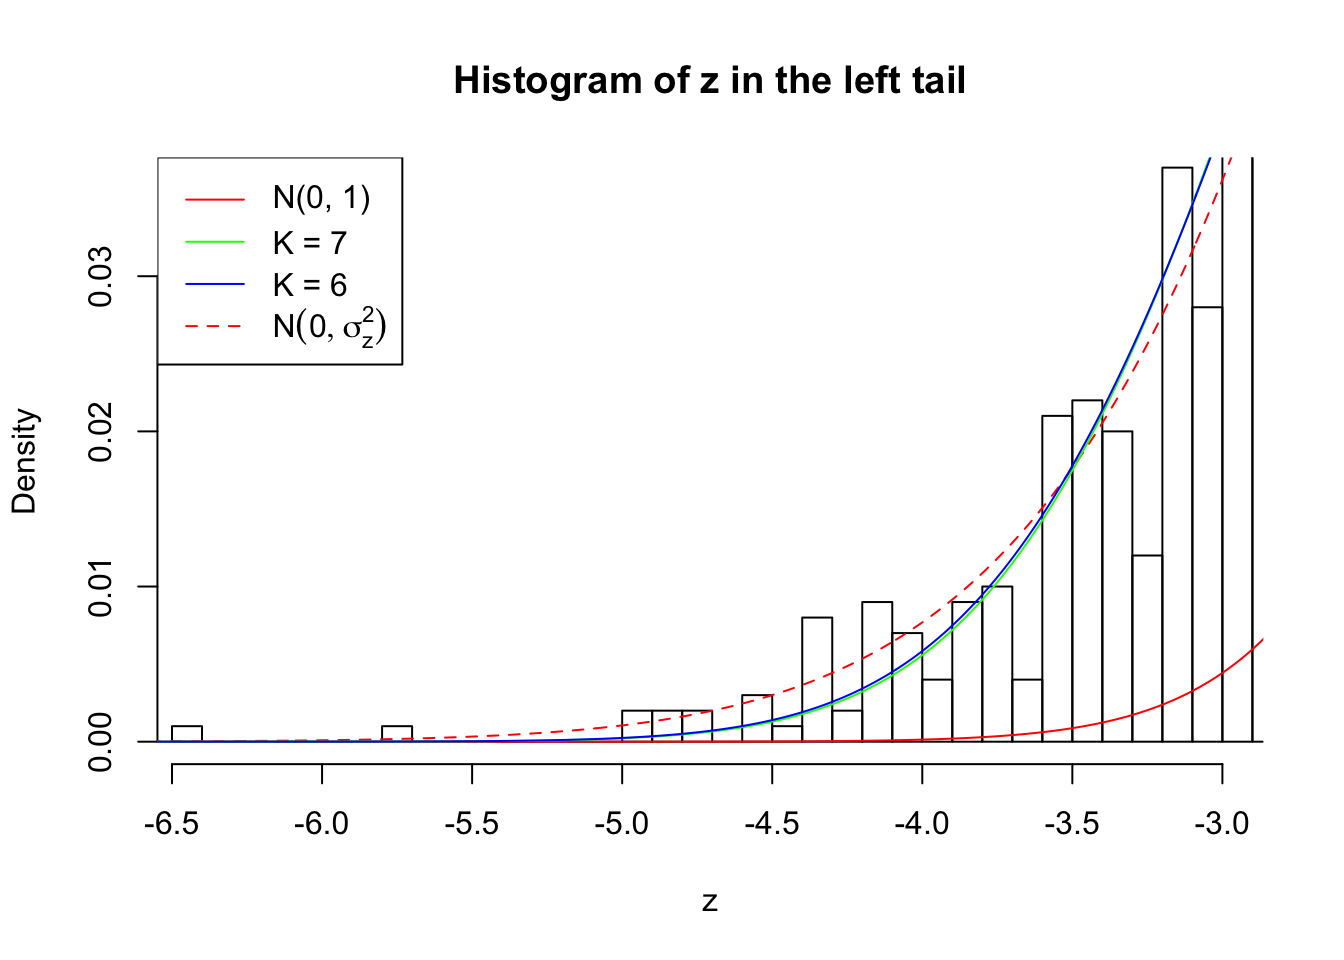
Zoom in to the right tail: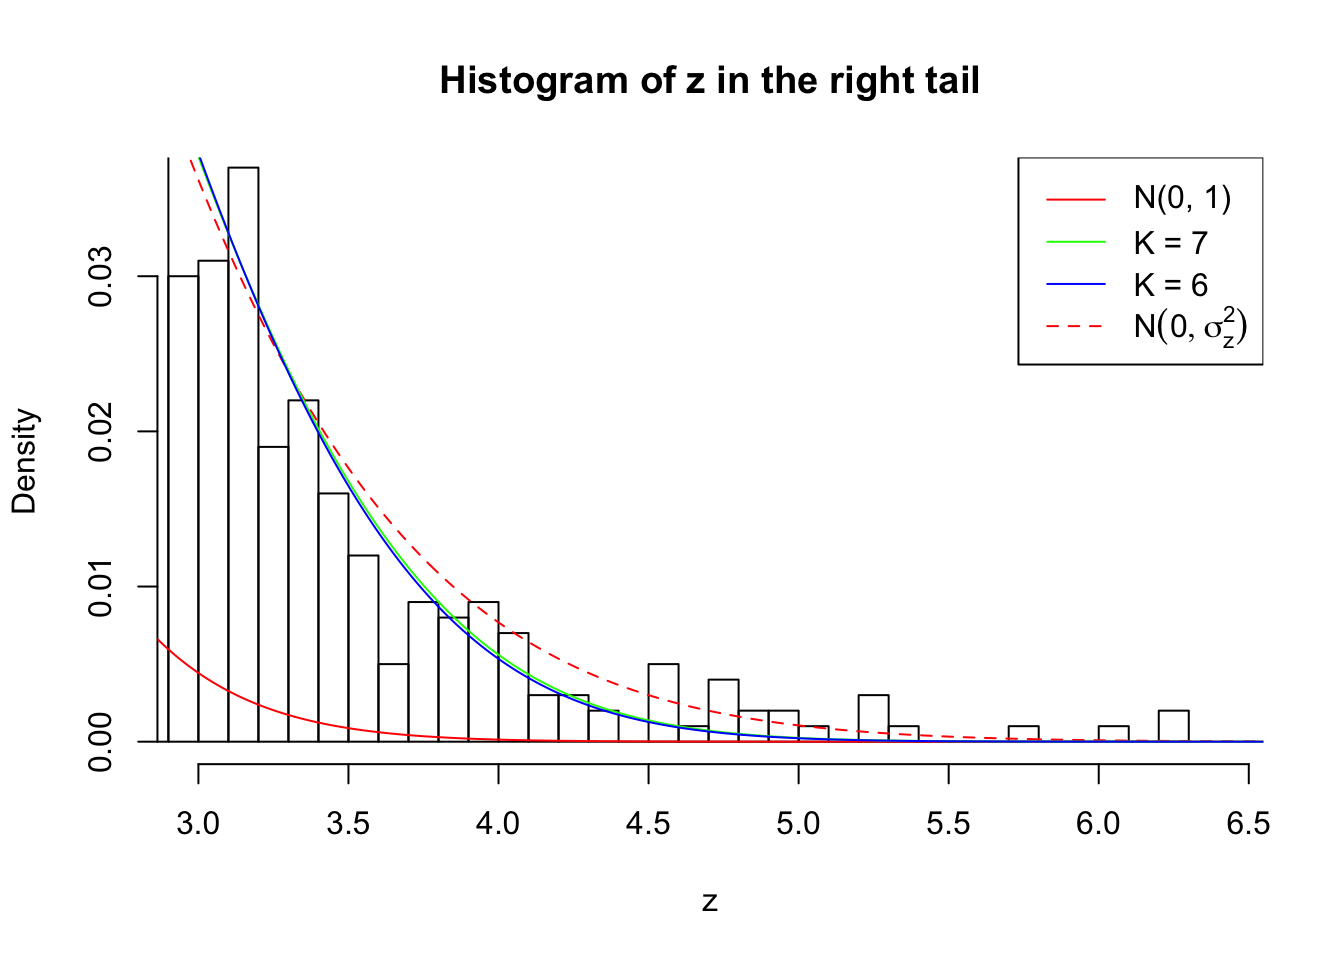
Example 5 :
SNR = 1 ;
True Distribution: N ( 0 , 2.258925 ) ;
Number of Discoveries: 408 ;
pihat0 = 0.3458893 ;
Log-likelihood by True Distribution N ( 0, 2.258925 ) : -18211.51 ;
Log-likelihood by Gaussian Derivatives with K = 7 : -18217.85 ;
Log-likelihood Ratio between True Distribution N ( 0, 2.258925 ) and Fitted Gaussian Derivatives with K = 7 : 6.346104 ;
Normalized Weights of Gaussian Derivatives with K = 7 :
1 : -0.0147557356837701 ; 2 : 0.847148023105142 ; 3 : -0.0300837913631588 ; 4 : 0.754691670792804 ; 5 : -0.0659841393438177 ; 6 : 0.381126272820956 ; 7 : -0.0839138576127453 ;
Log-likelihood by Gaussian Derivatives with K = 6 : -18235.4 ;
Log-likelihood Ratio between True Distribution N ( 0, 2.258925 ) and Fitted Gaussian Derivatives with K = 6 : 23.89227 ;
Normalized Weights of Gaussian Derivatives with K = 6 :
1 : -0.010980181886604 ; 2 : 0.844912871994996 ; 3 : 0.00150880666789093 ; 4 : 0.75052104096923 ; 5 : 0.0233674006241364 ; 6 : 0.377820750277234 ; 
Zoom in to the left tail: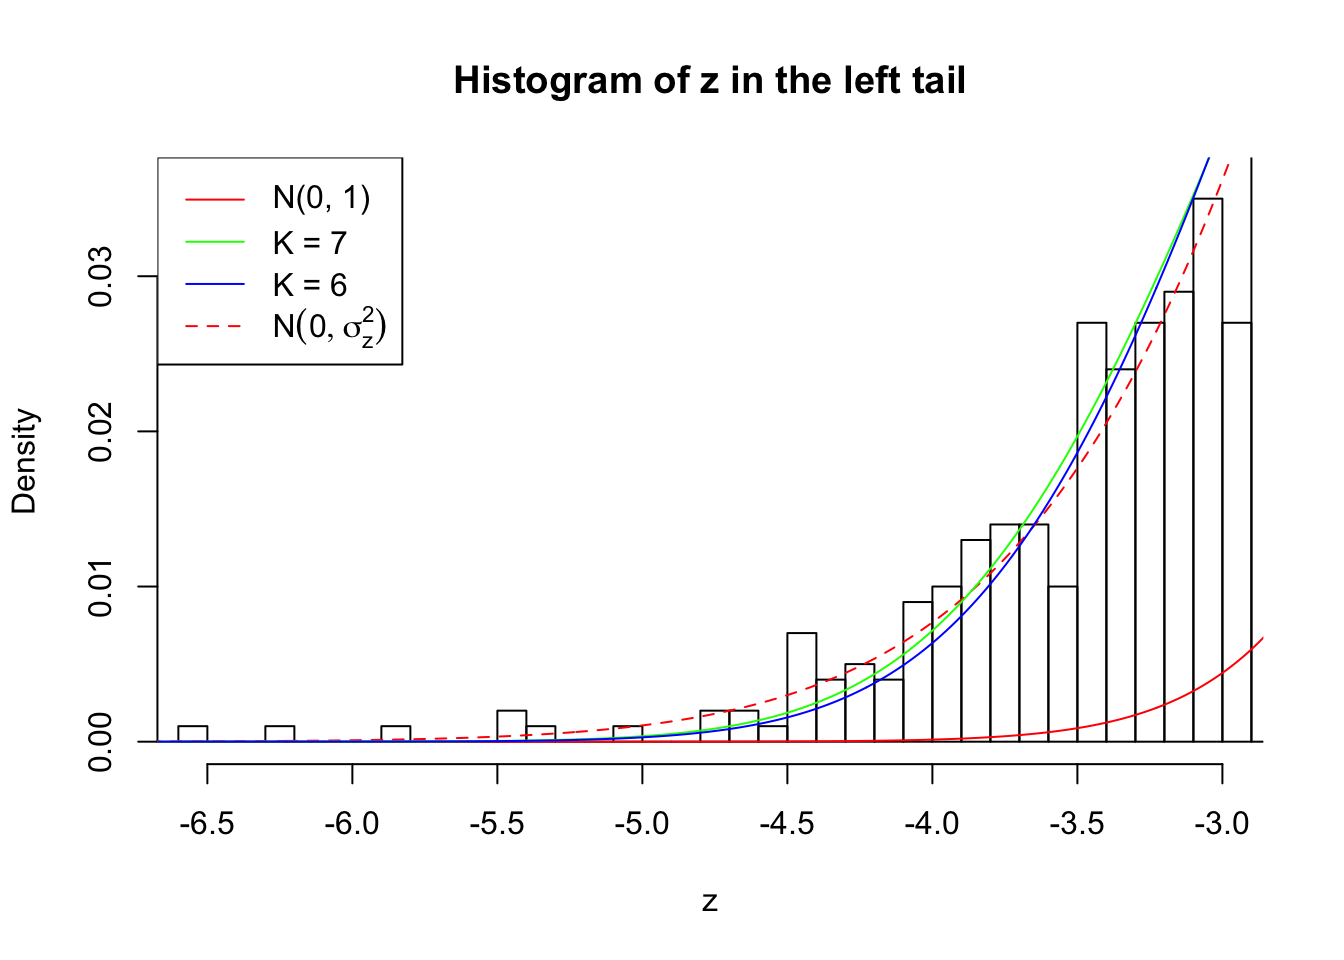
Zoom in to the right tail: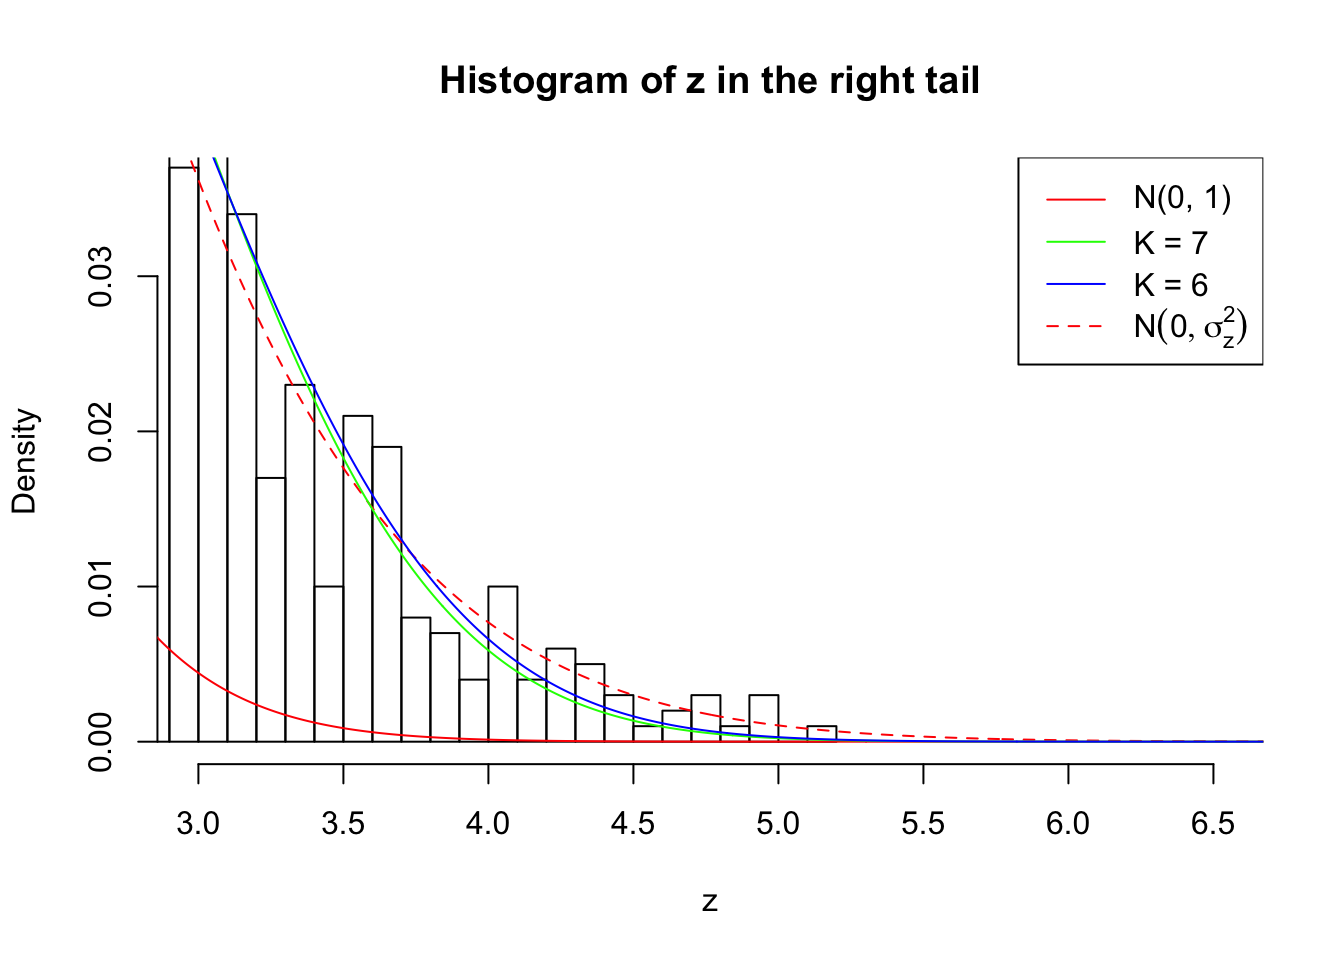
## SNR = 2 ; sigma_z = 1.60776 ; True Distribution: N ( 0 , 2.584893 ) .
Example 1 :
SNR = 2 ;
True Distribution: N ( 0 , 2.584893 ) ;
Number of Discoveries: 628 ;
pihat0 = 0.2014281 ;
Log-likelihood by True Distribution N ( 0, 2.584893 ) : -18883.1 ;
Log-likelihood by Gaussian Derivatives with K = 8 : -18848.21 ;
Log-likelihood Ratio between True Distribution N ( 0, 2.584893 ) and Fitted Gaussian Derivatives with K = 8 : -34.88926 ;
Normalized Weights of Gaussian Derivatives with K = 8 :
1 : 0.0136147919601149 ; 2 : 1.08274316136917 ; 3 : 0.00337518683255761 ; 4 : 1.23442521358308 ; 5 : -0.0312064980495082 ; 6 : 1.12436528722487 ; 7 : -0.00506440306881227 ; 8 : 0.563409031383621 ;
Log-likelihood by Gaussian Derivatives with K = 7 : -18958.36 ;
Log-likelihood Ratio between True Distribution N ( 0, 2.584893 ) and Fitted Gaussian Derivatives with K = 7 : 75.26143 ;
Normalized Weights of Gaussian Derivatives with K = 7 :
1 : 0.0119440041009122 ; 2 : 1.03844441321769 ; 3 : 0.000649045654352769 ; 4 : 0.937019524556236 ; 5 : -0.0326509618902091 ; 6 : 0.419393818733931 ; 7 : -0.00443309470441701 ; 

Zoom in to the left tail: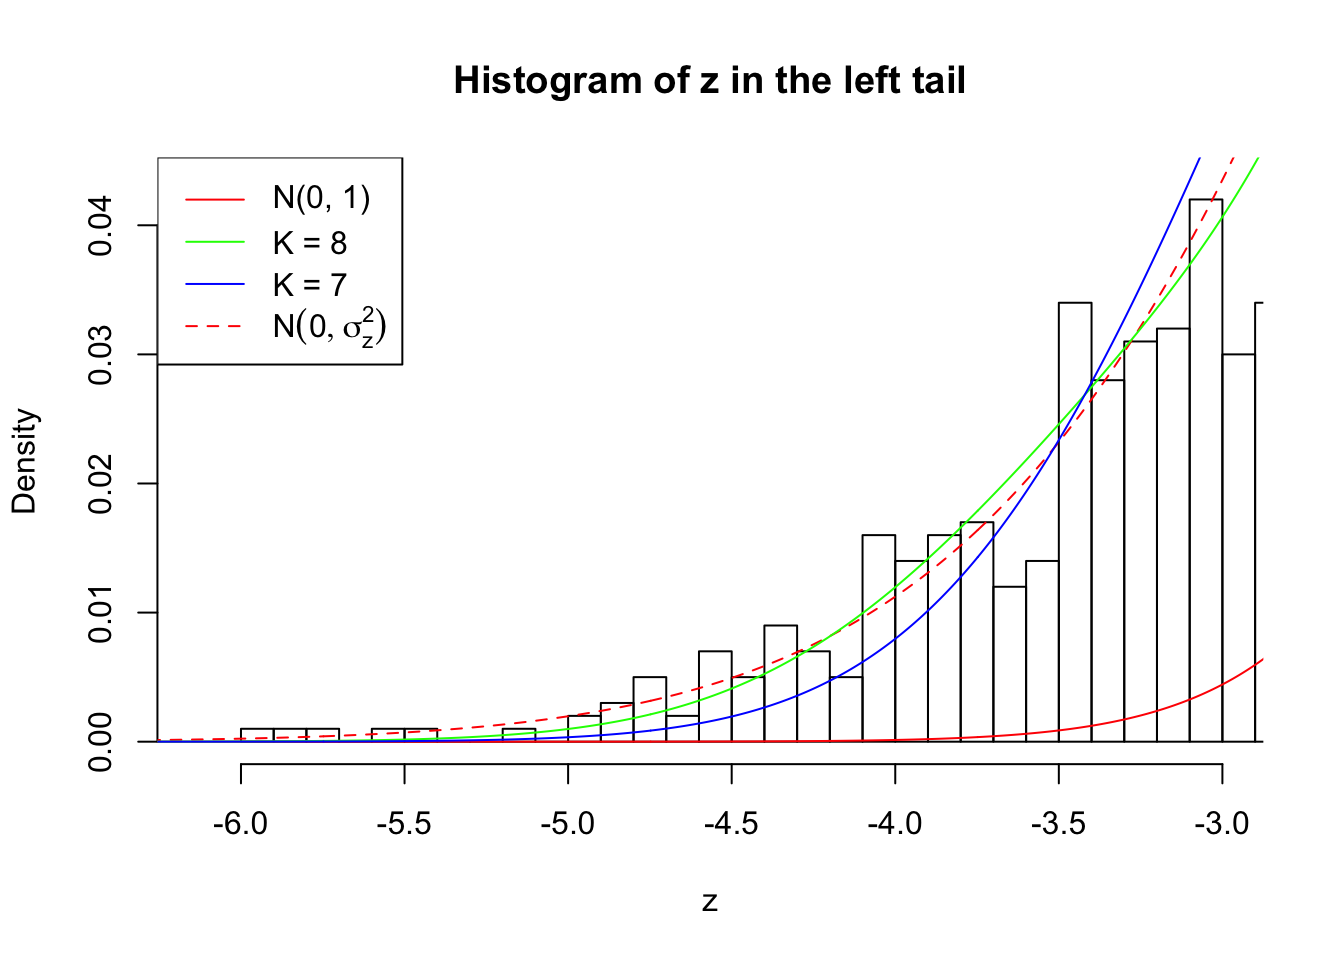
Zoom in to the right tail: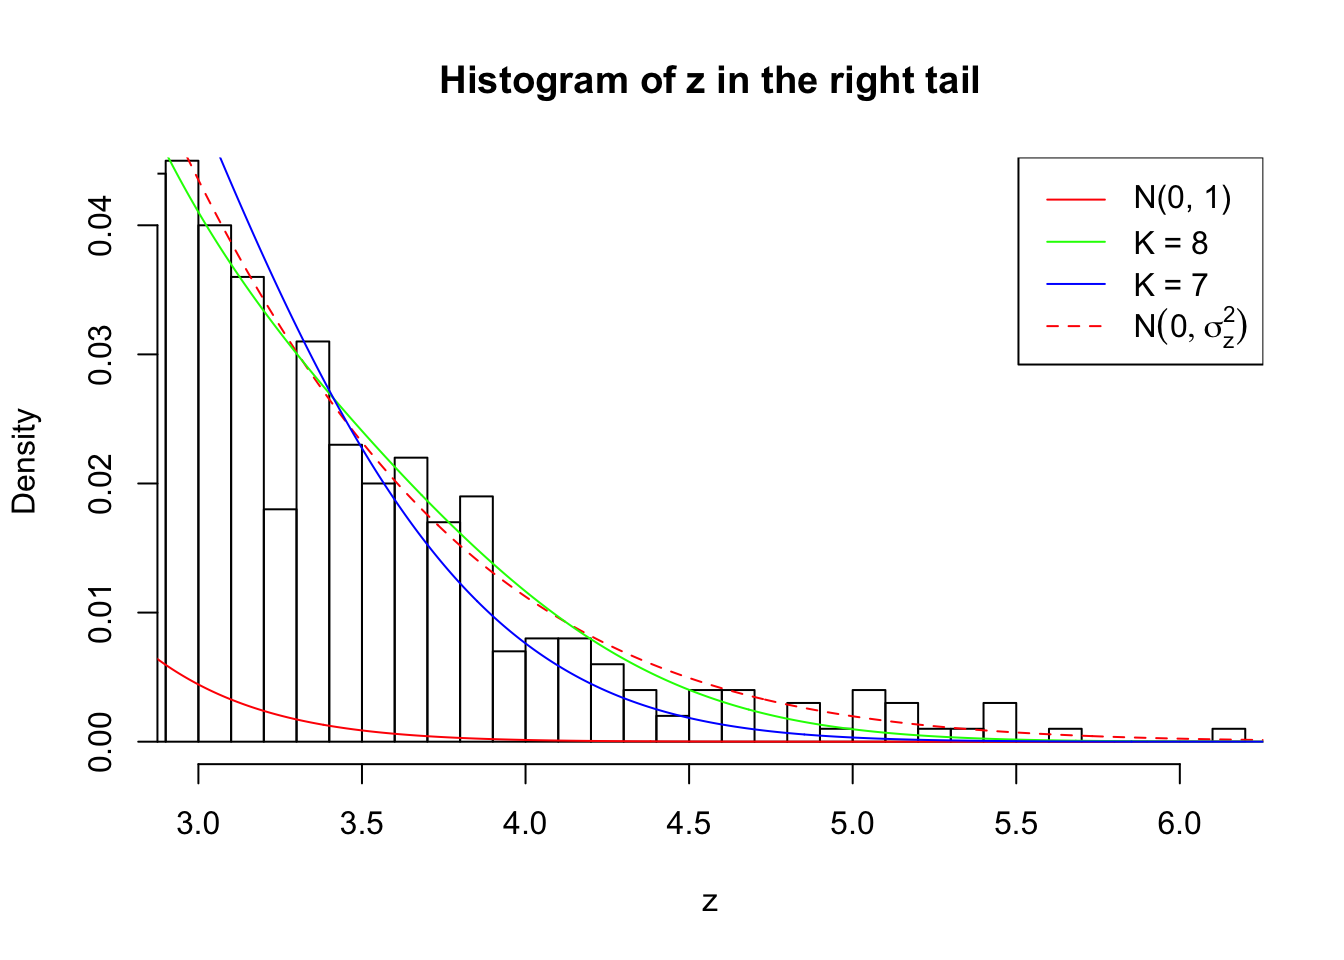
Example 2 :
SNR = 2 ;
True Distribution: N ( 0 , 2.584893 ) ;
Number of Discoveries: 700 ;
pihat0 = 0.2714964 ;
Log-likelihood by True Distribution N ( 0, 2.584893 ) : -18940.46 ;
Log-likelihood by Gaussian Derivatives with K = 7 : -19007.95 ;
Log-likelihood Ratio between True Distribution N ( 0, 2.584893 ) and Fitted Gaussian Derivatives with K = 7 : 67.48755 ;
Normalized Weights of Gaussian Derivatives with K = 7 :
1 : 0.0164681394830972 ; 2 : 1.05636276082517 ; 3 : 0.0393323297755097 ; 4 : 1.05810403869031 ; 5 : 0.038214655867539 ; 6 : 0.528683713570606 ; 7 : -0.00290938755991068 ;
Log-likelihood by Gaussian Derivatives with K = 6 : -19007.97 ;
Log-likelihood Ratio between True Distribution N ( 0, 2.584893 ) and Fitted Gaussian Derivatives with K = 6 : 67.50821 ;
Normalized Weights of Gaussian Derivatives with K = 6 :
1 : 0.016590918892684 ; 2 : 1.05638106370673 ; 3 : 0.0404683327631348 ; 4 : 1.05816543499172 ; 5 : 0.04141481562775 ; 6 : 0.528741840837135 ; 
Zoom in to the left tail: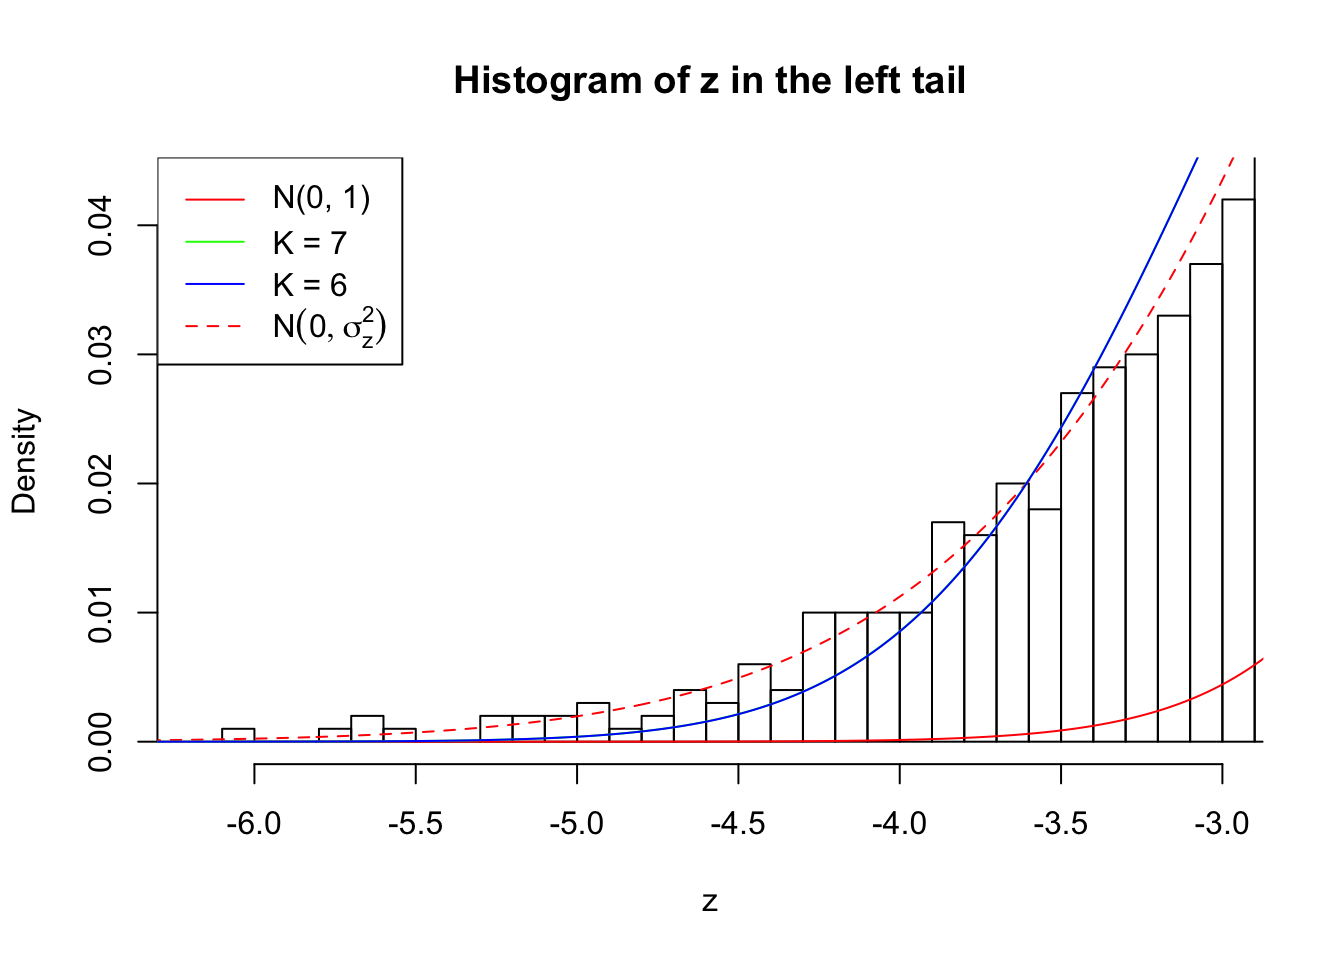
Zoom in to the right tail: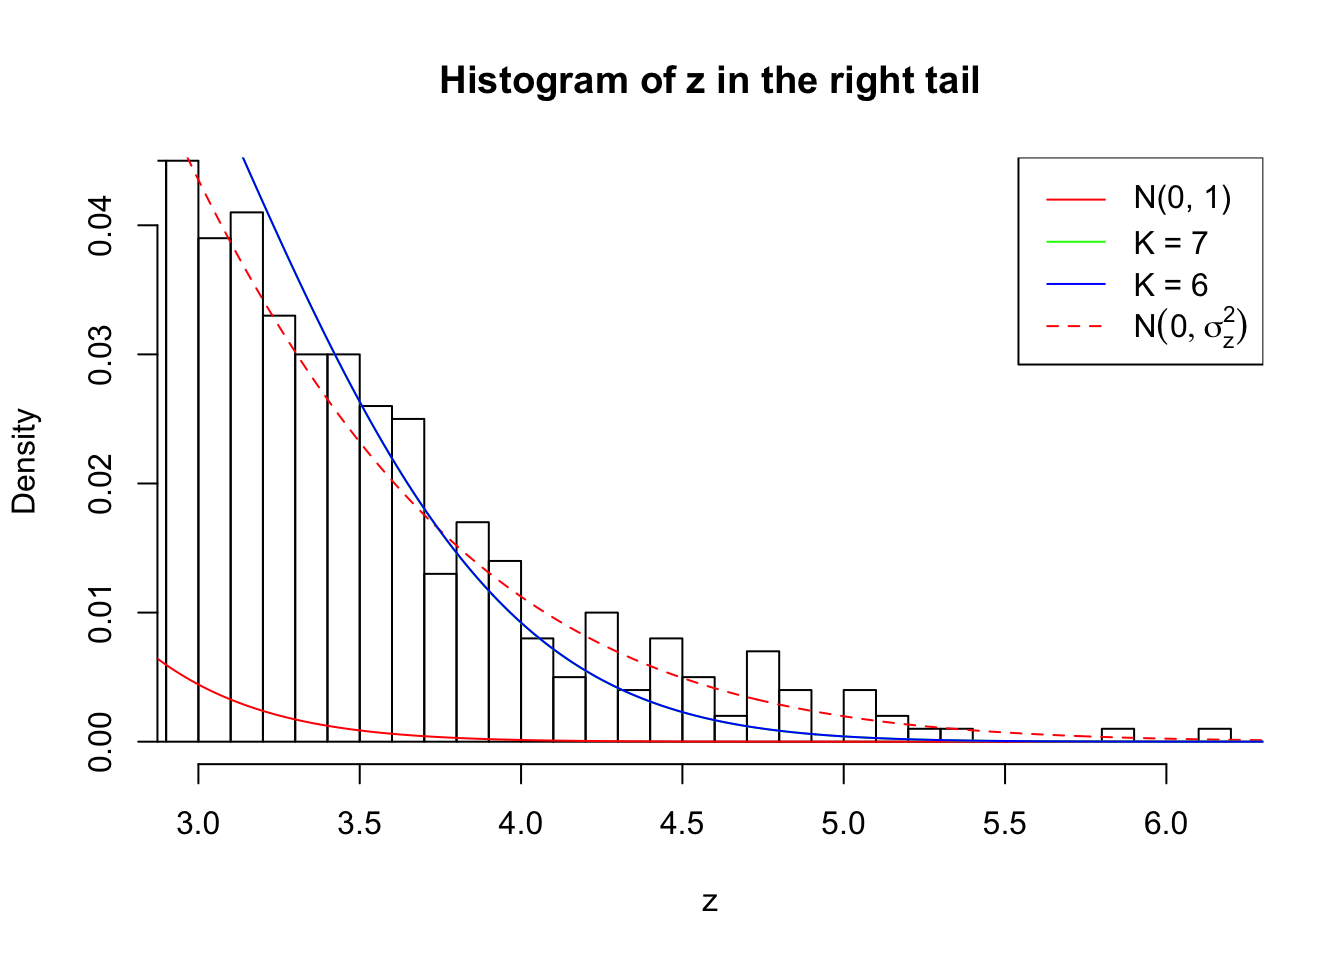
Example 3 :
SNR = 2 ;
True Distribution: N ( 0 , 2.584893 ) ;
Number of Discoveries: 727 ;
pihat0 = 0.3134389 ;
Log-likelihood by True Distribution N ( 0, 2.584893 ) : -18986.24 ;
Log-likelihood by Gaussian Derivatives with K = 6 : -19025.86 ;
Log-likelihood Ratio between True Distribution N ( 0, 2.584893 ) and Fitted Gaussian Derivatives with K = 6 : 39.6199 ;
Normalized Weights of Gaussian Derivatives with K = 6 :
1 : 0.034411297708113 ; 2 : 1.0798301969158 ; 3 : 0.0387605138305727 ; 4 : 1.09993225357172 ; 5 : 0.0189586458609482 ; 6 : 0.549984526433354 ;
Log-likelihood by Gaussian Derivatives with K = 5 : -19213.48 ;
Log-likelihood Ratio between True Distribution N ( 0, 2.584893 ) and Fitted Gaussian Derivatives with K = 5 : 227.2411 ;
Normalized Weights of Gaussian Derivatives with K = 5 :
1 : 0.0305257775976203 ; 2 : 0.961133806275765 ; 3 : 0.0266825322421371 ; 4 : 0.611958147781872 ; 5 : 0.0048237348092036 ; 


Zoom in to the left tail: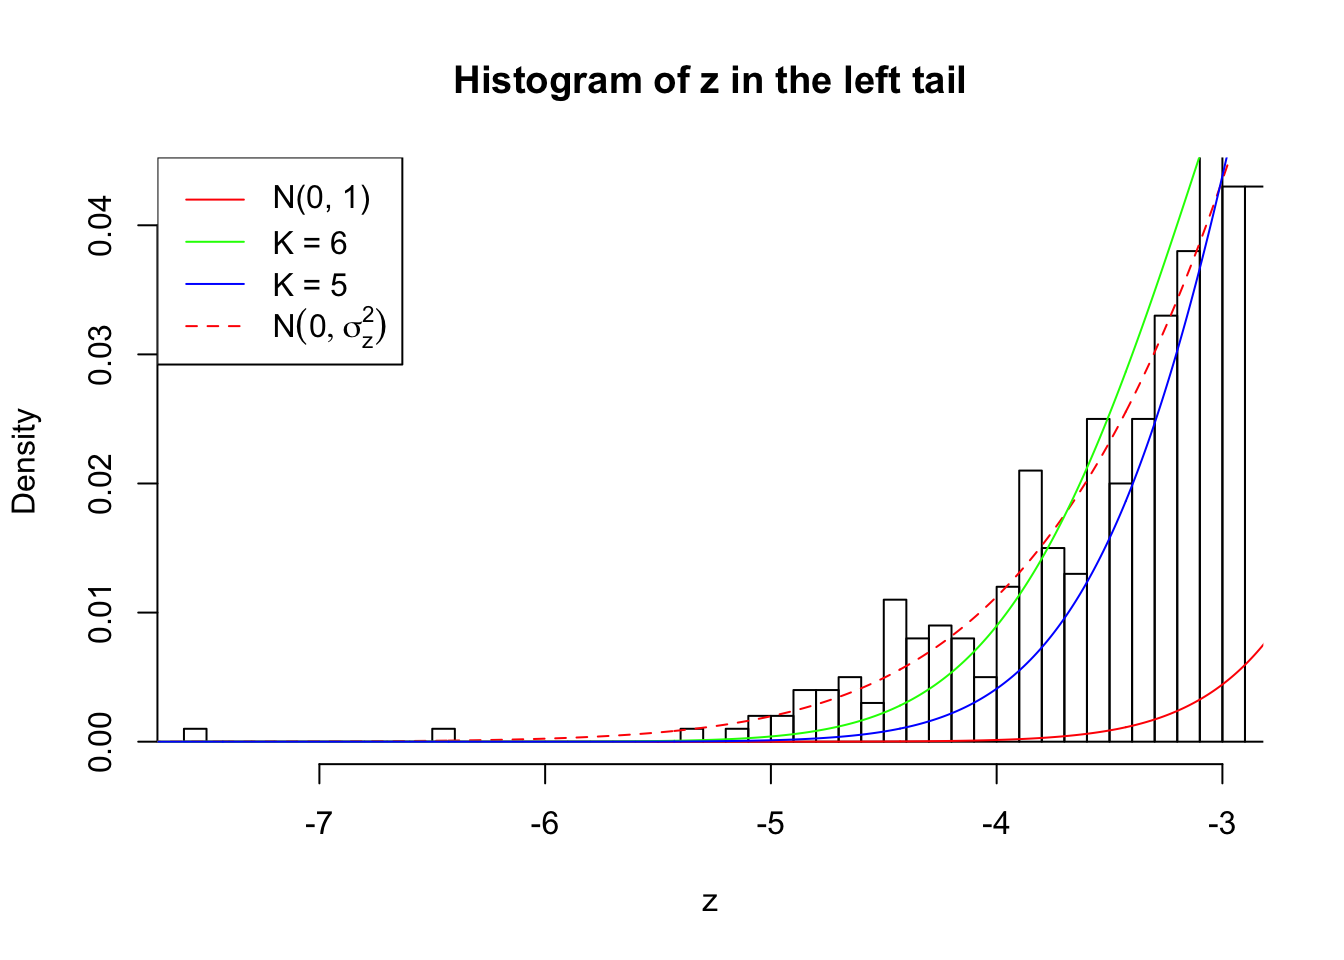
Zoom in to the right tail: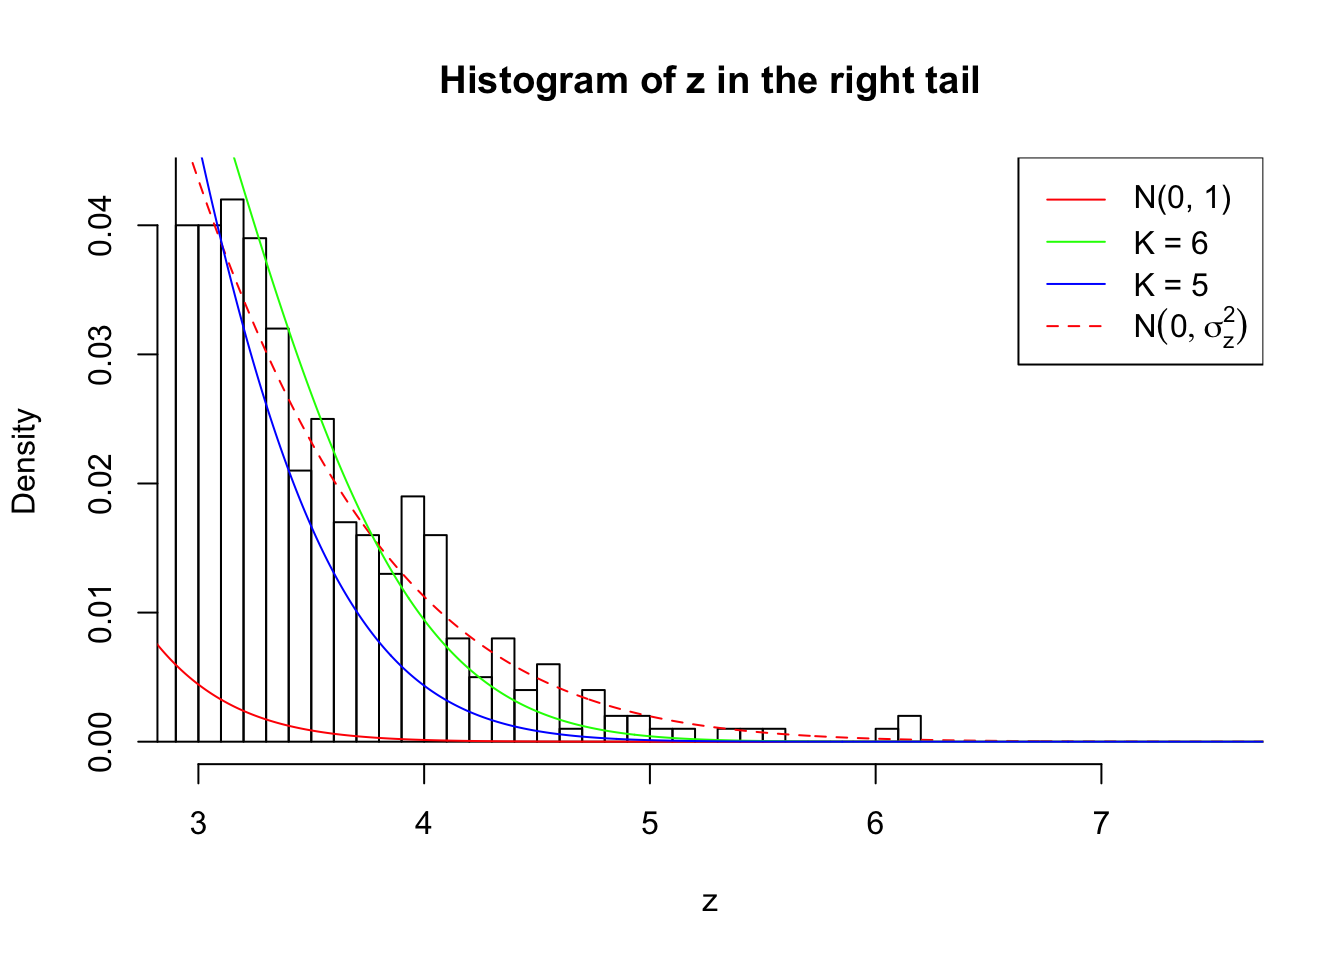
Example 4 :
SNR = 2 ;
True Distribution: N ( 0 , 2.584893 ) ;
Number of Discoveries: 754 ;
pihat0 = 0.2578183 ;
Log-likelihood by True Distribution N ( 0, 2.584893 ) : -18986.44 ;
Log-likelihood by Gaussian Derivatives with K = 7 : -19023.87 ;
Log-likelihood Ratio between True Distribution N ( 0, 2.584893 ) and Fitted Gaussian Derivatives with K = 7 : 37.42848 ;
Normalized Weights of Gaussian Derivatives with K = 7 :
1 : -0.0120449529453214 ; 2 : 1.08764707514979 ; 3 : -0.0272343286937293 ; 4 : 1.07640403751387 ; 5 : -0.0277378881145104 ; 6 : 0.530056762448694 ; 7 : 0.00998347331685409 ;
Log-likelihood by Gaussian Derivatives with K = 6 : -19024.22 ;
Log-likelihood Ratio between True Distribution N ( 0, 2.584893 ) and Fitted Gaussian Derivatives with K = 6 : 37.77873 ;
Normalized Weights of Gaussian Derivatives with K = 6 :
1 : -0.012497468175113 ; 2 : 1.08756111671169 ; 3 : -0.0313106614773657 ; 4 : 1.07622274974305 ; 5 : -0.0389318140481279 ; 6 : 0.529903478383342 ; 


Zoom in to the left tail: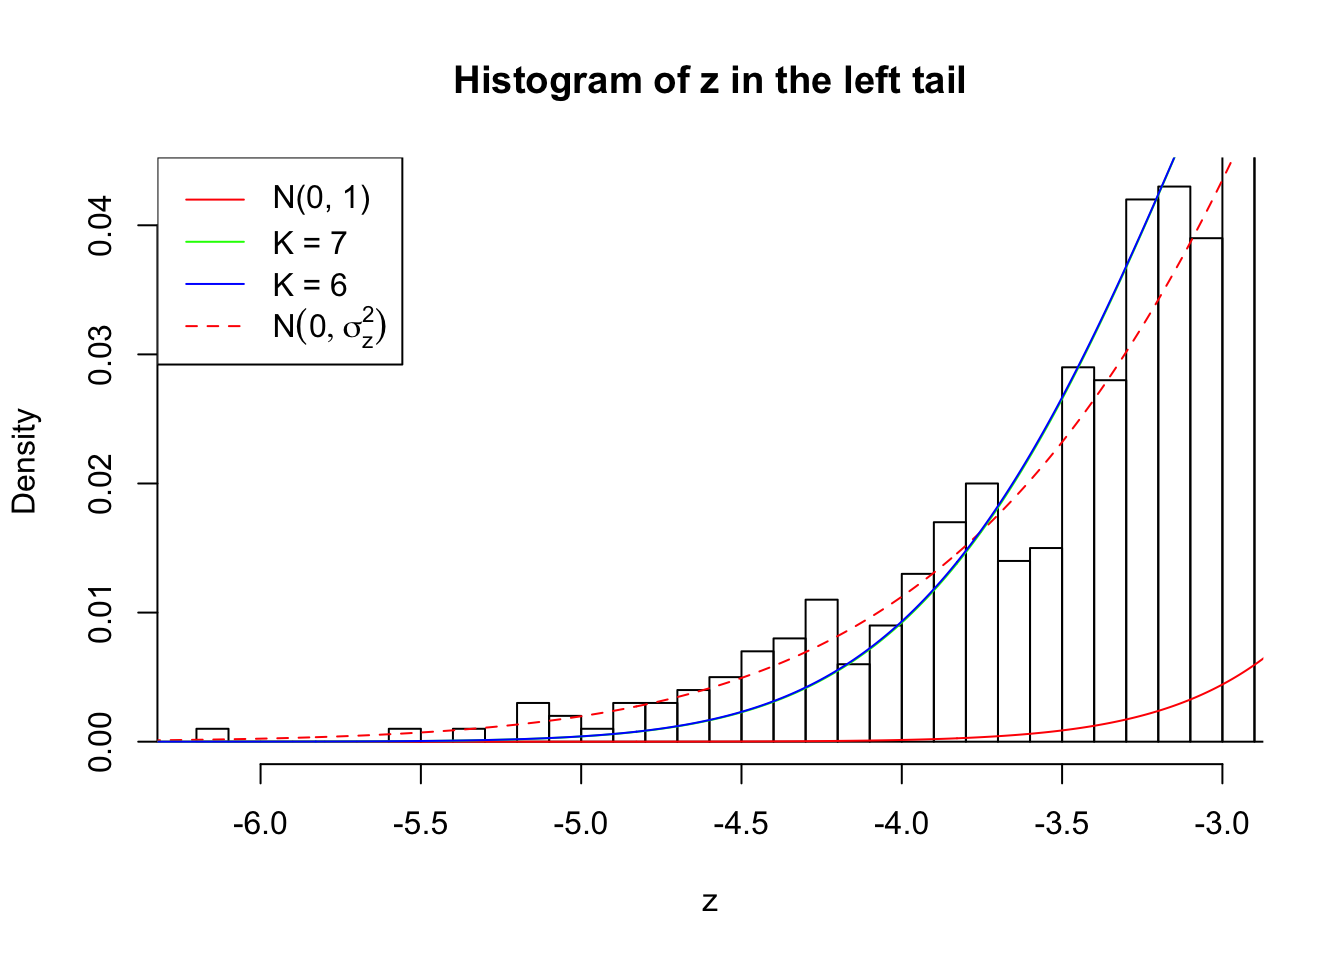
Zoom in to the right tail: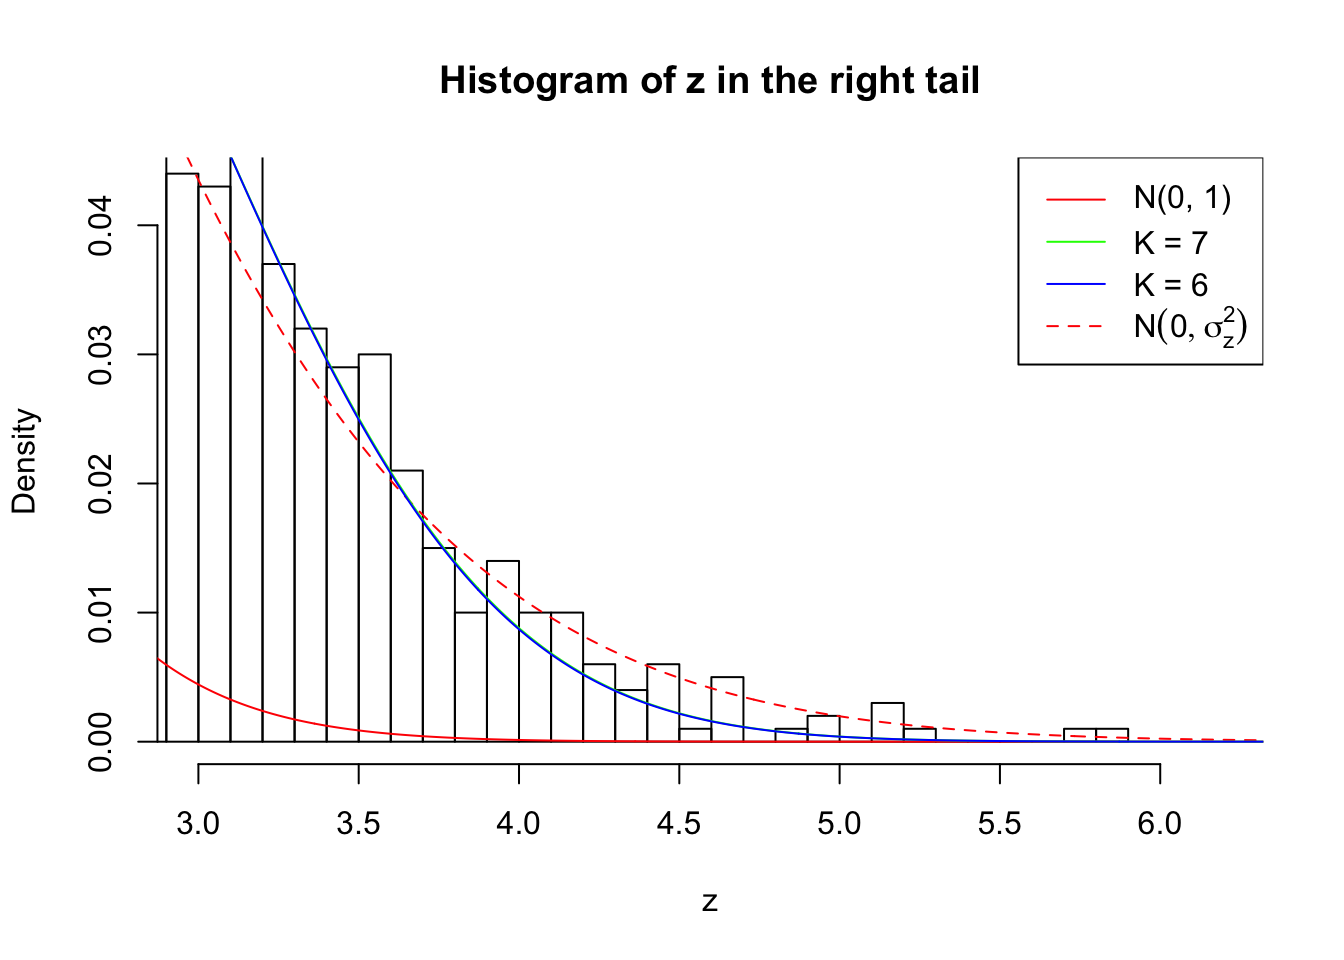
Example 5 :
SNR = 2 ;
True Distribution: N ( 0 , 2.584893 ) ;
Number of Discoveries: 684 ;
pihat0 = 0.2336033 ;
Log-likelihood by True Distribution N ( 0, 2.584893 ) : -18910.99 ;
Log-likelihood by Gaussian Derivatives with K = 7 : -18946.39 ;
Log-likelihood Ratio between True Distribution N ( 0, 2.584893 ) and Fitted Gaussian Derivatives with K = 7 : 35.40402 ;
Normalized Weights of Gaussian Derivatives with K = 7 :
1 : -0.0128409389534885 ; 2 : 1.05565637812346 ; 3 : -0.0698680521778894 ; 4 : 1.00753208077044 ; 5 : -0.0136057563515818 ; 6 : 0.530753658180936 ; 7 : 0.0276611410399095 ;
Log-likelihood by Gaussian Derivatives with K = 6 : -18956.21 ;
Log-likelihood Ratio between True Distribution N ( 0, 2.584893 ) and Fitted Gaussian Derivatives with K = 6 : 45.22527 ;
Normalized Weights of Gaussian Derivatives with K = 6 :
1 : -0.0141250515327056 ; 2 : 1.05415473078761 ; 3 : -0.0806873609624797 ; 4 : 1.00529296660644 ; 5 : -0.0440799147371776 ; 6 : 0.529284900907757 ; 


Zoom in to the left tail: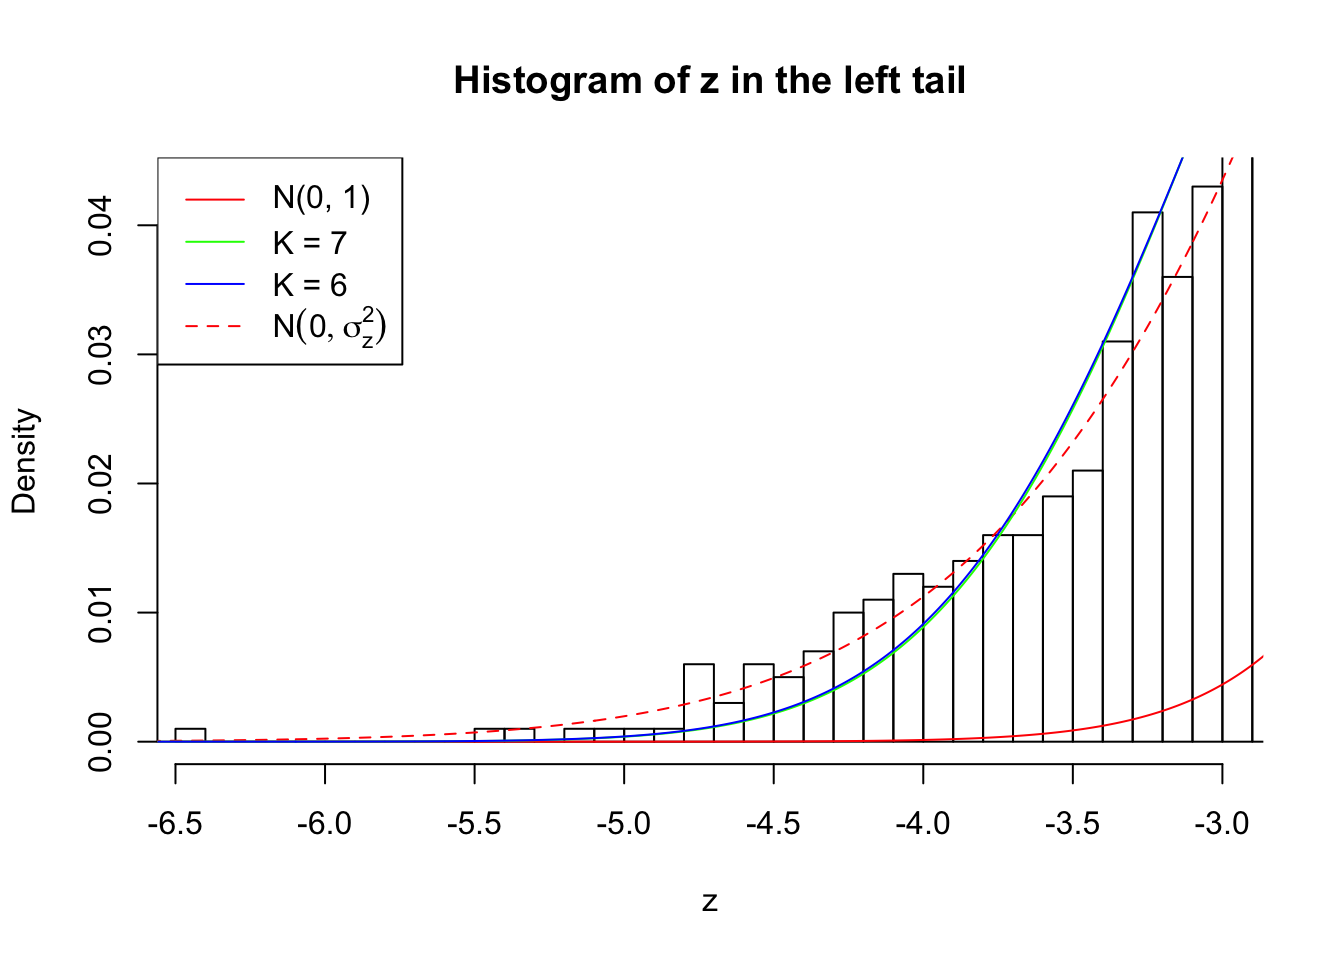
Zoom in to the right tail: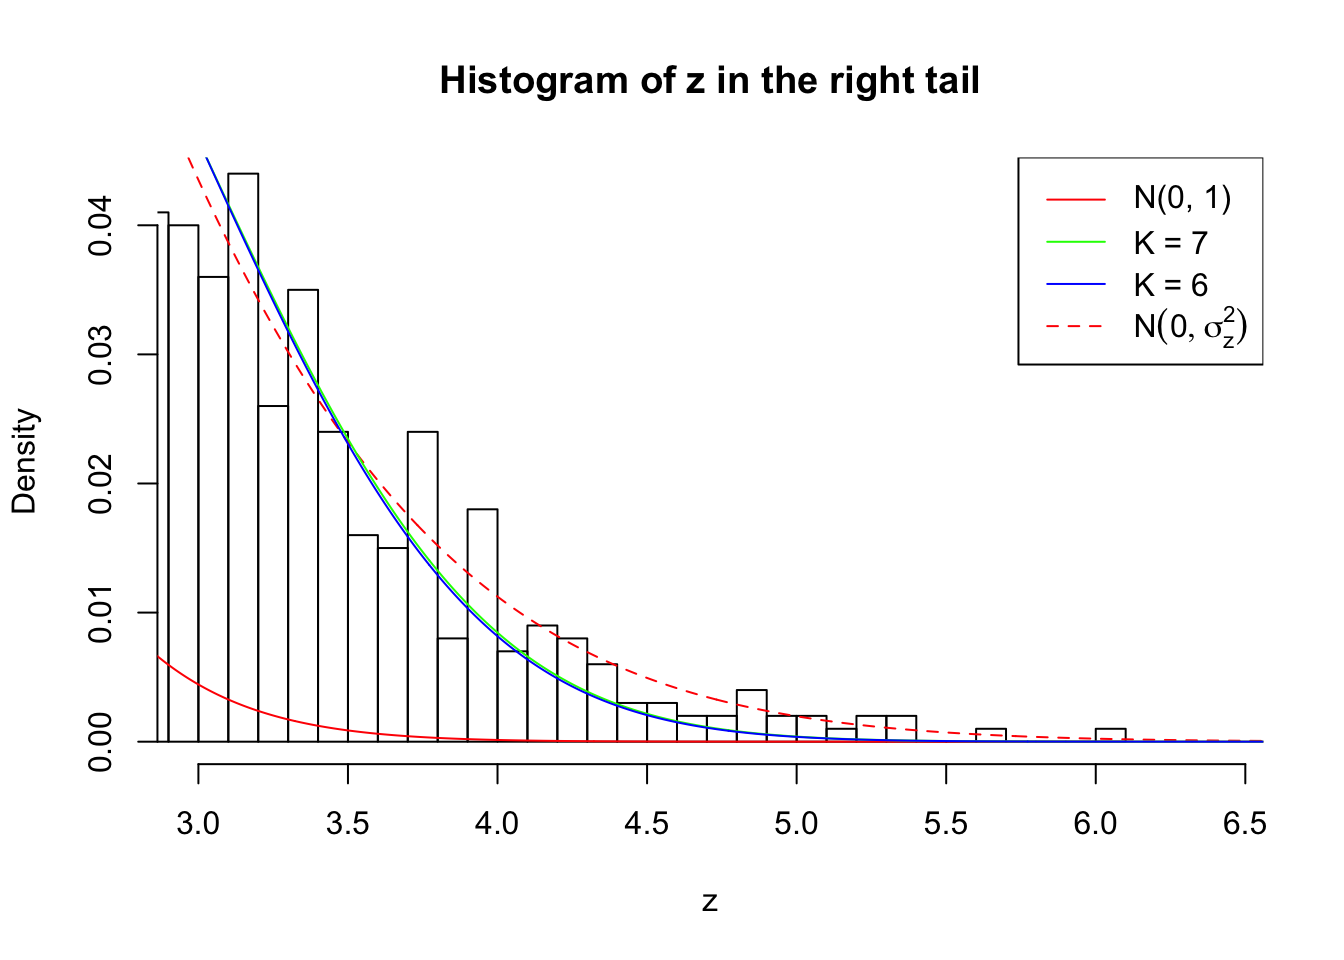
## SNR = 3 ; sigma_z = 1.730683 ; True Distribution: N ( 0 , 2.995262 ) .
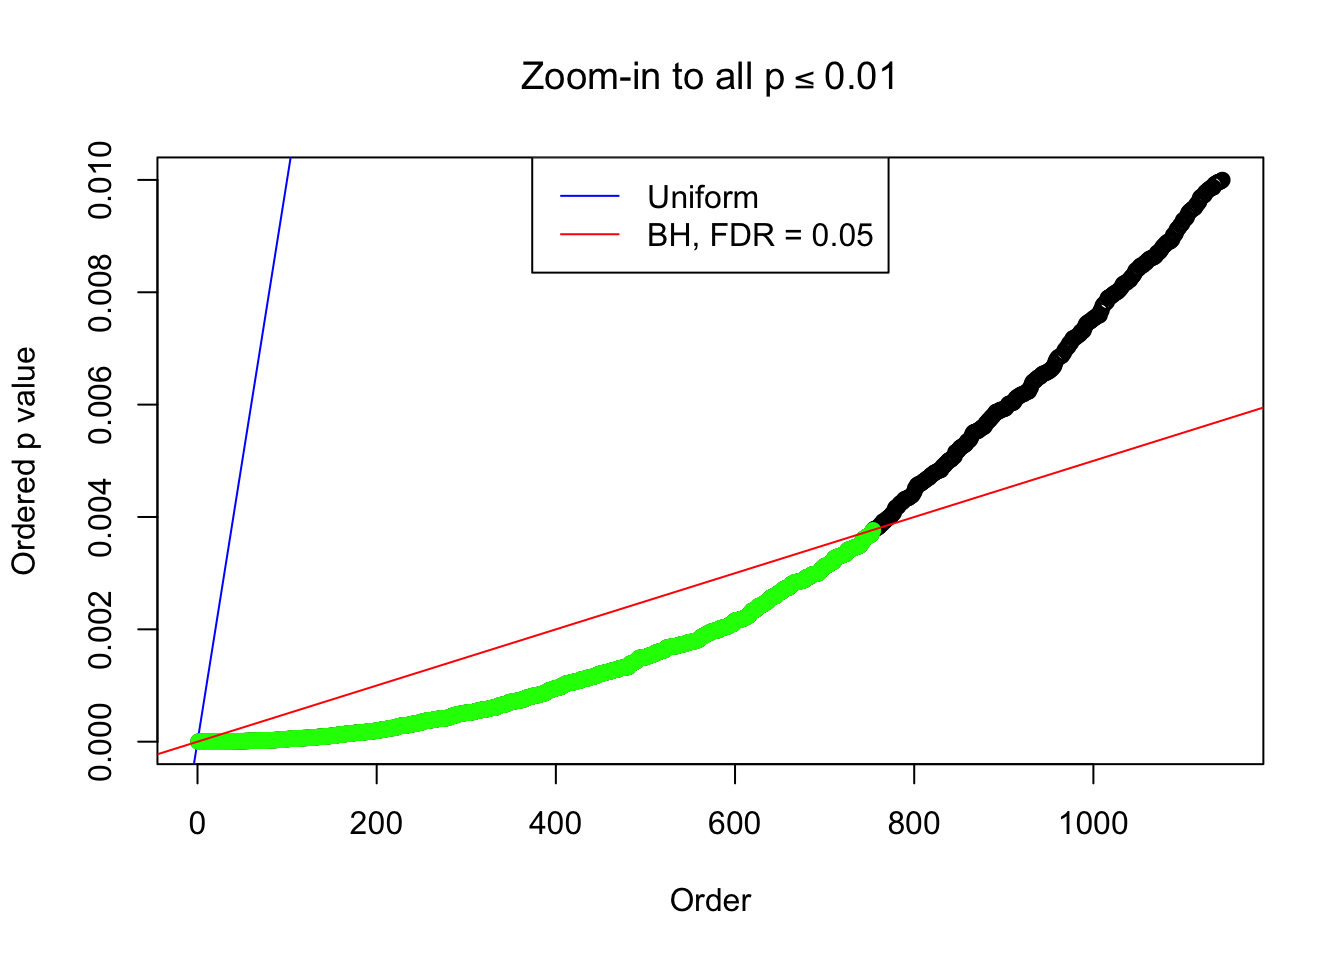
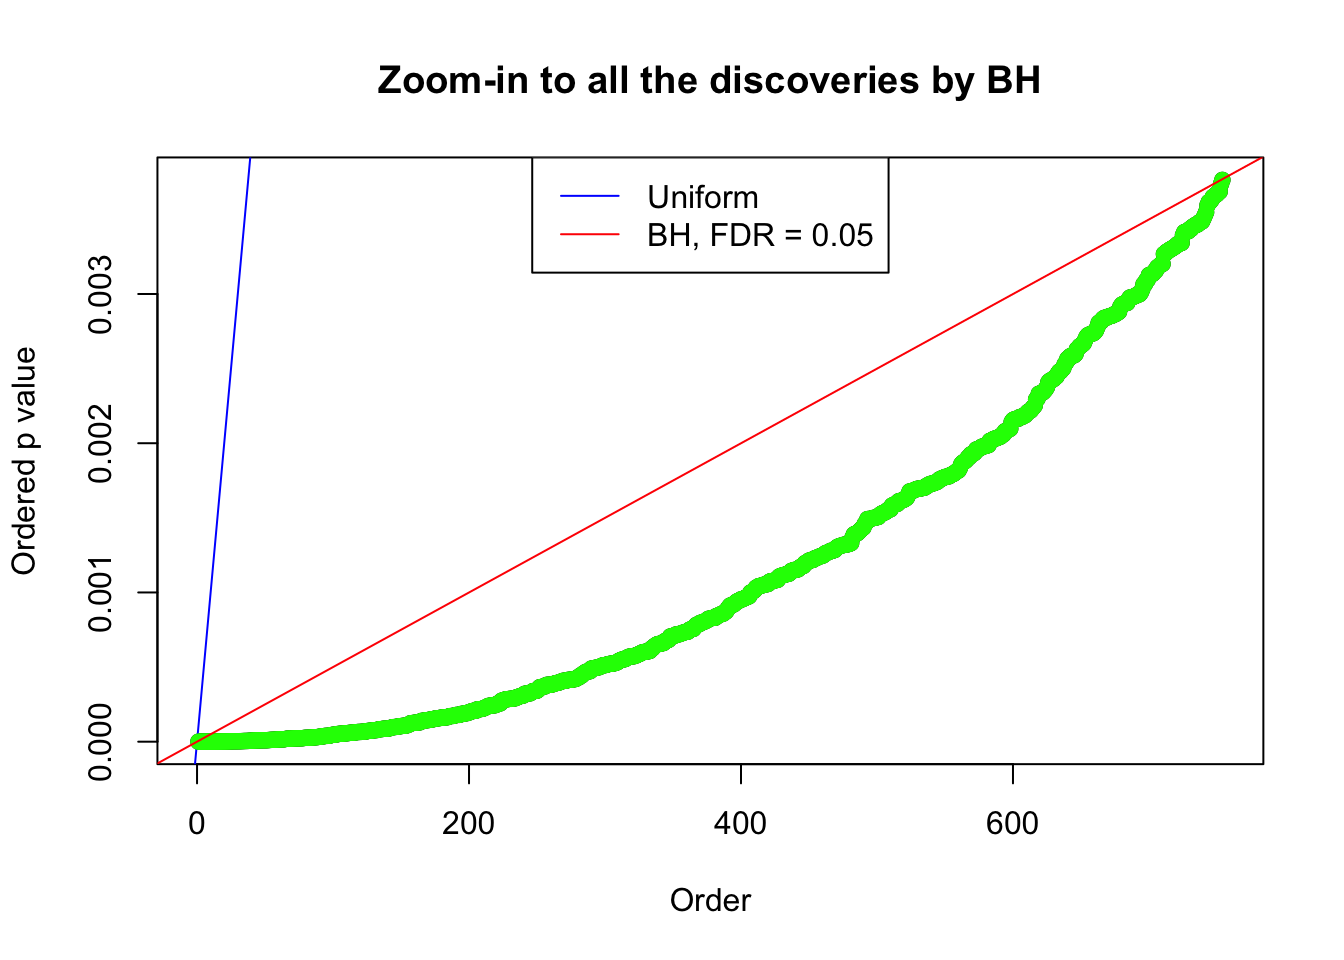
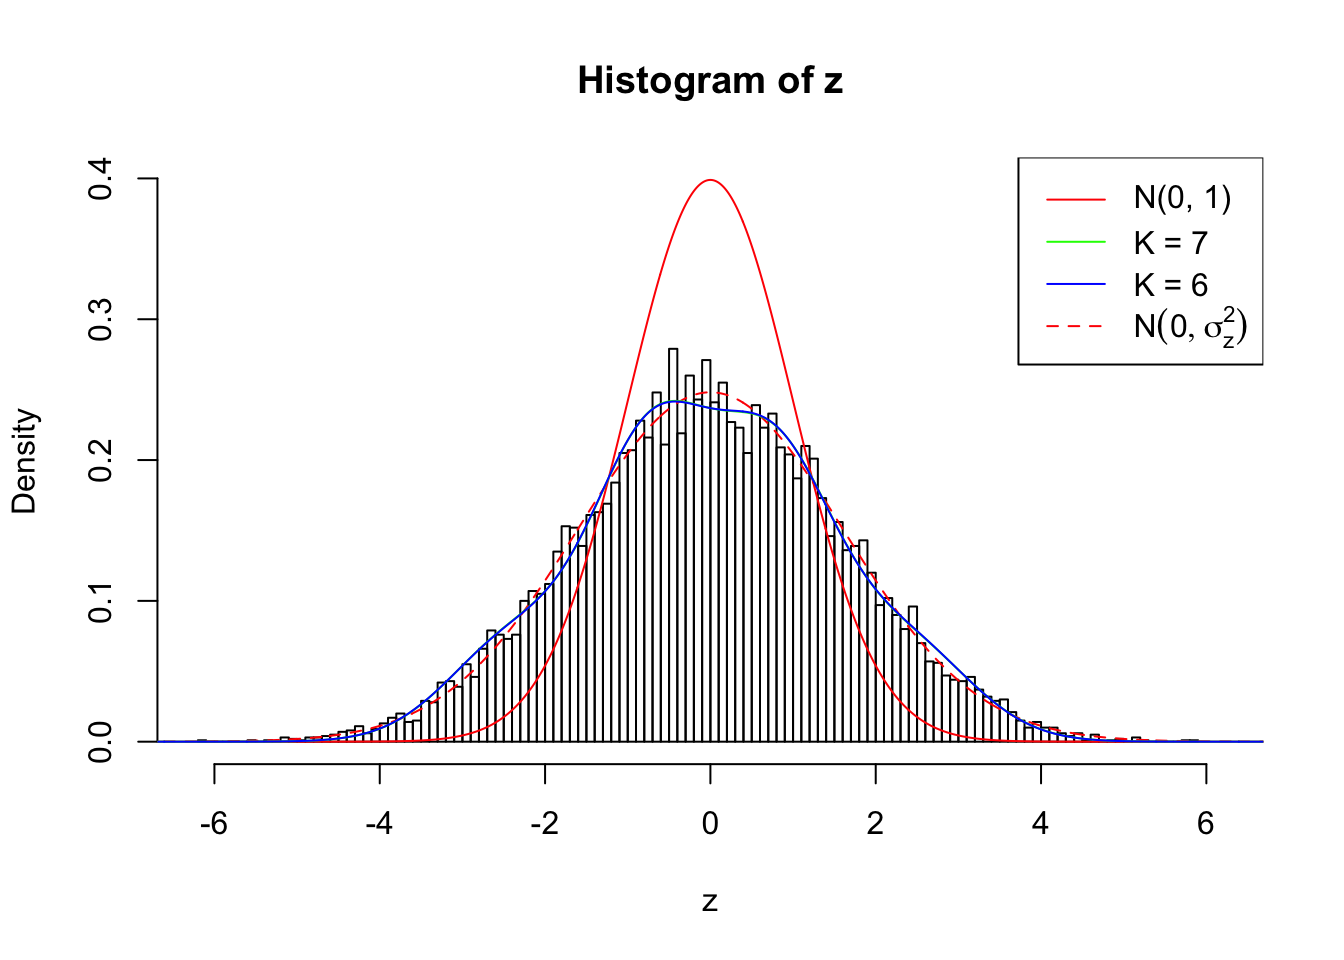
Example 1 :
SNR = 3 ;
True Distribution: N ( 0 , 2.995262 ) ;
Number of Discoveries: 1137 ;
pihat0 = 0.2002261 ;
Log-likelihood by True Distribution N ( 0, 2.995262 ) : -19749.88 ;
Log-likelihood by Gaussian Derivatives with K = 6 : -19874.22 ;
Log-likelihood Ratio between True Distribution N ( 0, 2.995262 ) and Fitted Gaussian Derivatives with K = 6 : 124.3455 ;
Normalized Weights of Gaussian Derivatives with K = 6 :
1 : 0.0288992302921886 ; 2 : 1.30366812740725 ; 3 : 0.0628160596849958 ; 4 : 1.41969523193942 ; 5 : 0.0612663914524723 ; 6 : 0.736859567348341 ;
Log-likelihood by Gaussian Derivatives with K = 5 : -20225.09 ;
Log-likelihood Ratio between True Distribution N ( 0, 2.995262 ) and Fitted Gaussian Derivatives with K = 5 : 475.2066 ;
Normalized Weights of Gaussian Derivatives with K = 5 :
1 : 0.0238158009072628 ; 2 : 1.14465614448965 ; 3 : 0.0384889963108962 ; 4 : 0.757296526468208 ; 5 : 0.035015557729069 ; 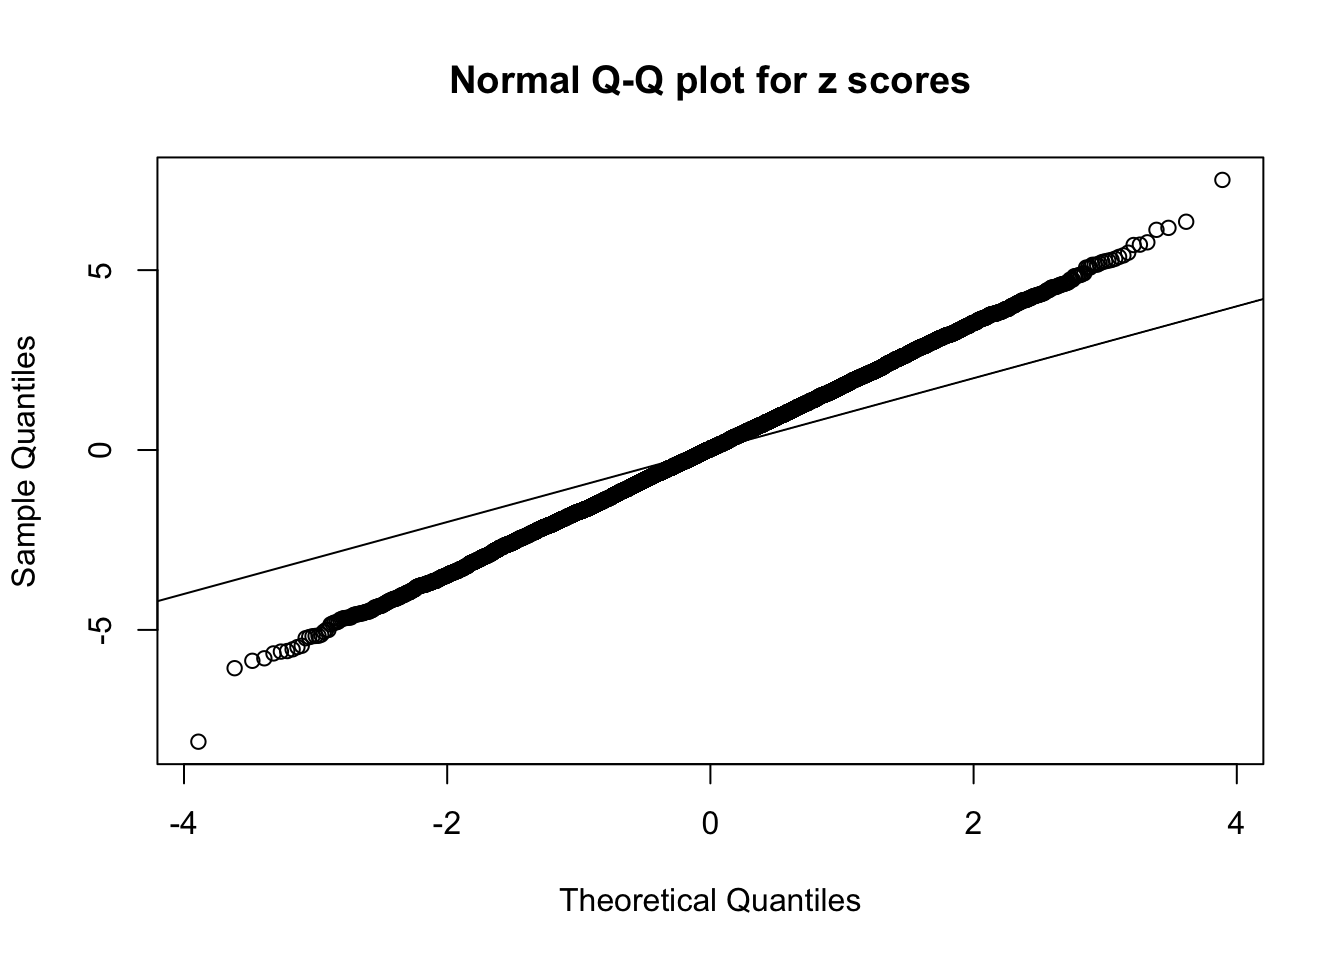


Zoom in to the left tail: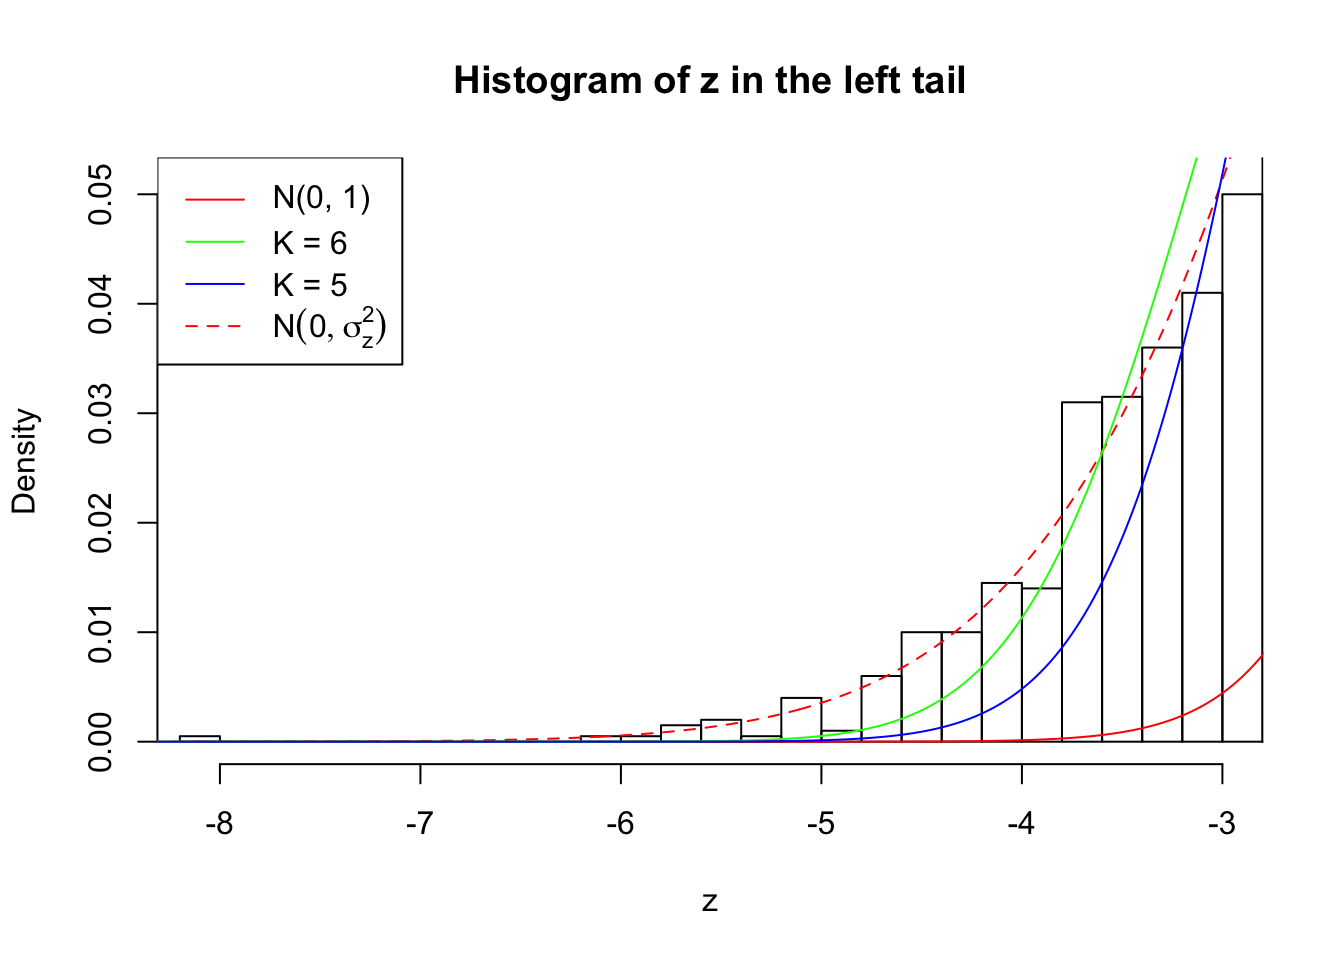
Zoom in to the right tail: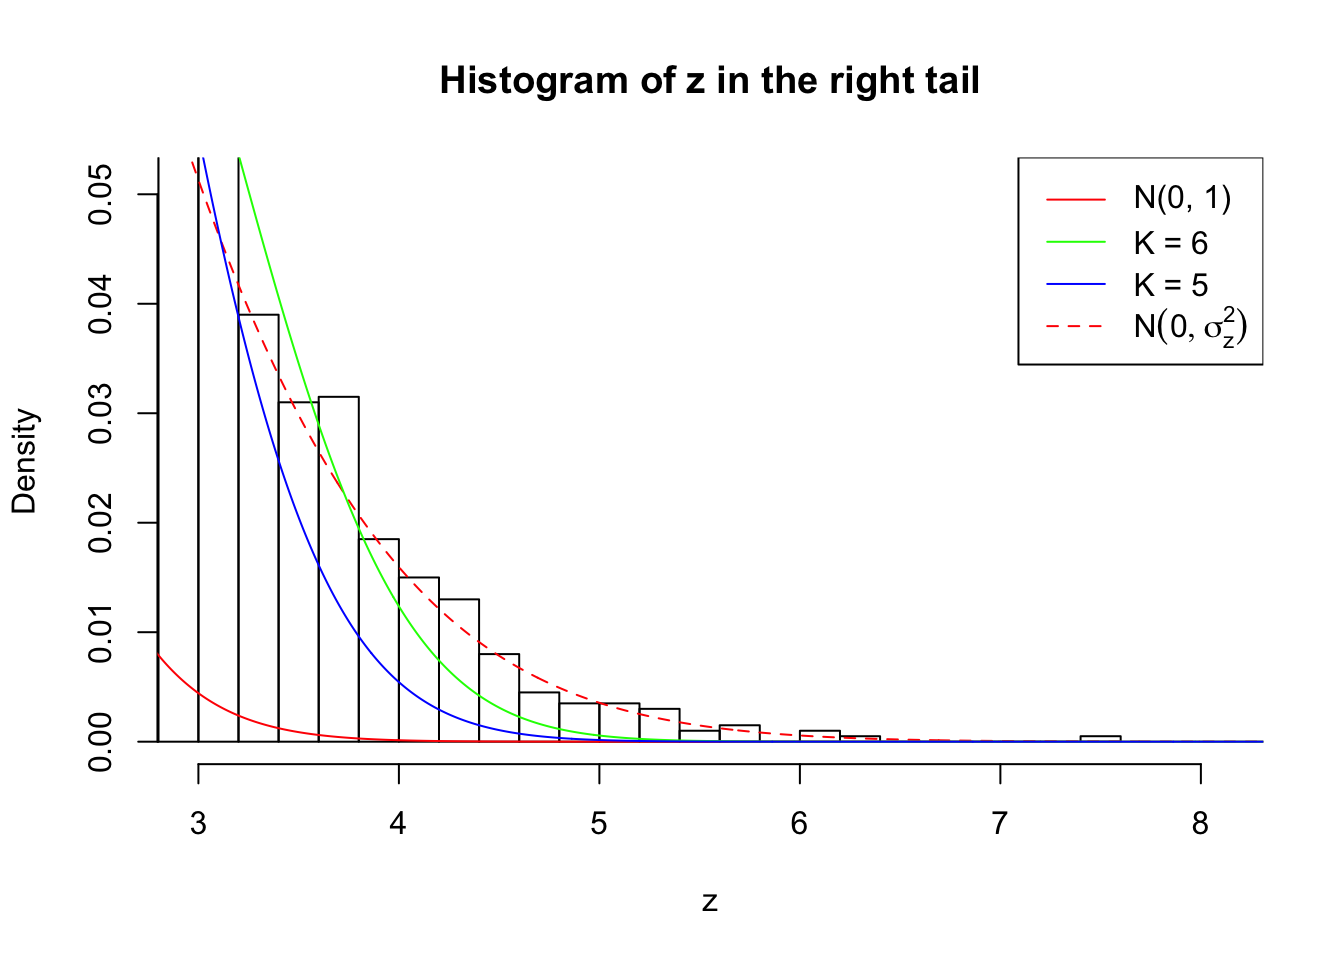
Example 2 :
SNR = 3 ;
True Distribution: N ( 0 , 2.995262 ) ;
Number of Discoveries: 1053 ;
pihat0 = 0.236766 ;
Log-likelihood by True Distribution N ( 0, 2.995262 ) : -19681.48 ;
Log-likelihood by Gaussian Derivatives with K = 6 : -19815.82 ;
Log-likelihood Ratio between True Distribution N ( 0, 2.995262 ) and Fitted Gaussian Derivatives with K = 6 : 134.3427 ;
Normalized Weights of Gaussian Derivatives with K = 6 :
1 : 0.00318211711794664 ; 2 : 1.30247550307223 ; 3 : -0.0172188218881736 ; 4 : 1.42702661114986 ; 5 : -0.0363262272592029 ; 6 : 0.717683859109124 ;
Log-likelihood by Gaussian Derivatives with K = 5 : -20085.13 ;
Log-likelihood Ratio between True Distribution N ( 0, 2.995262 ) and Fitted Gaussian Derivatives with K = 5 : 403.6479 ;
Normalized Weights of Gaussian Derivatives with K = 5 :
1 : 0.0104814304575098 ; 2 : 1.13675011442731 ; 3 : 0.00188184844839905 ; 4 : 0.756404381575781 ; 5 : -0.0199154232069253 ; 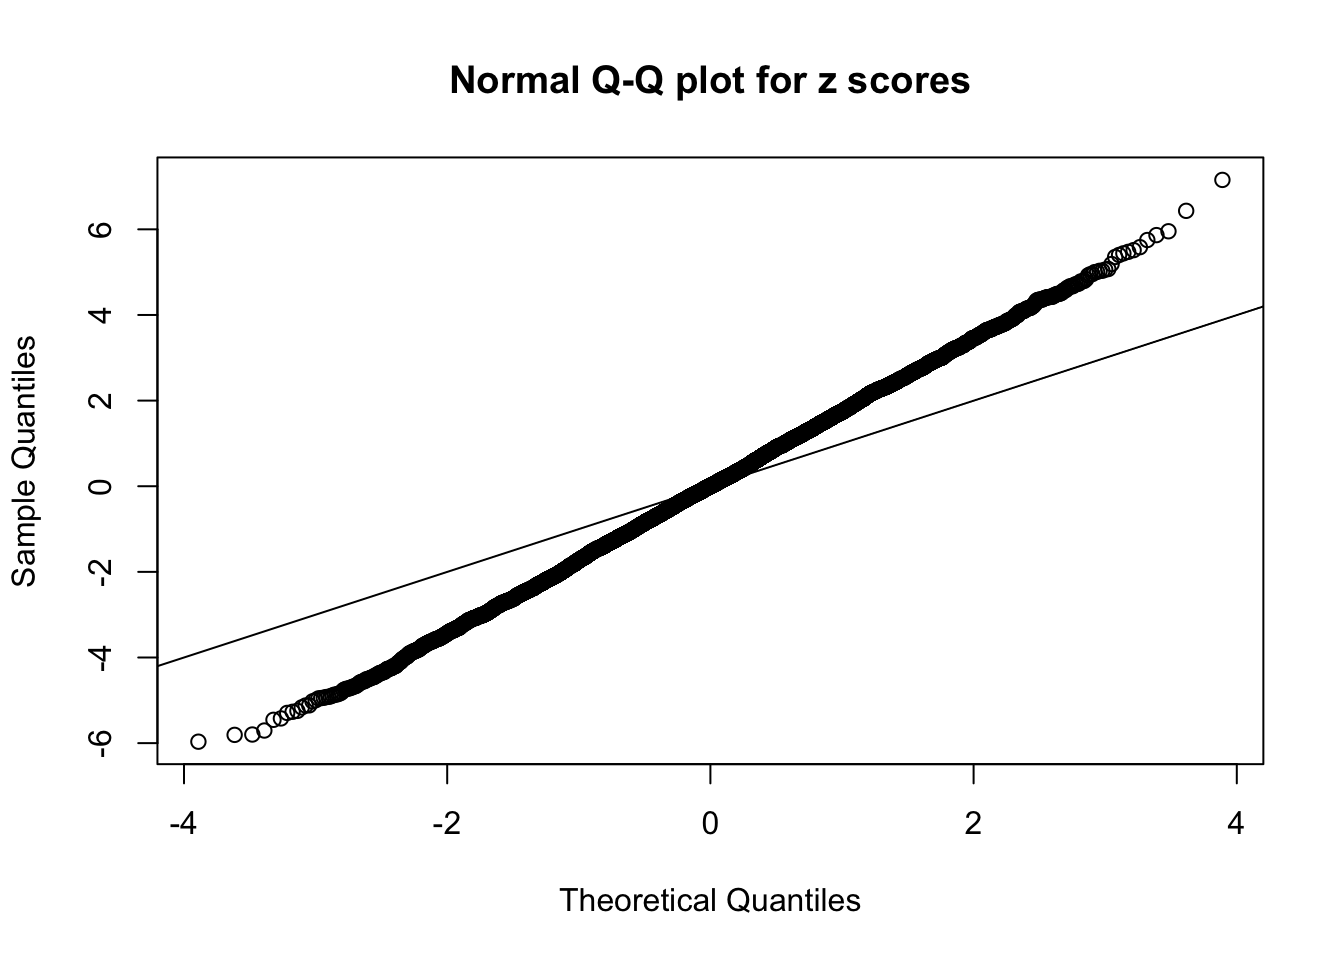


Zoom in to the left tail: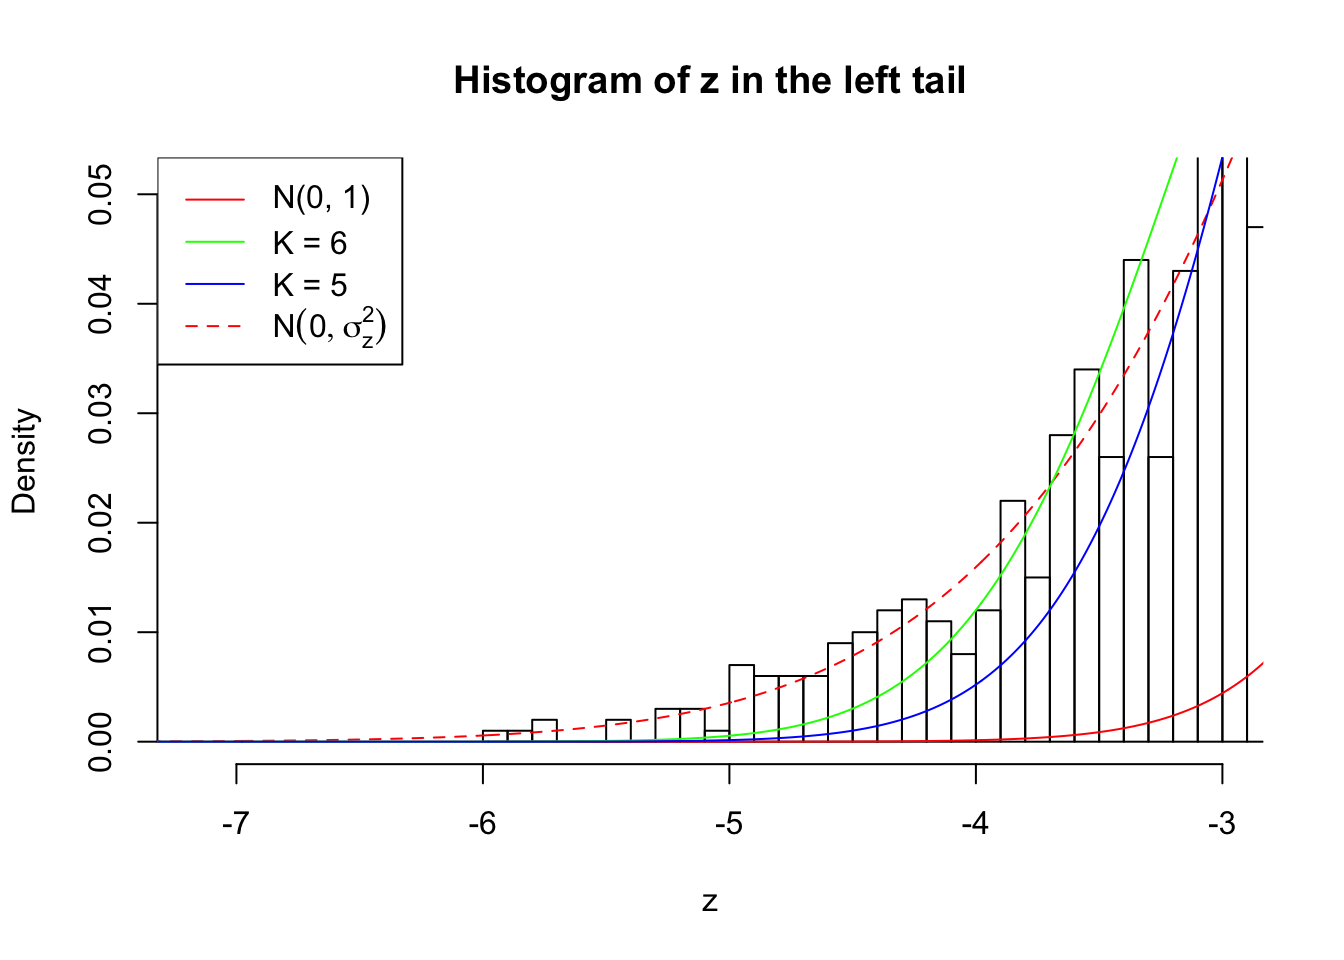
Zoom in to the right tail: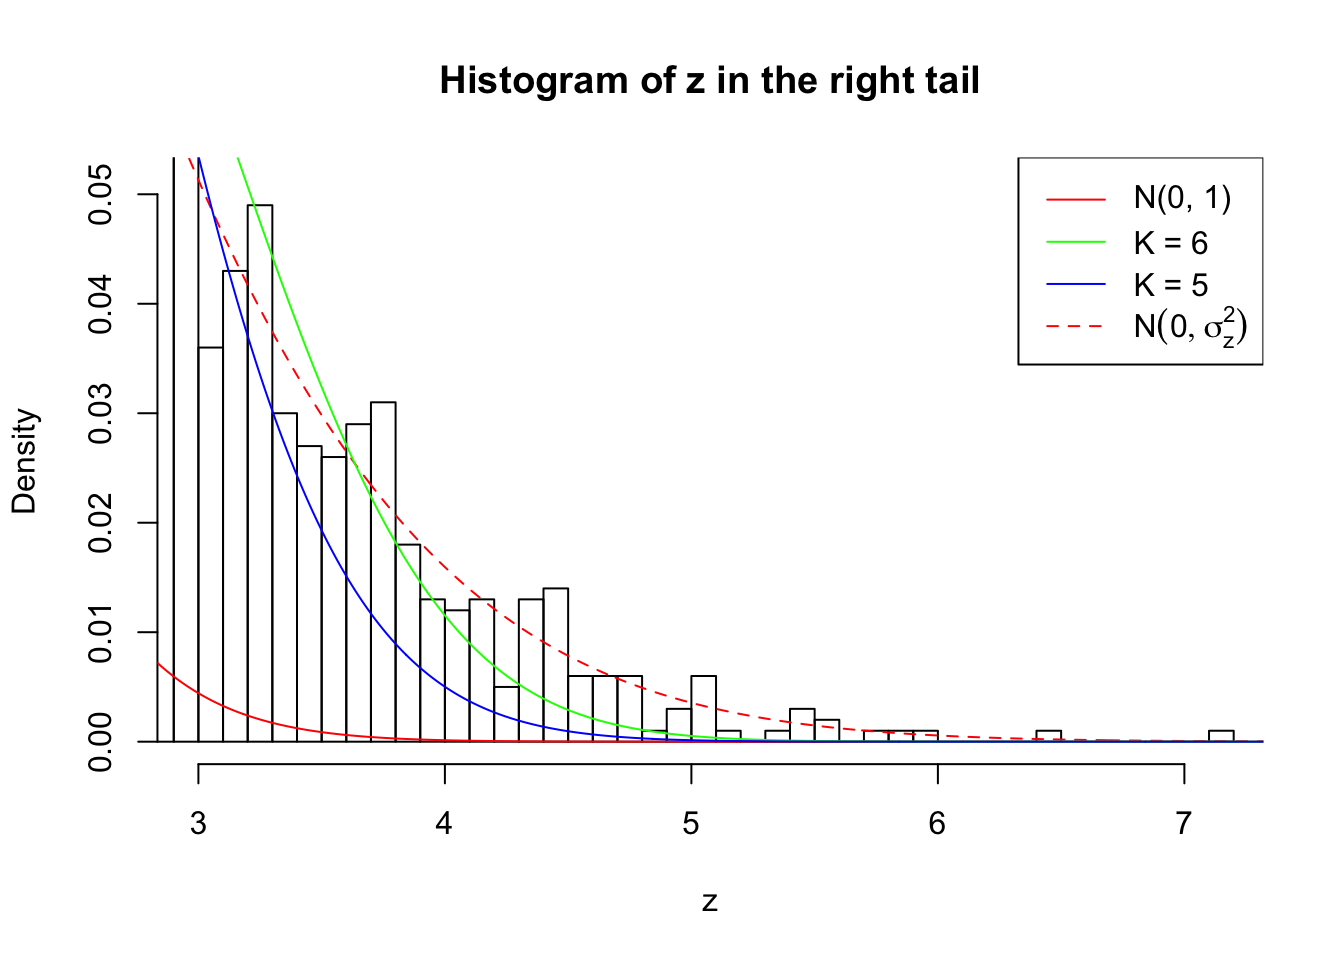
Example 3 :
SNR = 3 ;
True Distribution: N ( 0 , 2.995262 ) ;
Number of Discoveries: 1125 ;
pihat0 = 0.2183353 ;
Log-likelihood by True Distribution N ( 0, 2.995262 ) : -19799.13 ;
Log-likelihood by Gaussian Derivatives with K = 7 : -19974.25 ;
Log-likelihood Ratio between True Distribution N ( 0, 2.995262 ) and Fitted Gaussian Derivatives with K = 7 : 175.1193 ;
Normalized Weights of Gaussian Derivatives with K = 7 :
1 : -0.0369699199255488 ; 2 : 1.31265025712611 ; 3 : -0.107576867905454 ; 4 : 1.45773811185881 ; 5 : -0.121632069227899 ; 6 : 0.783548181004518 ; 7 : -0.0322240334306016 ;
Log-likelihood by Gaussian Derivatives with K = 6 : -20032.16 ;
Log-likelihood Ratio between True Distribution N ( 0, 2.995262 ) and Fitted Gaussian Derivatives with K = 6 : 233.0241 ;
Normalized Weights of Gaussian Derivatives with K = 6 :
1 : -0.0349918322709436 ; 2 : 1.30244269821314 ; 3 : -0.0928096088731791 ; 4 : 1.43703104429066 ; 5 : -0.0836064902501311 ; 6 : 0.768336876325314 ; 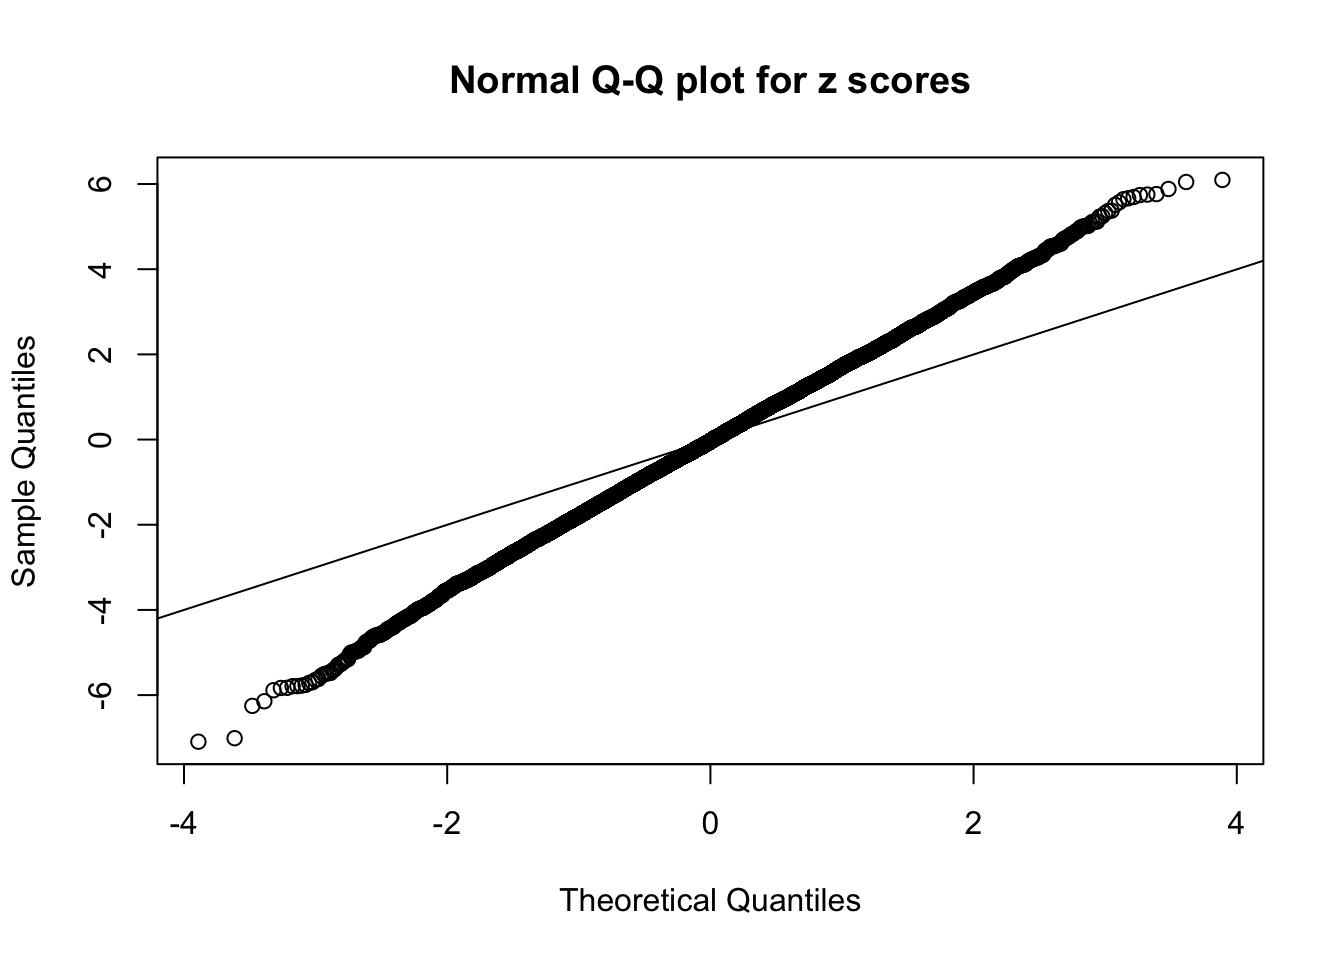


Zoom in to the left tail: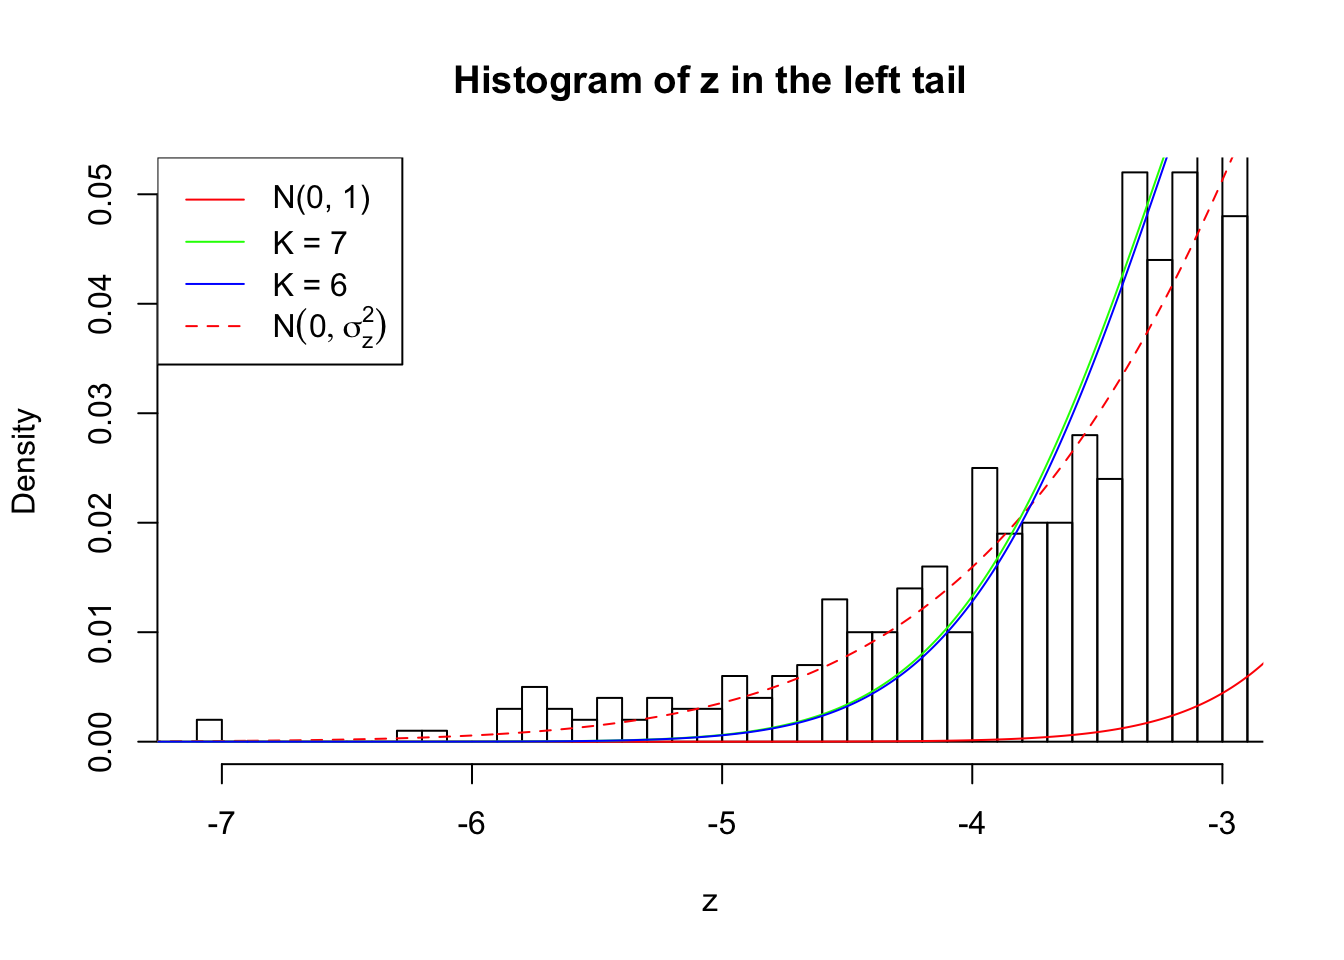
Zoom in to the right tail: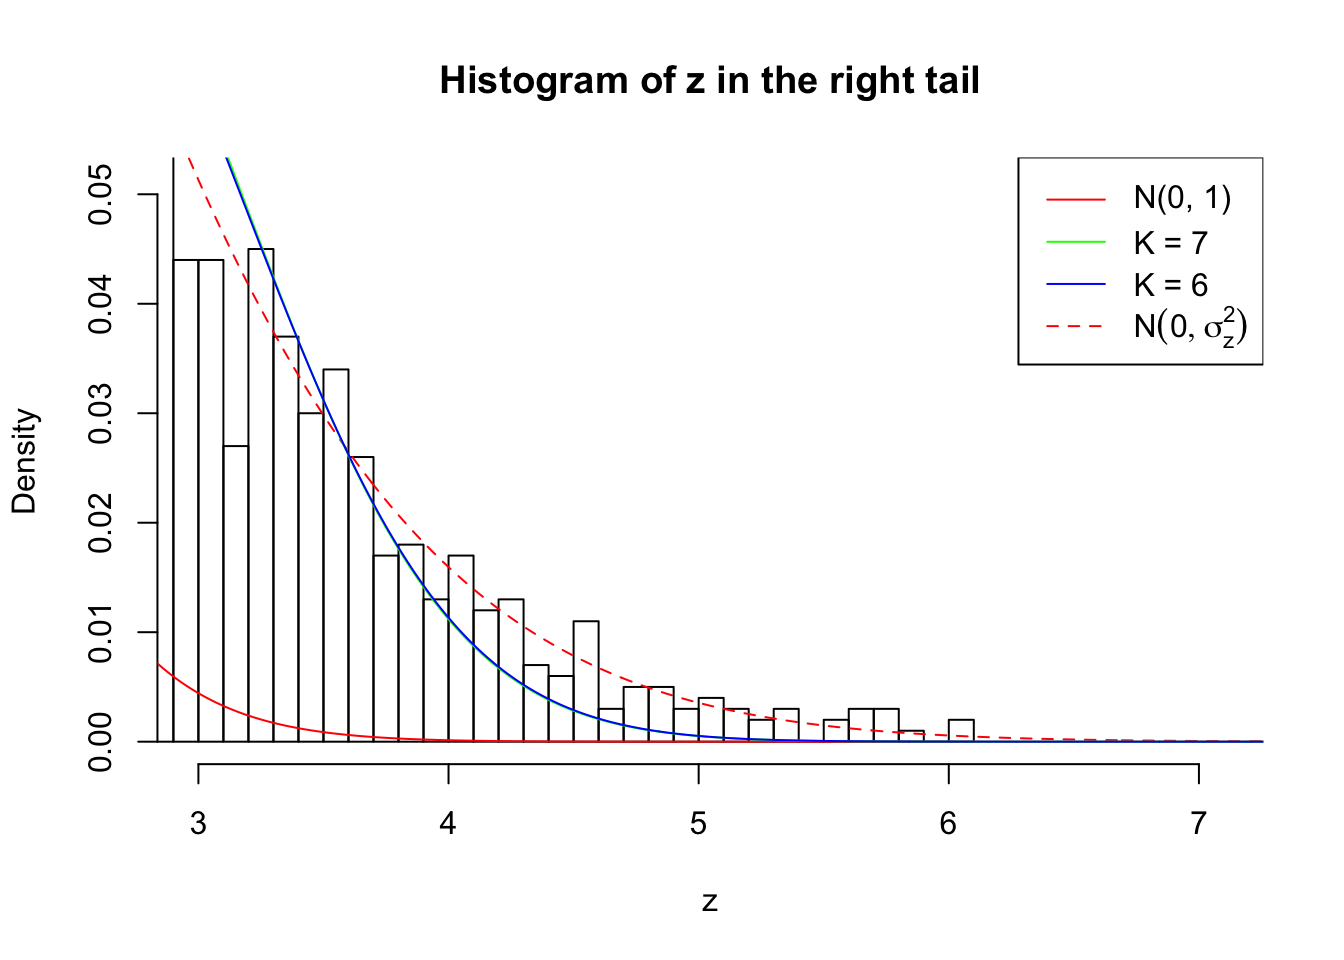
Example 4 :
SNR = 3 ;
True Distribution: N ( 0 , 2.995262 ) ;
Number of Discoveries: 1015 ;
pihat0 = 0.2005916 ;
Log-likelihood by True Distribution N ( 0, 2.995262 ) : -19563.37 ;
Log-likelihood by Gaussian Derivatives with K = 6 : -19717.58 ;
Log-likelihood Ratio between True Distribution N ( 0, 2.995262 ) and Fitted Gaussian Derivatives with K = 6 : 154.205 ;
Normalized Weights of Gaussian Derivatives with K = 6 :
1 : 0.0142014676711954 ; 2 : 1.23085121924937 ; 3 : 0.0193924773128272 ; 4 : 1.33650382371204 ; 5 : 0.00773080730718023 ; 6 : 0.714669370482247 ;
Log-likelihood by Gaussian Derivatives with K = 5 : -20026.82 ;
Log-likelihood Ratio between True Distribution N ( 0, 2.995262 ) and Fitted Gaussian Derivatives with K = 5 : 463.4474 ;
Normalized Weights of Gaussian Derivatives with K = 5 :
1 : 0.0138072992790593 ; 2 : 1.08230318475708 ; 3 : 0.0112953947087835 ; 4 : 0.70028252055515 ; 5 : -0.00401828618141428 ; 


Zoom in to the left tail: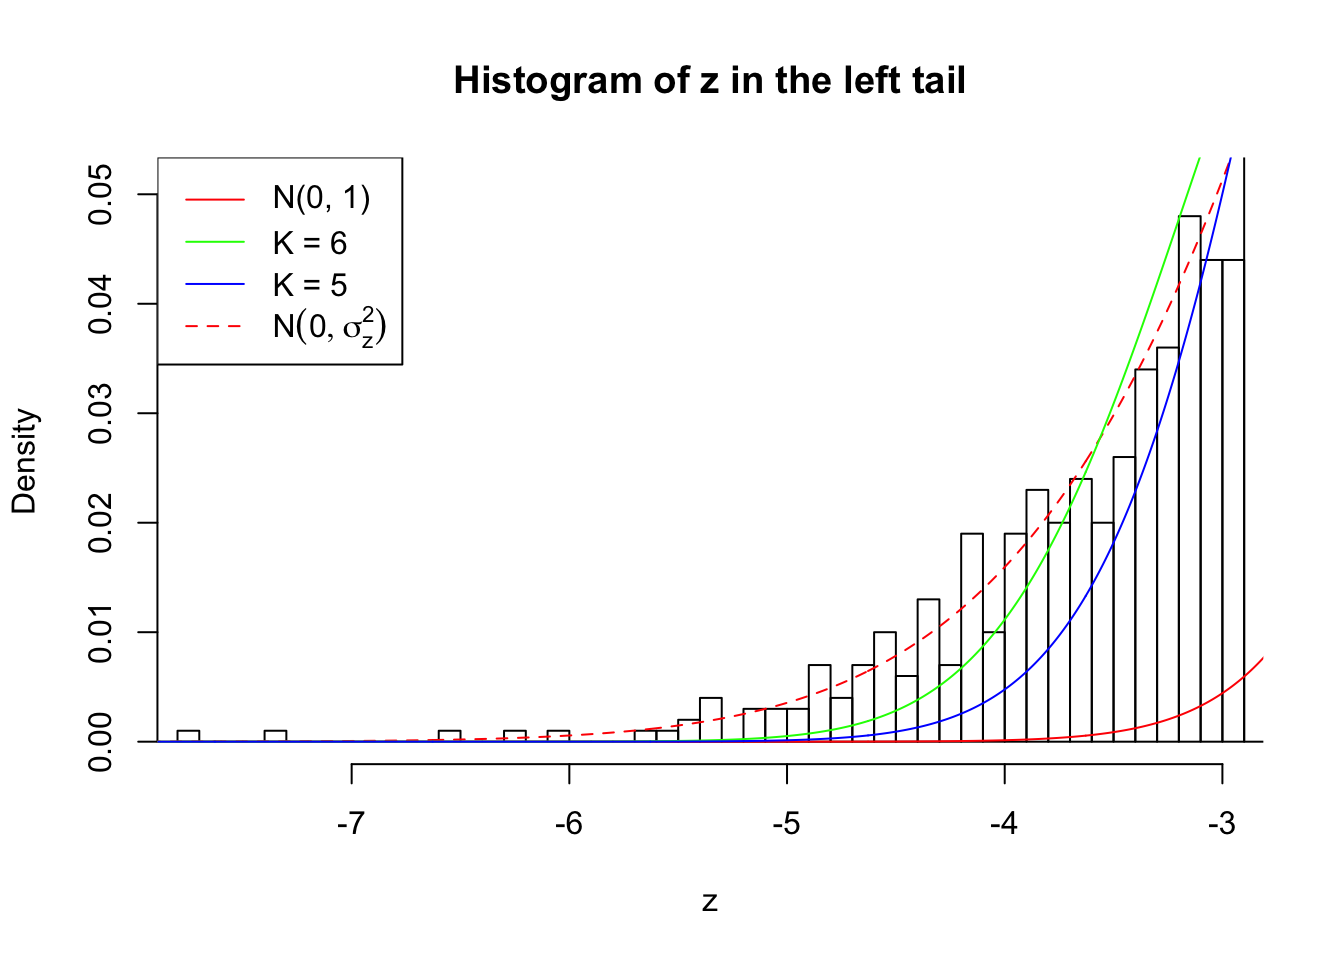
Zoom in to the right tail: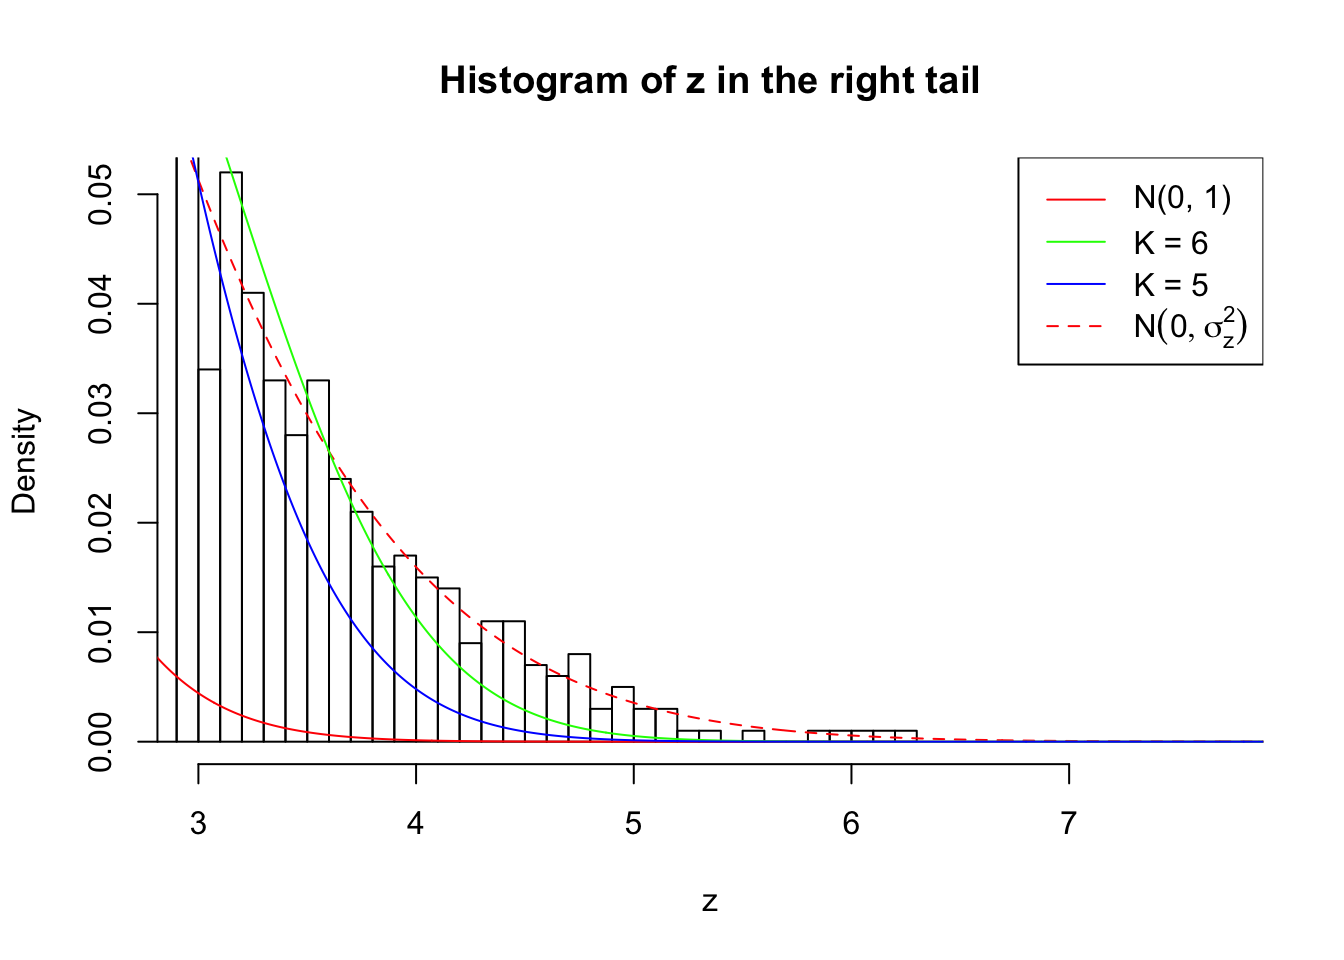
Example 5 :
SNR = 3 ;
True Distribution: N ( 0 , 2.995262 ) ;
Number of Discoveries: 1116 ;
pihat0 = 0.2059135 ;
Log-likelihood by True Distribution N ( 0, 2.995262 ) : -19694.25 ;
Log-likelihood by Gaussian Derivatives with K = 6 : -19875.35 ;
Log-likelihood Ratio between True Distribution N ( 0, 2.995262 ) and Fitted Gaussian Derivatives with K = 6 : 181.0977 ;
Normalized Weights of Gaussian Derivatives with K = 6 :
1 : -0.0140242957481269 ; 2 : 1.27383551876828 ; 3 : -0.0464574751003468 ; 4 : 1.39777208974153 ; 5 : -0.0310039225932993 ; 6 : 0.75869513057903 ;
Log-likelihood by Gaussian Derivatives with K = 5 : -20195.4 ;
Log-likelihood Ratio between True Distribution N ( 0, 2.995262 ) and Fitted Gaussian Derivatives with K = 5 : 501.1484 ;
Normalized Weights of Gaussian Derivatives with K = 5 :
1 : -0.0132809857324255 ; 2 : 1.11756833715367 ; 3 : -0.0383825968226916 ; 4 : 0.718184548621535 ; 5 : -0.0246121563432862 ; 
Zoom in to the left tail: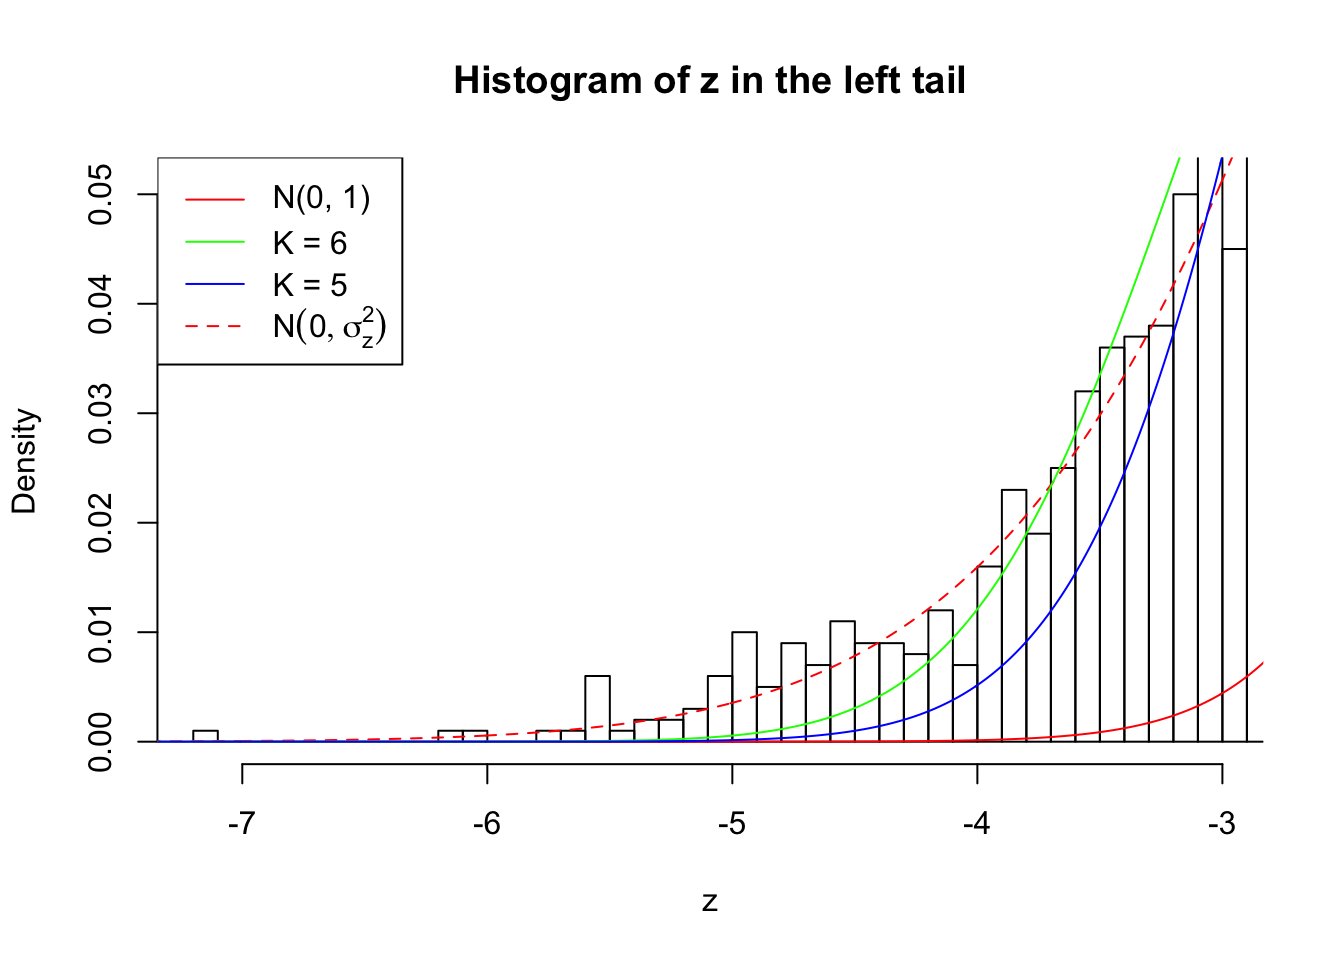
Zoom in to the right tail: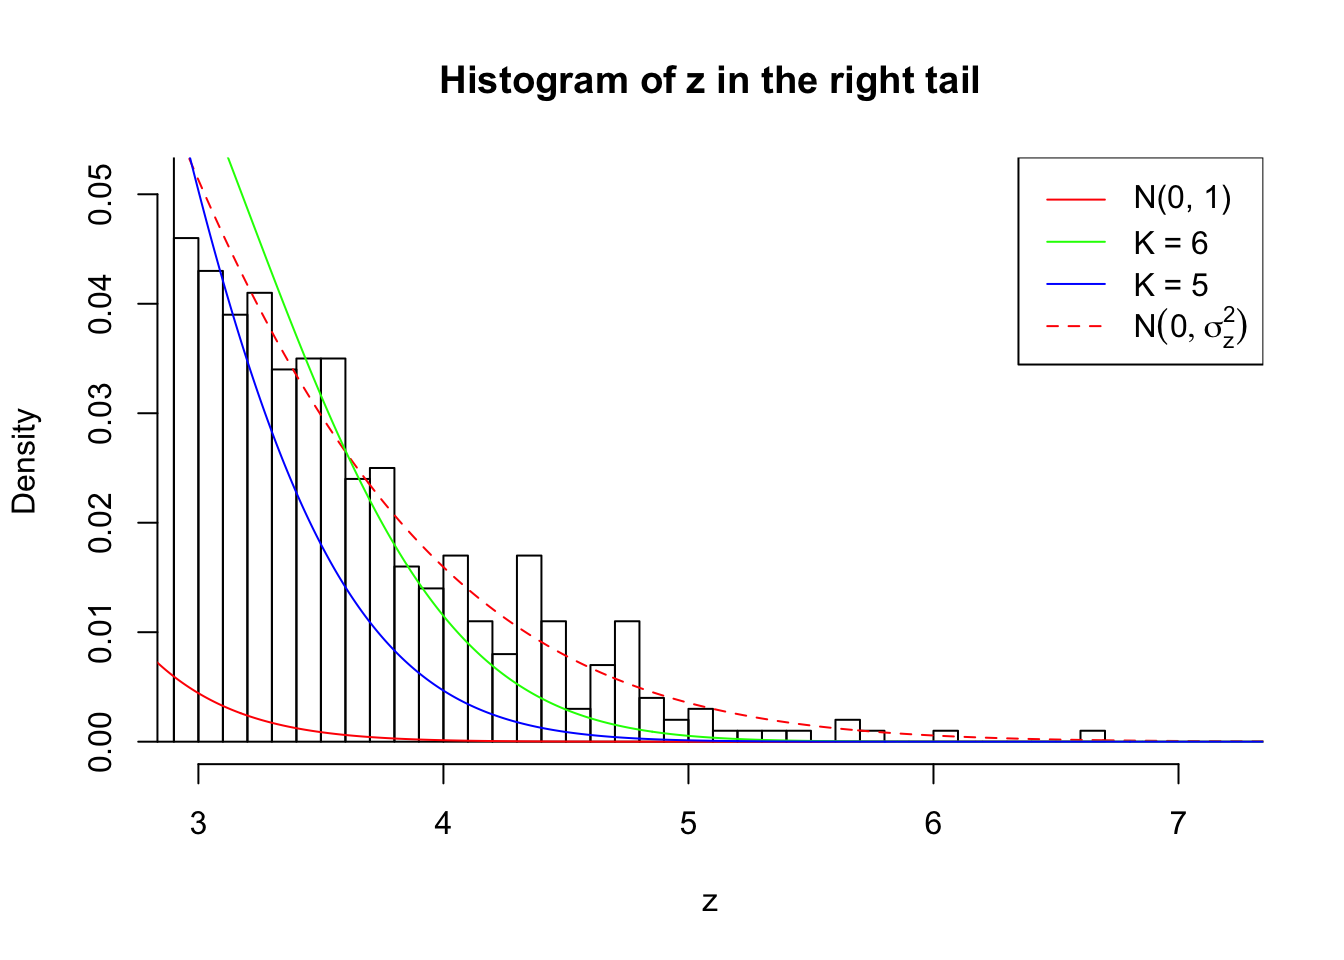
## SNR = 4 ; sigma_z = 1.874003 ; True Distribution: N ( 0 , 3.511886 ) .
Example 1 :
SNR = 4 ;
True Distribution: N ( 0 , 3.511886 ) ;
Number of Discoveries: 1612 ;
pihat0 = 0.2349198 ;
Log-likelihood by True Distribution N ( 0, 3.511886 ) : -20505.62 ;
Log-likelihood by Gaussian Derivatives with K = 7 : -20838.3 ;
Log-likelihood Ratio between True Distribution N ( 0, 3.511886 ) and Fitted Gaussian Derivatives with K = 7 : 332.6796 ;
Normalized Weights of Gaussian Derivatives with K = 7 :
1 : 0.00263960278498244 ; 2 : 1.53936288484481 ; 3 : -0.000253103340590059 ; 4 : 1.90098025064903 ; 5 : 0.0266329163091332 ; 6 : 1.02003551948117 ; 7 : 0.024303389682097 ;
Log-likelihood by Gaussian Derivatives with K = 6 : -20900.37 ;
Log-likelihood Ratio between True Distribution N ( 0, 3.511886 ) and Fitted Gaussian Derivatives with K = 6 : 394.7513 ;
Normalized Weights of Gaussian Derivatives with K = 6 :
1 : 0.00155462847886588 ; 2 : 1.53004347413158 ; 3 : -0.0109051295788474 ; 4 : 1.8821764856015 ; 5 : -0.00189158567619316 ; 6 : 1.00635770850968 ; 


Zoom in to the left tail: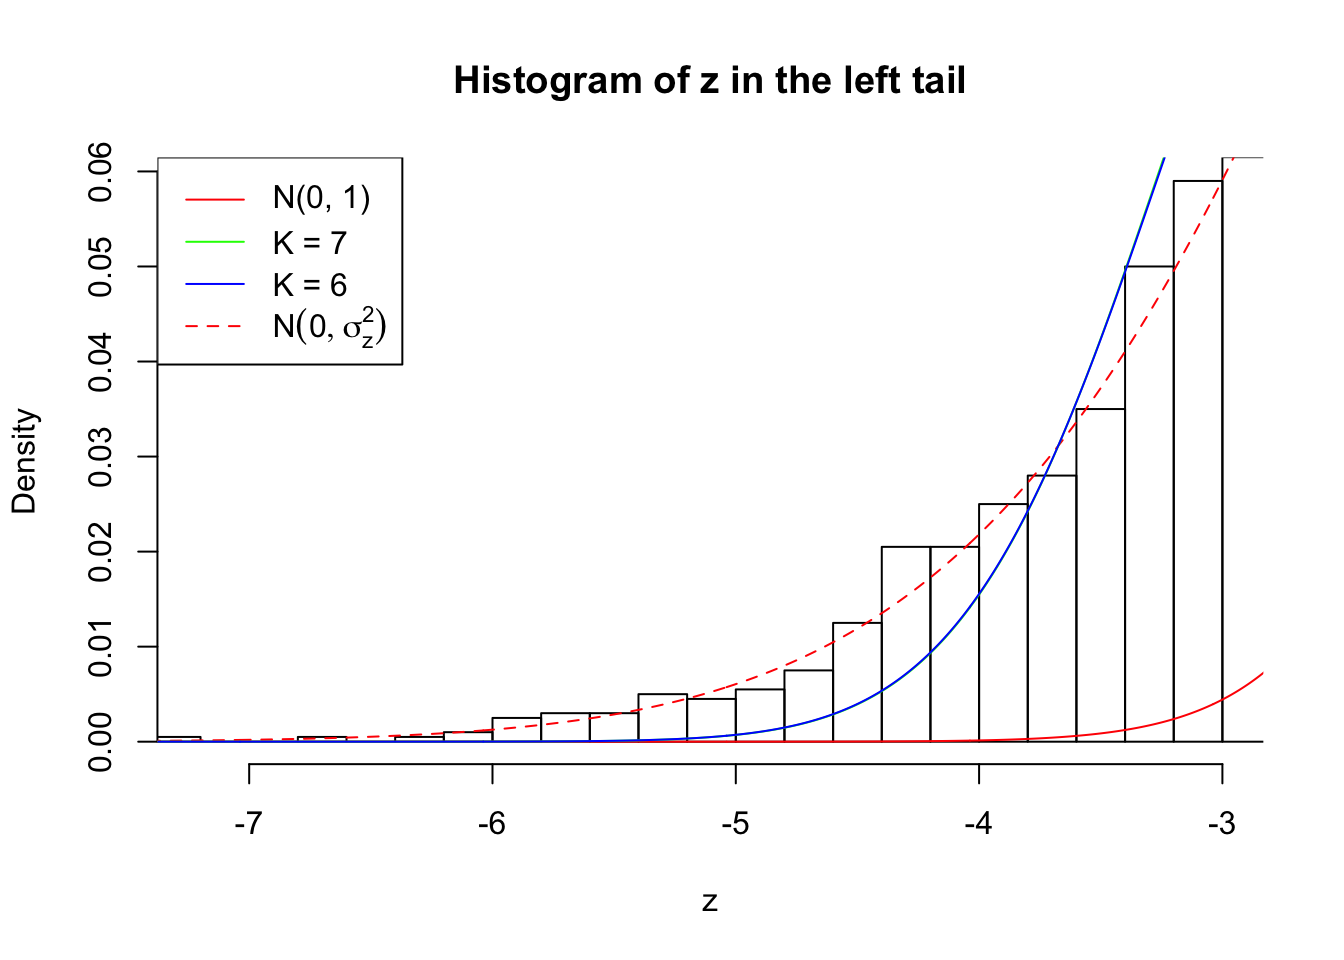
Zoom in to the right tail: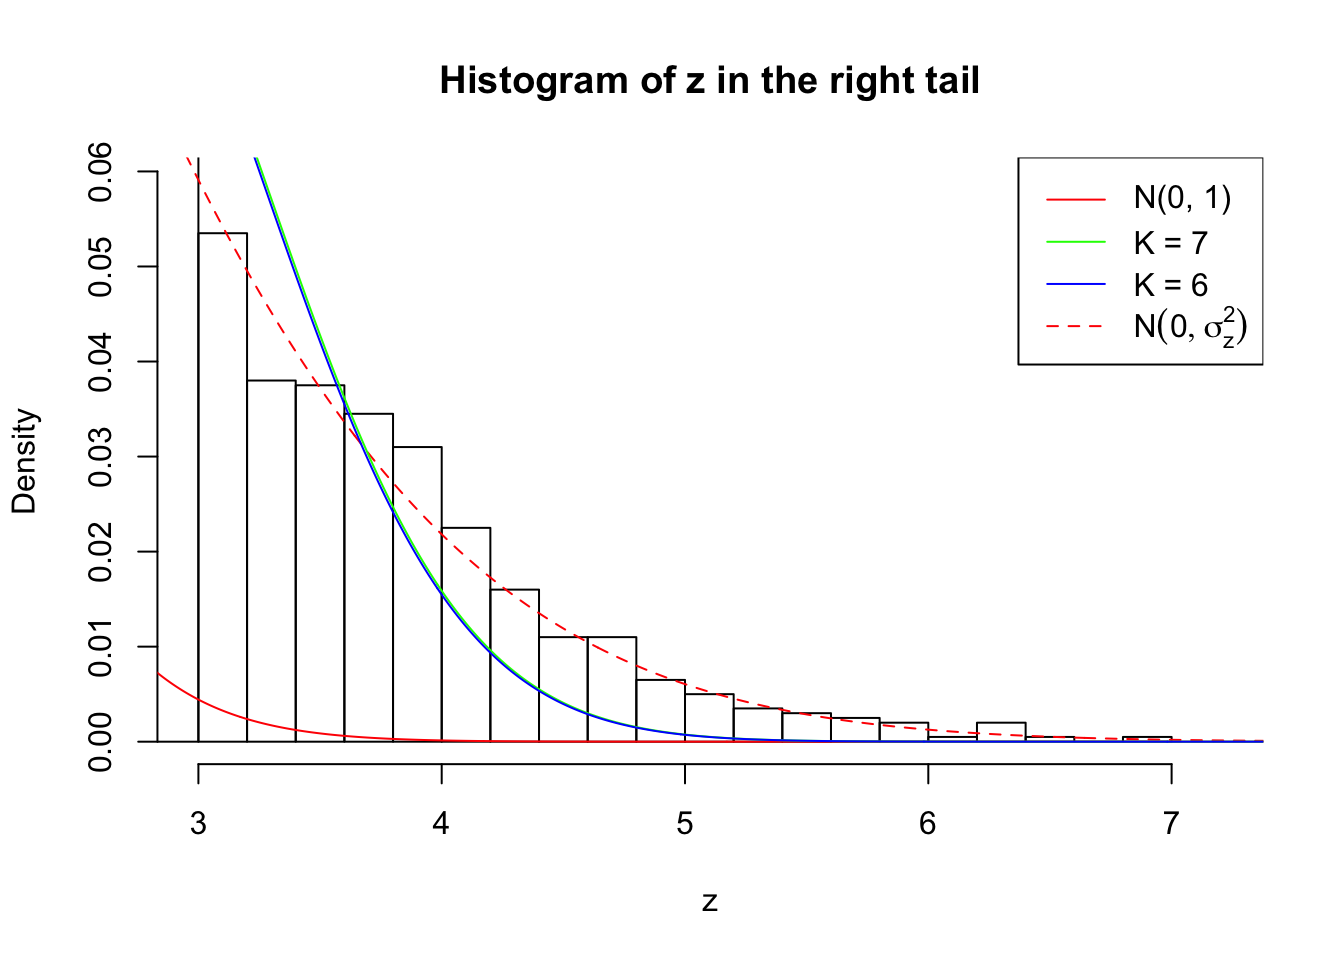
Example 2 :
SNR = 4 ;
True Distribution: N ( 0 , 3.511886 ) ;
Number of Discoveries: 1579 ;
pihat0 = 0.1702099 ;
Log-likelihood by True Distribution N ( 0, 3.511886 ) : -20538.23 ;
Log-likelihood by Gaussian Derivatives with K = 6 : -20874.76 ;
Log-likelihood Ratio between True Distribution N ( 0, 3.511886 ) and Fitted Gaussian Derivatives with K = 6 : 336.5326 ;
Normalized Weights of Gaussian Derivatives with K = 6 :
1 : 0.00714737291666616 ; 2 : 1.54777588924115 ; 3 : 0.0907515403200786 ; 4 : 1.86599937944303 ; 5 : 0.0724552423429854 ; 6 : 1.01923589785132 ;
Log-likelihood by Gaussian Derivatives with K = 5 : -21468.18 ;
Log-likelihood Ratio between True Distribution N ( 0, 3.511886 ) and Fitted Gaussian Derivatives with K = 5 : 929.9497 ;
Normalized Weights of Gaussian Derivatives with K = 5 :
1 : -0.00233712727950881 ; 2 : 1.30898534778199 ; 3 : 0.0614434451312987 ; 4 : 0.910461862499954 ; 5 : 0.05447641272924 ; 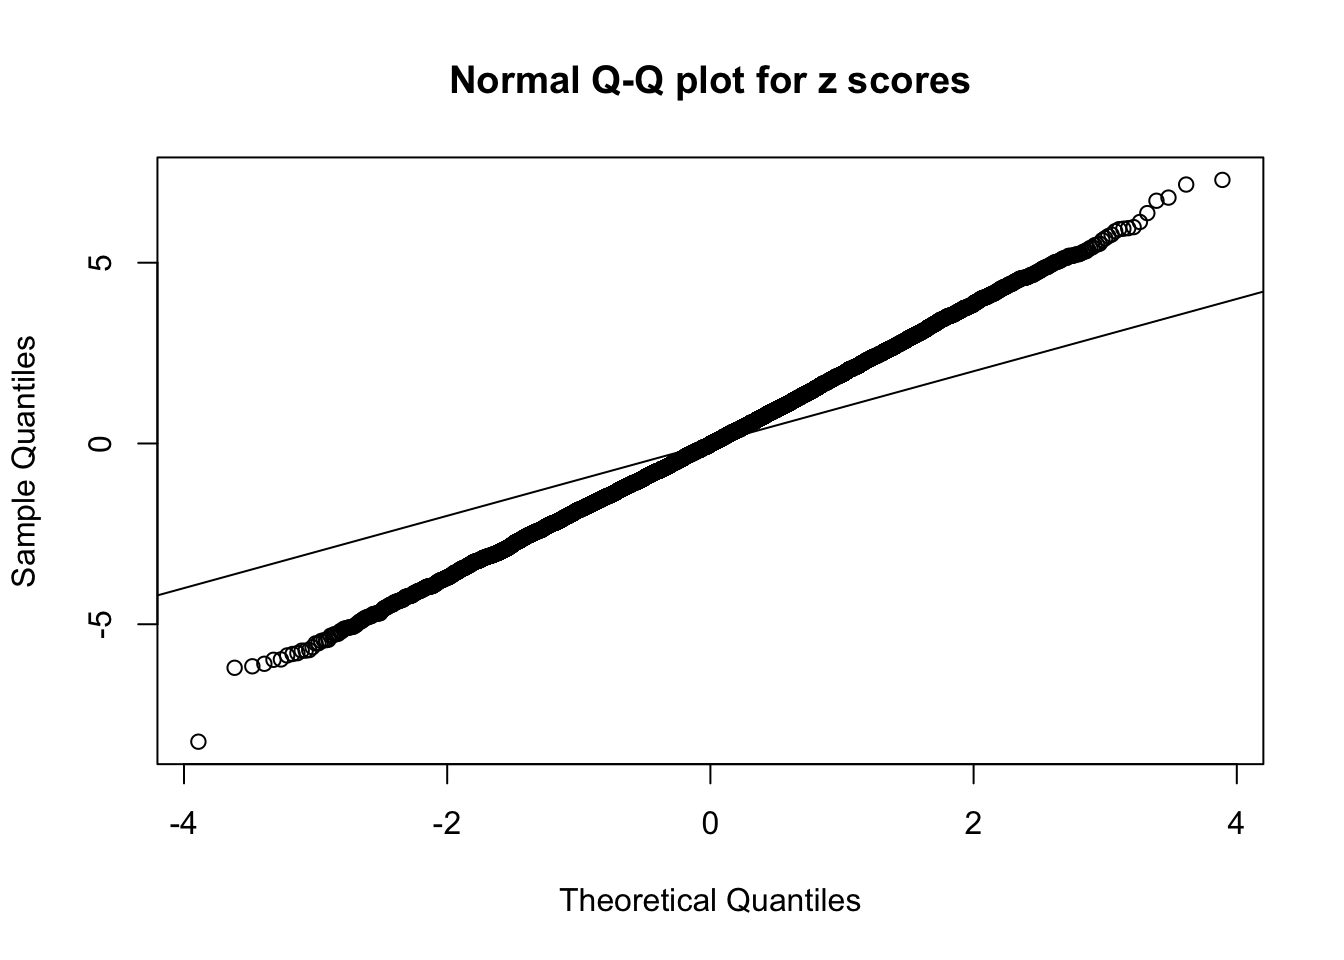

Zoom in to the left tail: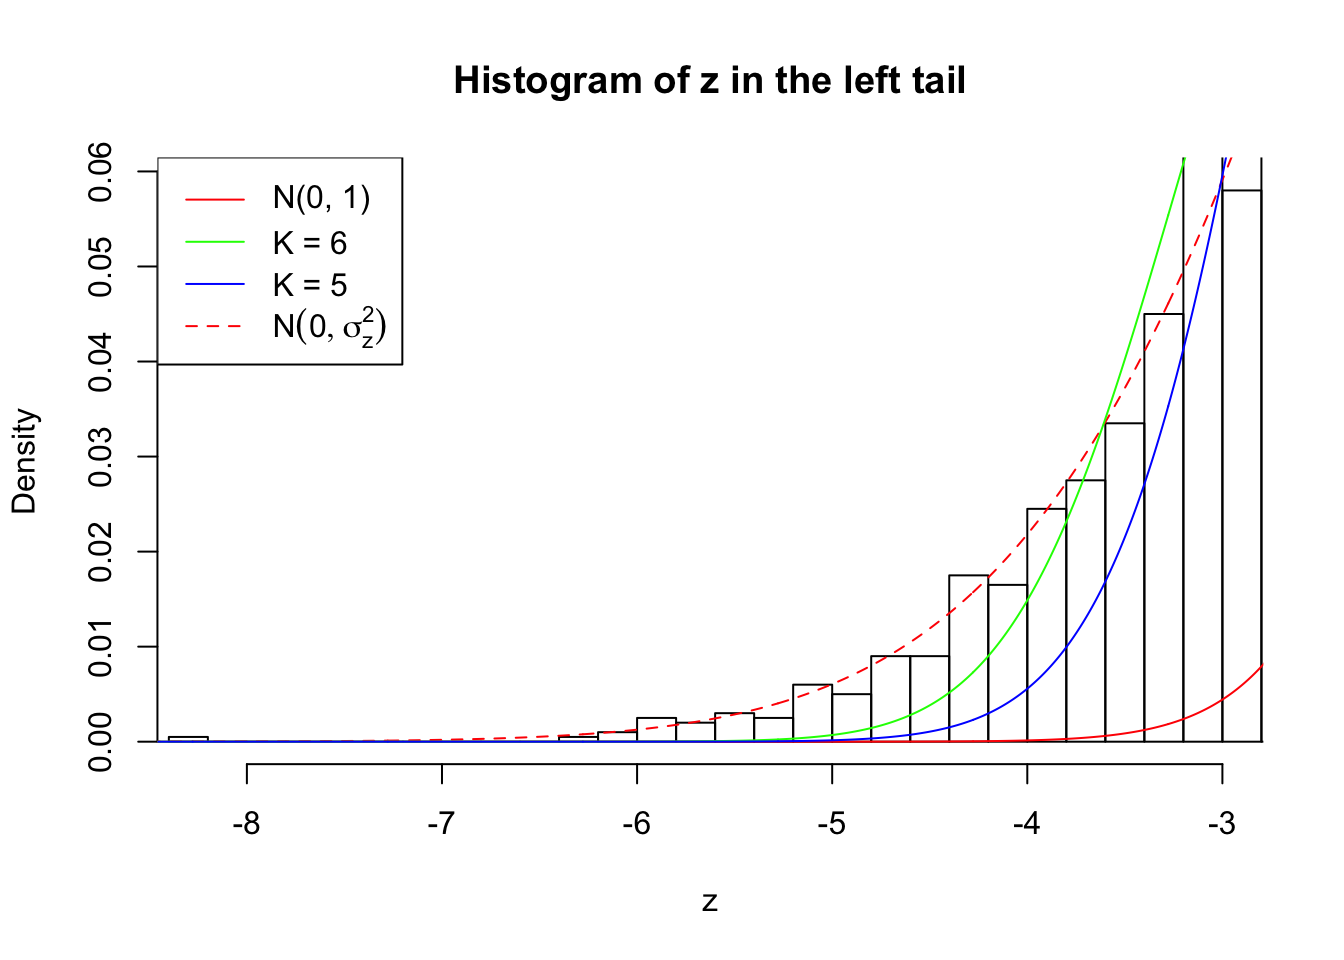
Zoom in to the right tail: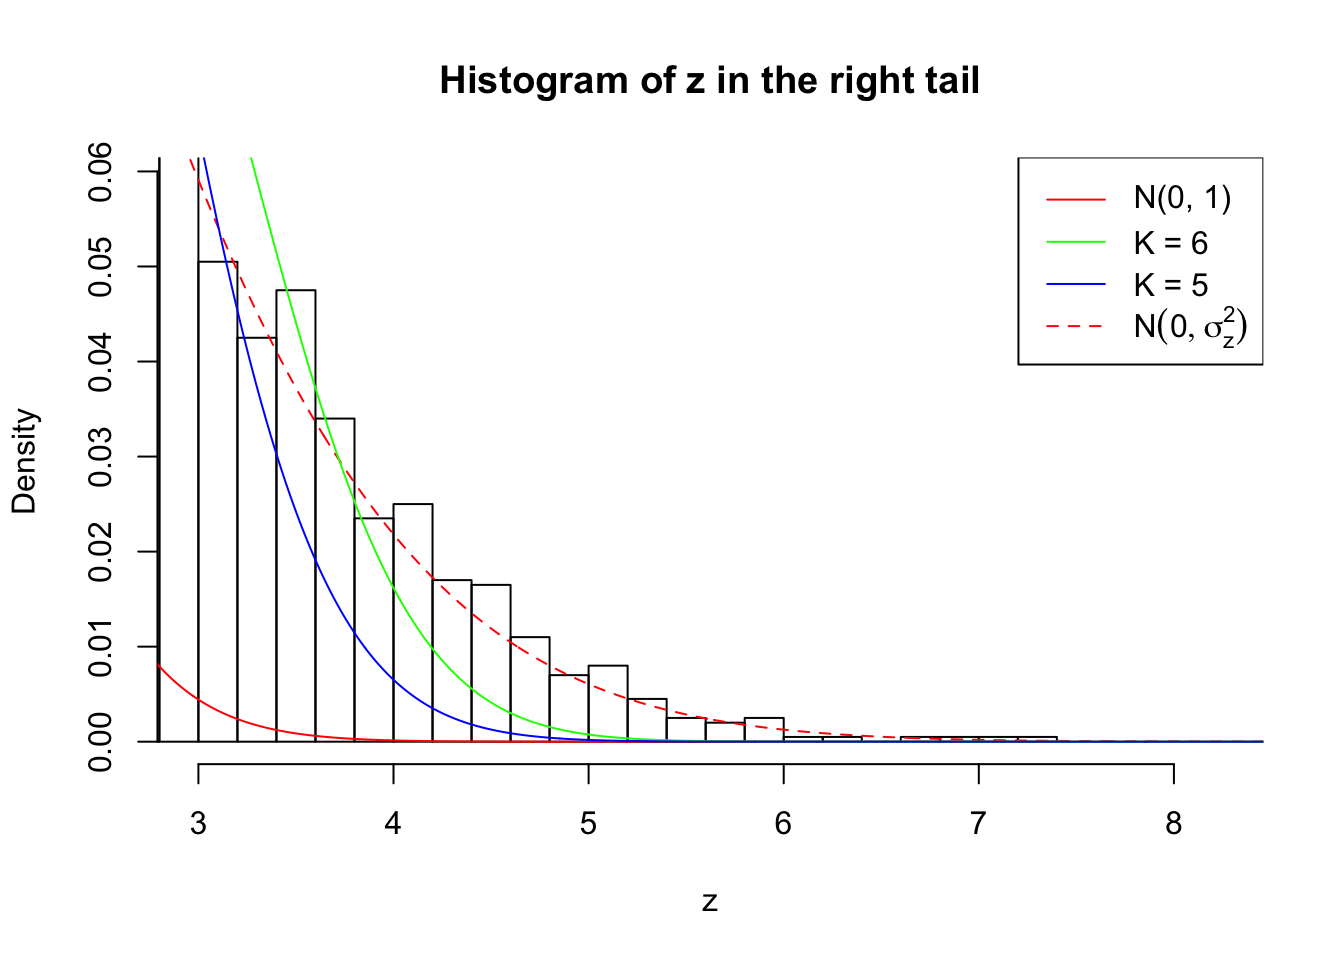
Example 3 :
SNR = 4 ;
True Distribution: N ( 0 , 3.511886 ) ;
Number of Discoveries: 1537 ;
pihat0 = 0.207689 ;
Log-likelihood by True Distribution N ( 0, 3.511886 ) : -20375.11 ;
Log-likelihood by Gaussian Derivatives with K = 6 : -20696.27 ;
Log-likelihood Ratio between True Distribution N ( 0, 3.511886 ) and Fitted Gaussian Derivatives with K = 6 : 321.1552 ;
Normalized Weights of Gaussian Derivatives with K = 6 :
1 : 0.0129177627131297 ; 2 : 1.51027853149931 ; 3 : -0.0621604270315439 ; 4 : 1.7839515165522 ; 5 : -0.0463150827204791 ; 6 : 0.950489396221004 ;
Log-likelihood by Gaussian Derivatives with K = 5 : -21160.44 ;
Log-likelihood Ratio between True Distribution N ( 0, 3.511886 ) and Fitted Gaussian Derivatives with K = 5 : 785.3305 ;
Normalized Weights of Gaussian Derivatives with K = 5 :
1 : 0.0167322527670701 ; 2 : 1.28474315587364 ; 3 : -0.0507776149038532 ; 4 : 0.886307772175458 ; 5 : -0.0475668505725079 ; 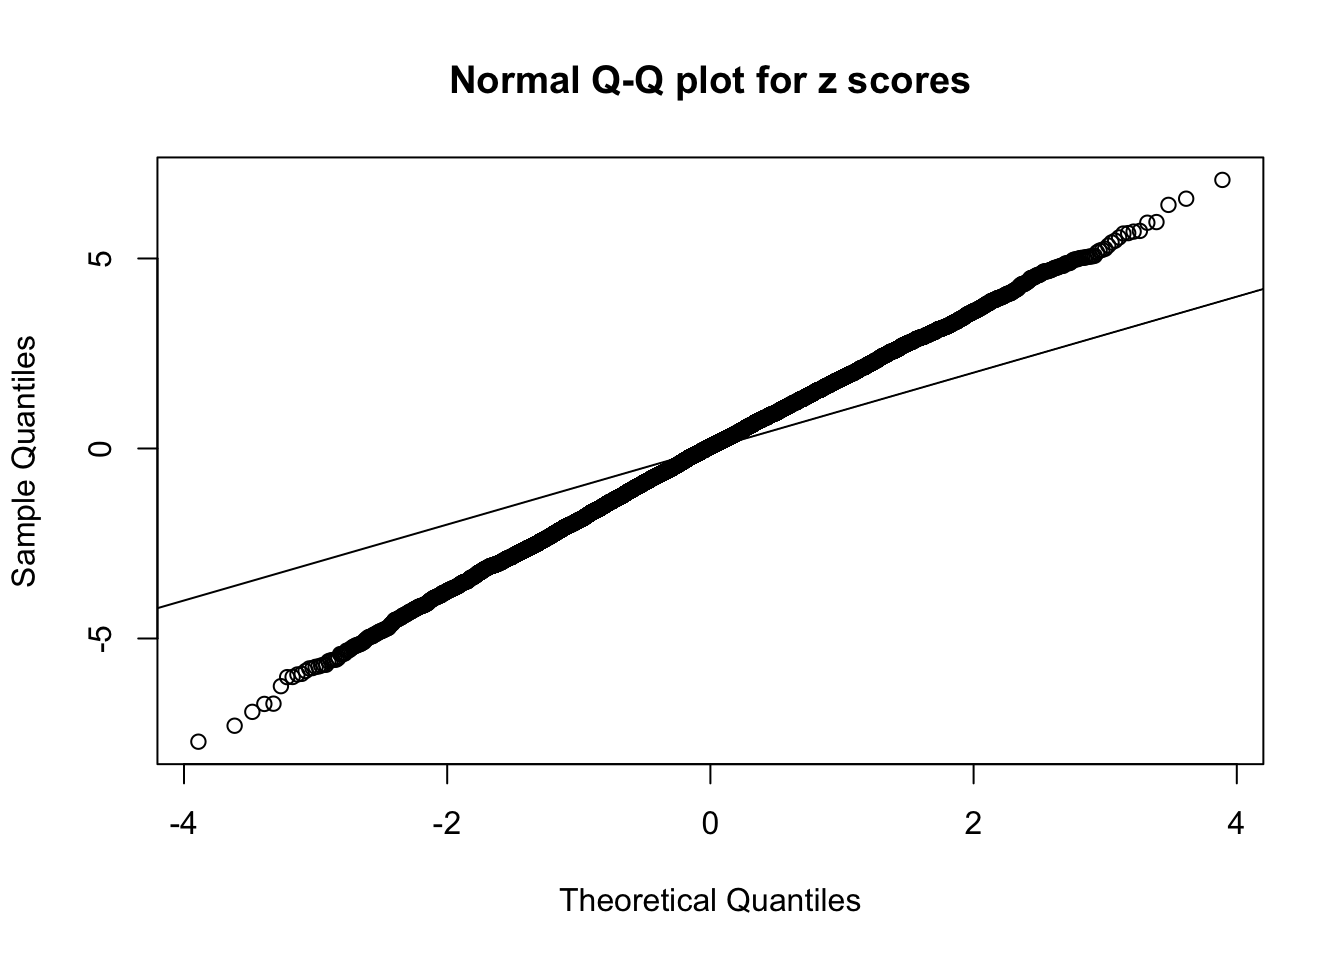
Zoom in to the left tail: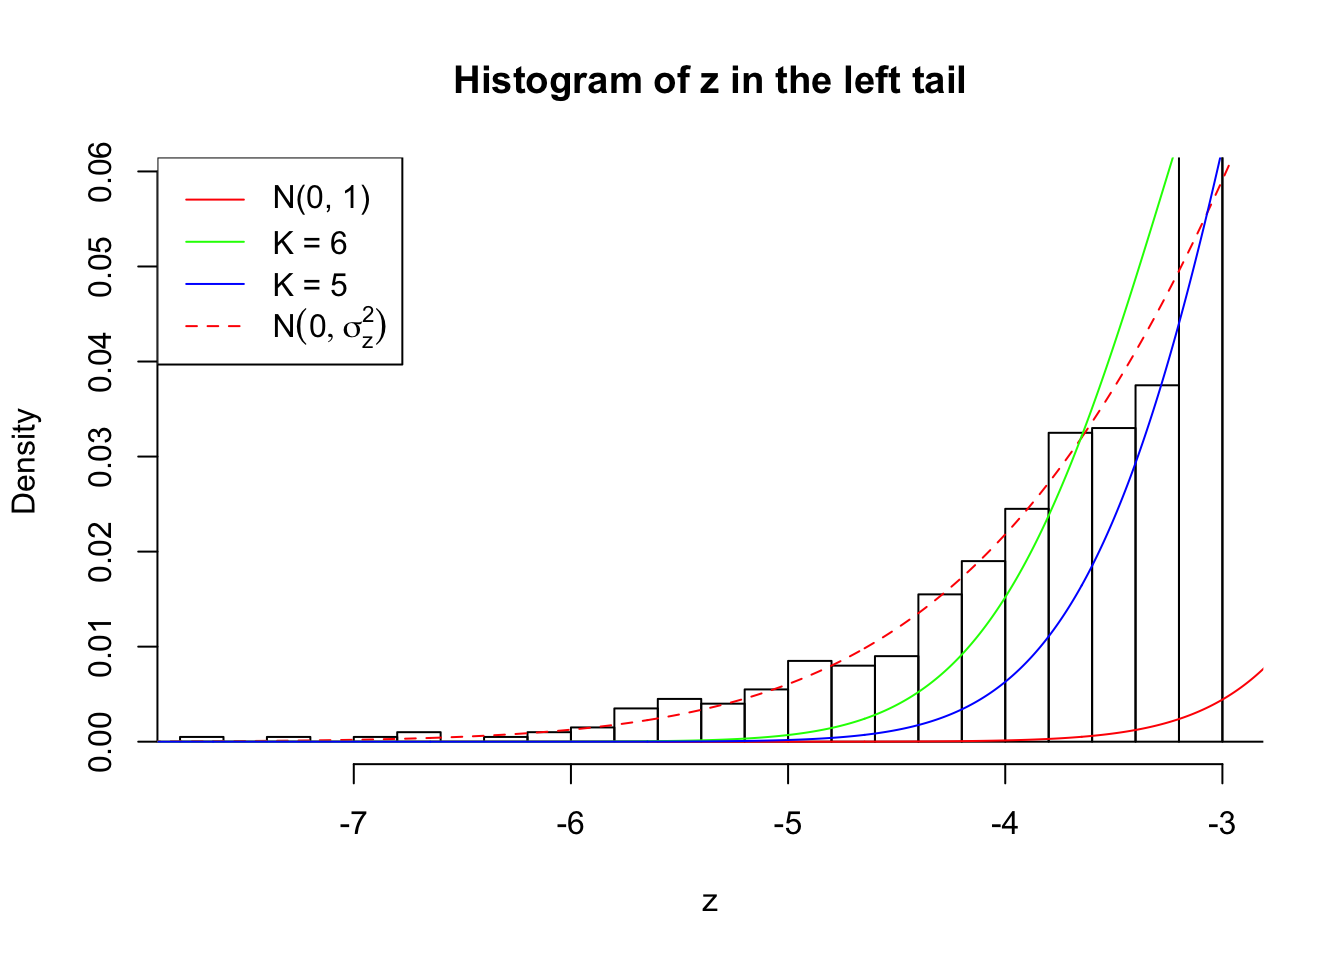
Zoom in to the right tail: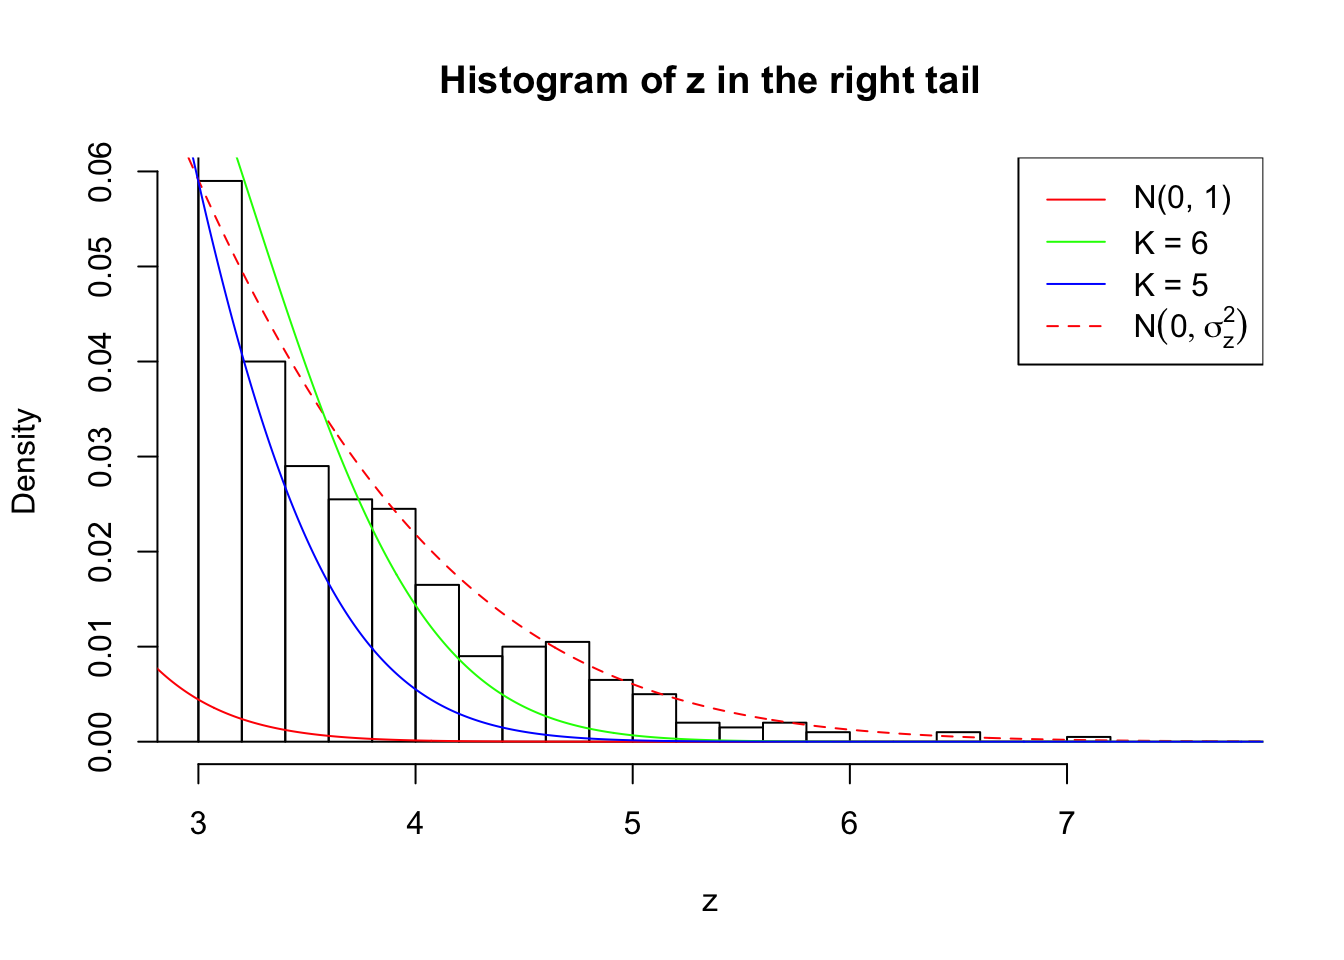
Example 4 :
SNR = 4 ;
True Distribution: N ( 0 , 3.511886 ) ;
Number of Discoveries: 1661 ;
pihat0 = 0.2081909 ;
Log-likelihood by True Distribution N ( 0, 3.511886 ) : -20619.85 ;
Log-likelihood by Gaussian Derivatives with K = 6 : -21024.68 ;
Log-likelihood Ratio between True Distribution N ( 0, 3.511886 ) and Fitted Gaussian Derivatives with K = 6 : 404.824 ;
Normalized Weights of Gaussian Derivatives with K = 6 :
1 : 0.015109039889223 ; 2 : 1.58437283625333 ; 3 : 0.0261382021780695 ; 4 : 1.91545171554349 ; 5 : -0.00140914849247964 ; 6 : 1.00554828868042 ;
Log-likelihood by Gaussian Derivatives with K = 5 : -21549.2 ;
Log-likelihood Ratio between True Distribution N ( 0, 3.511886 ) and Fitted Gaussian Derivatives with K = 5 : 929.3471 ;
Normalized Weights of Gaussian Derivatives with K = 5 :
1 : 0.0216915779717695 ; 2 : 1.3390792645327 ; 3 : 0.0283549196023475 ; 4 : 0.961246767734933 ; 5 : -0.00869438265477574 ; 
Zoom in to the left tail: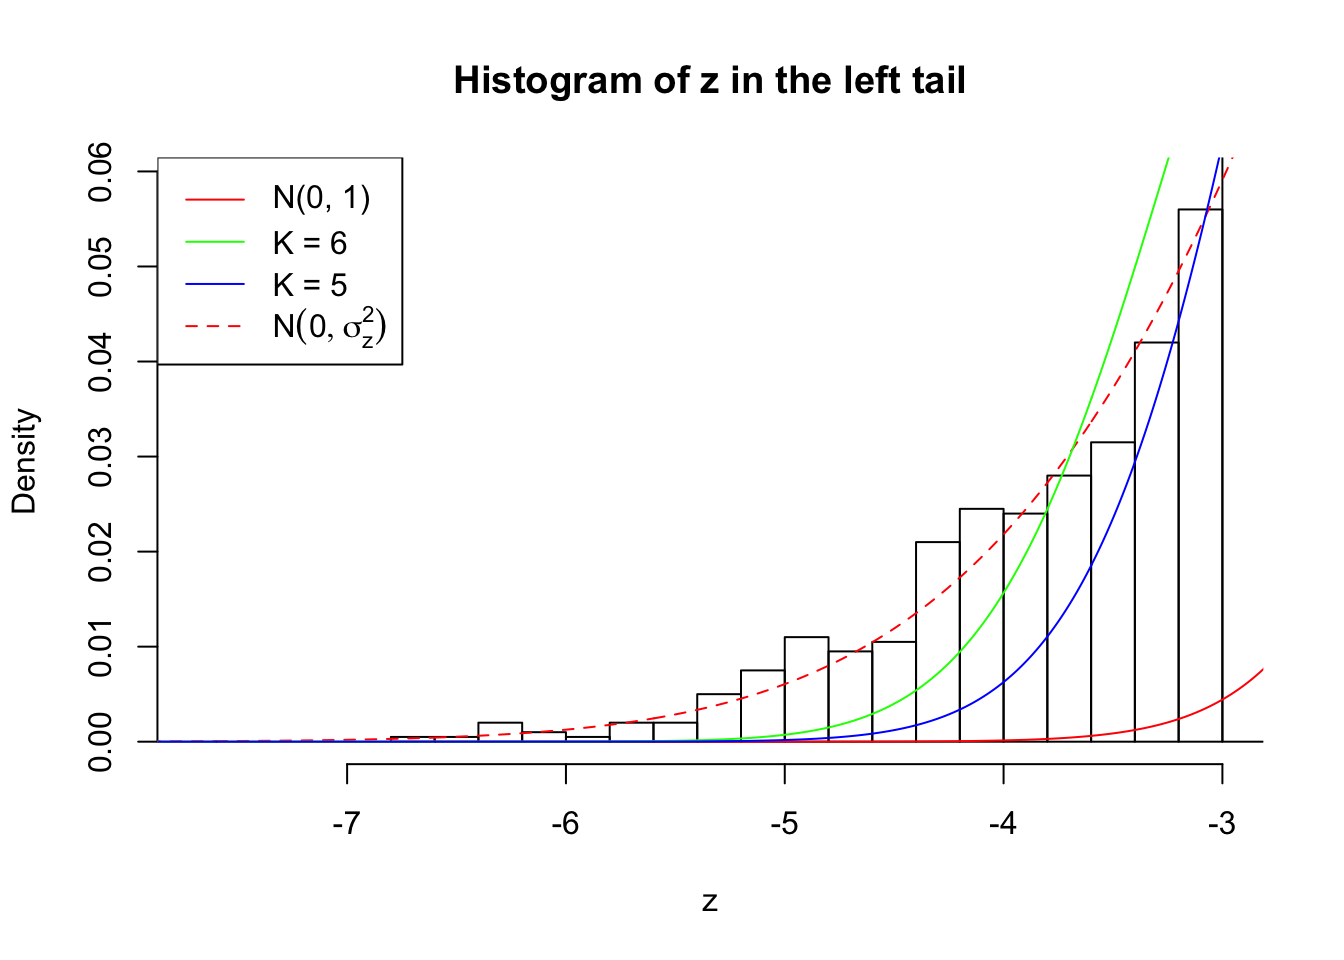
Zoom in to the right tail: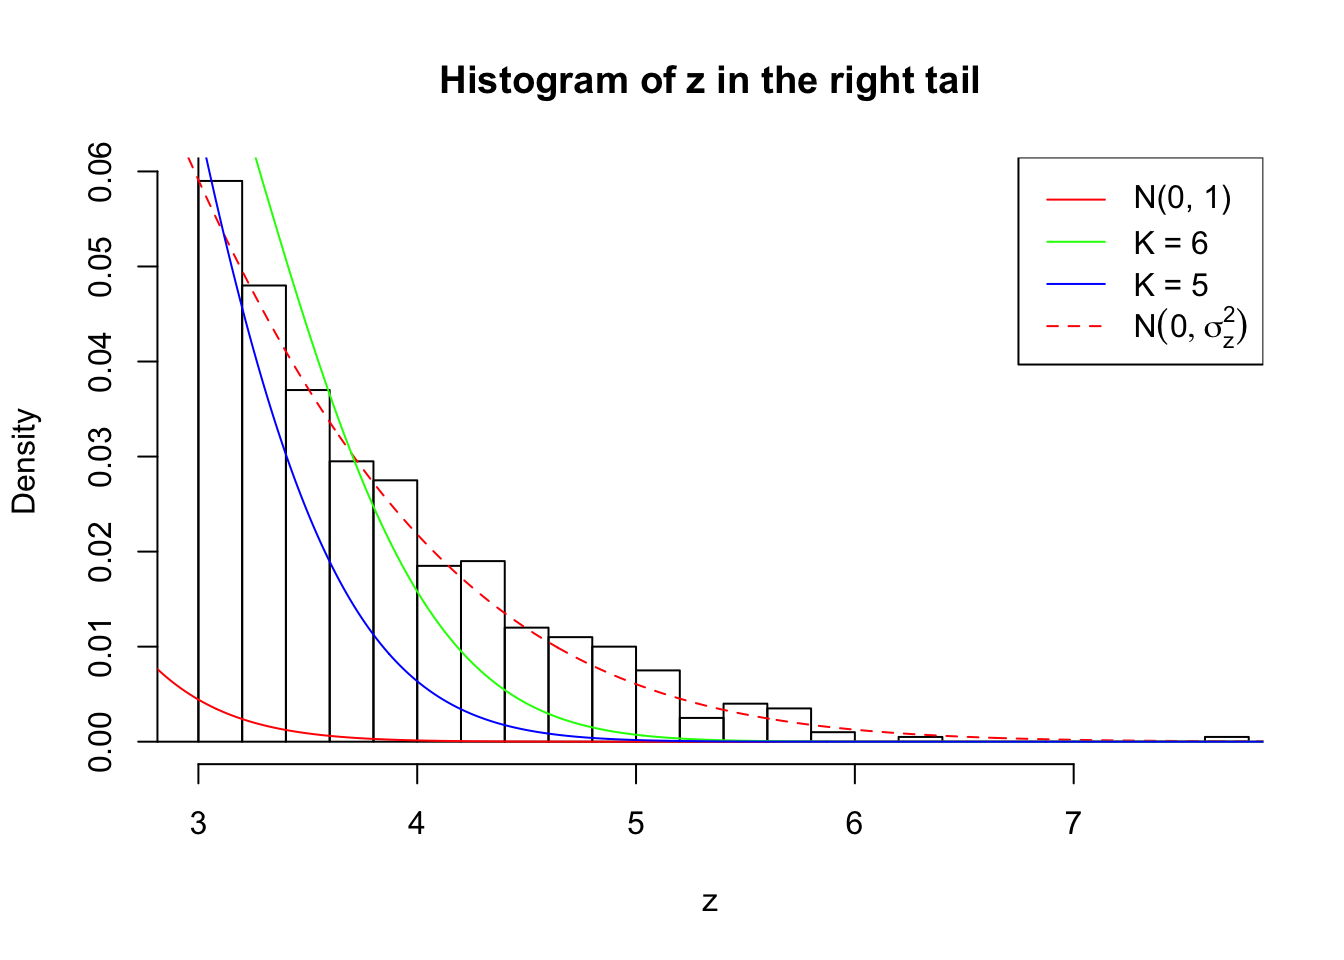
Example 5 :
SNR = 4 ;
True Distribution: N ( 0 , 3.511886 ) ;
Number of Discoveries: 1539 ;
pihat0 = 0.1875351 ;
Log-likelihood by True Distribution N ( 0, 3.511886 ) : -20479.14 ;
Log-likelihood by Gaussian Derivatives with K = 6 : -20822.78 ;
Log-likelihood Ratio between True Distribution N ( 0, 3.511886 ) and Fitted Gaussian Derivatives with K = 6 : 343.6364 ;
Normalized Weights of Gaussian Derivatives with K = 6 :
1 : 0.0353091829171418 ; 2 : 1.5488252807078 ; 3 : 0.0815738367447848 ; 4 : 1.84626451120107 ; 5 : 0.0650913631373509 ; 6 : 0.984109496544227 ;
Log-likelihood by Gaussian Derivatives with K = 5 : -21314.74 ;
Log-likelihood Ratio between True Distribution N ( 0, 3.511886 ) and Fitted Gaussian Derivatives with K = 5 : 835.5978 ;
Normalized Weights of Gaussian Derivatives with K = 5 :
1 : 0.0275284735740842 ; 2 : 1.31280586018846 ; 3 : 0.0434390282435354 ; 4 : 0.909048058129576 ; 5 : 0.0225535285052623 ; 

Zoom in to the left tail: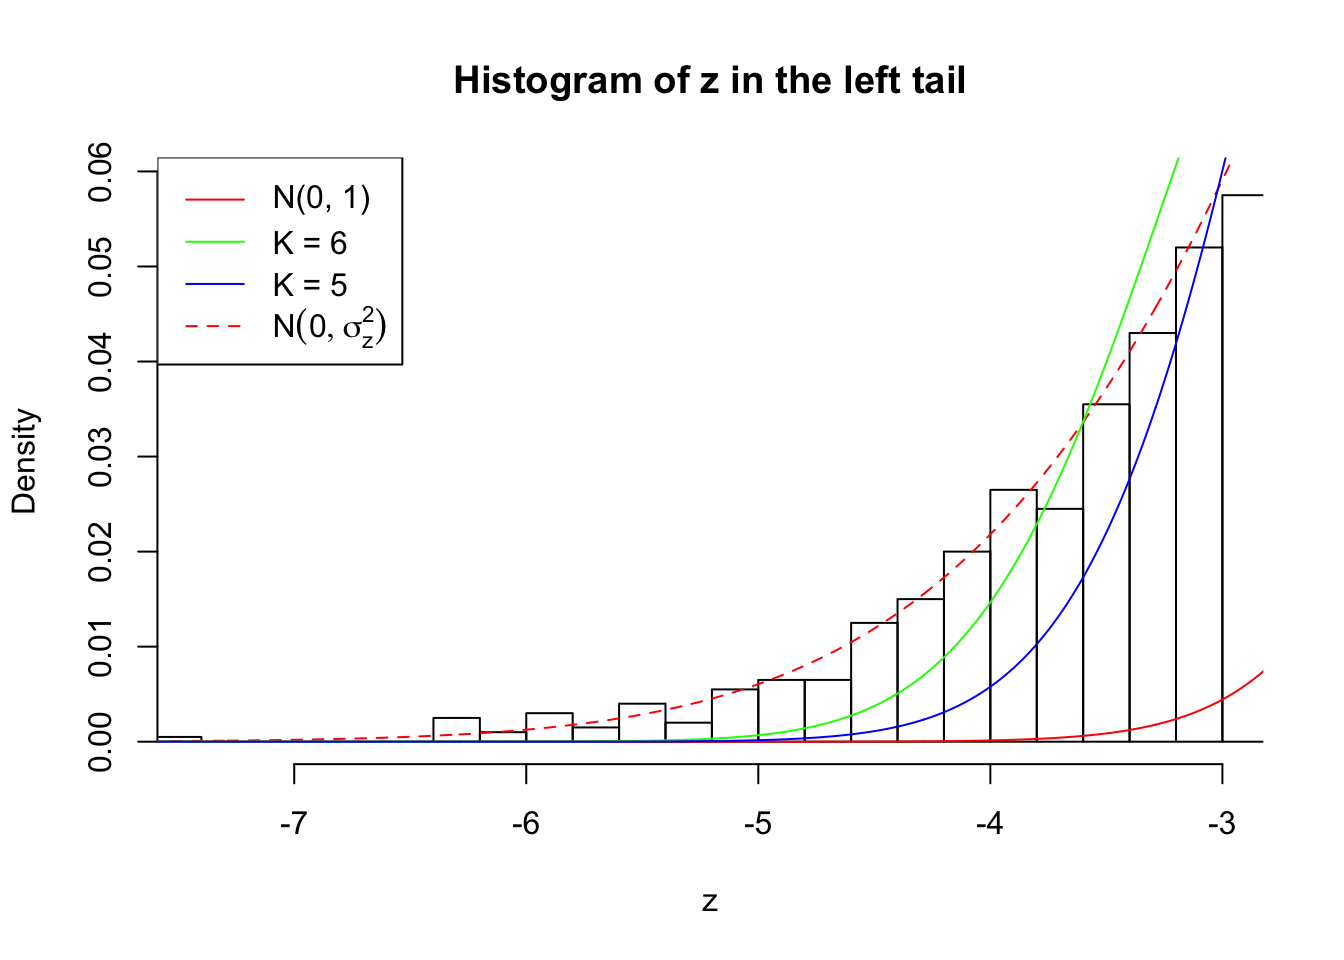
Zoom in to the right tail: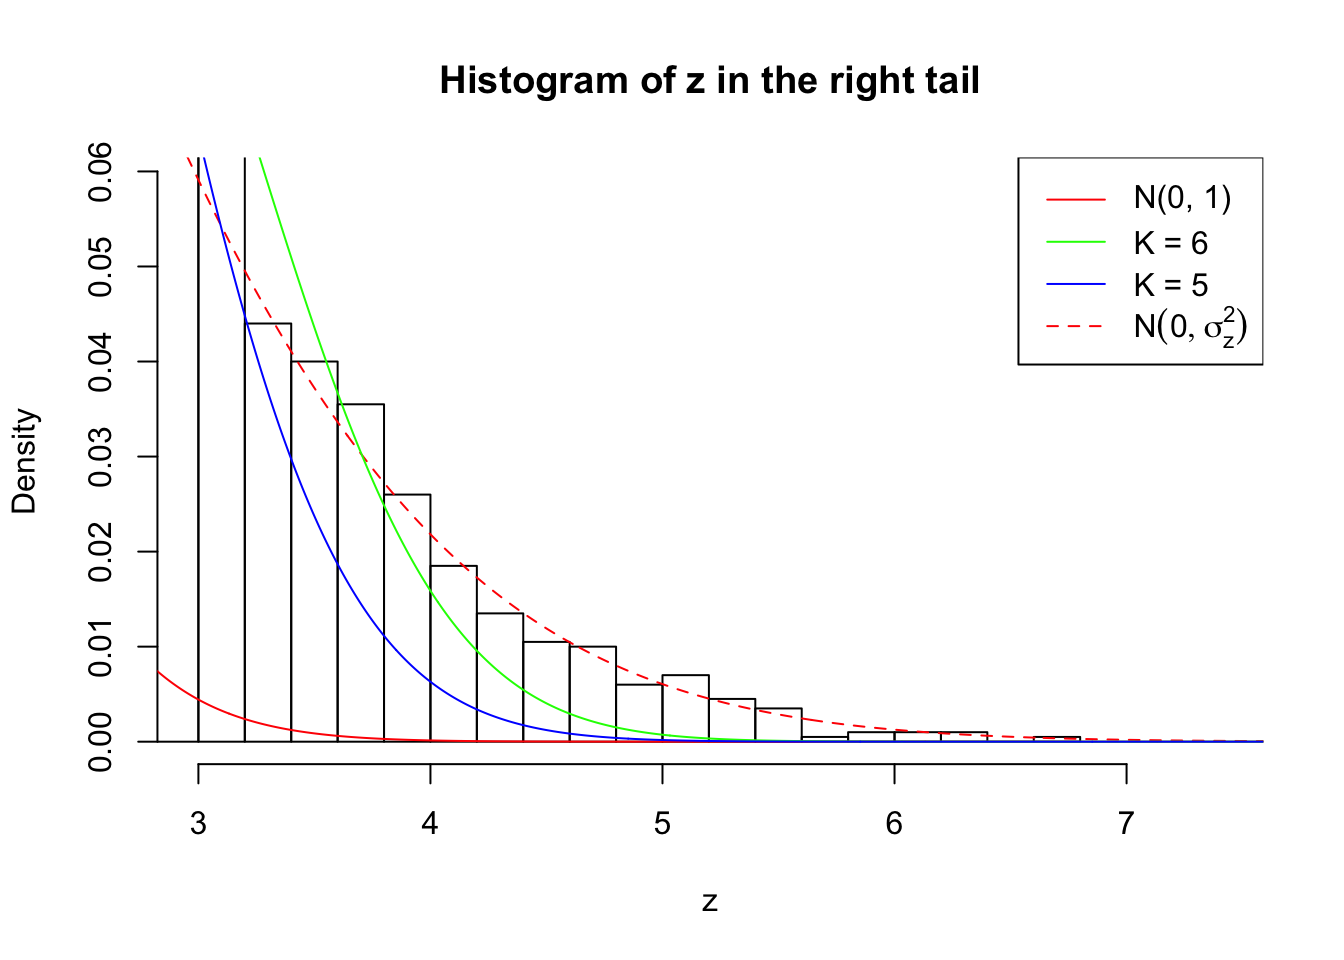
## SNR = 5 ; sigma_z = 2.040166 ; True Distribution: N ( 0 , 4.162278 ) .
Example 1 :
SNR = 5 ;
True Distribution: N ( 0 , 4.162278 ) ;
Number of Discoveries: 2181 ;
pihat0 = 0.1471061 ;
Log-likelihood by True Distribution N ( 0, 4.162278 ) : -21456.54 ;
Log-likelihood by Gaussian Derivatives with K = 7 : -22273.92 ;
Log-likelihood Ratio between True Distribution N ( 0, 4.162278 ) and Fitted Gaussian Derivatives with K = 7 : 817.3892 ;
Normalized Weights of Gaussian Derivatives with K = 7 :
1 : -0.0277287247172747 ; 2 : 1.83729841608932 ; 3 : -0.0194061221798388 ; 4 : 2.38721144713735 ; 5 : 0.0669893025894355 ; 6 : 1.33833255575326 ; 7 : 0.0601856133000998 ;
Log-likelihood by Gaussian Derivatives with K = 6 : -22316.92 ;
Log-likelihood Ratio between True Distribution N ( 0, 4.162278 ) and Fitted Gaussian Derivatives with K = 6 : 860.386 ;
Normalized Weights of Gaussian Derivatives with K = 6 :
1 : -0.031071765701026 ; 2 : 1.83200238307822 ; 3 : -0.0482607640760006 ; 4 : 2.3761386840482 ; 5 : -0.00660665954240478 ; 6 : 1.33000254948579 ; 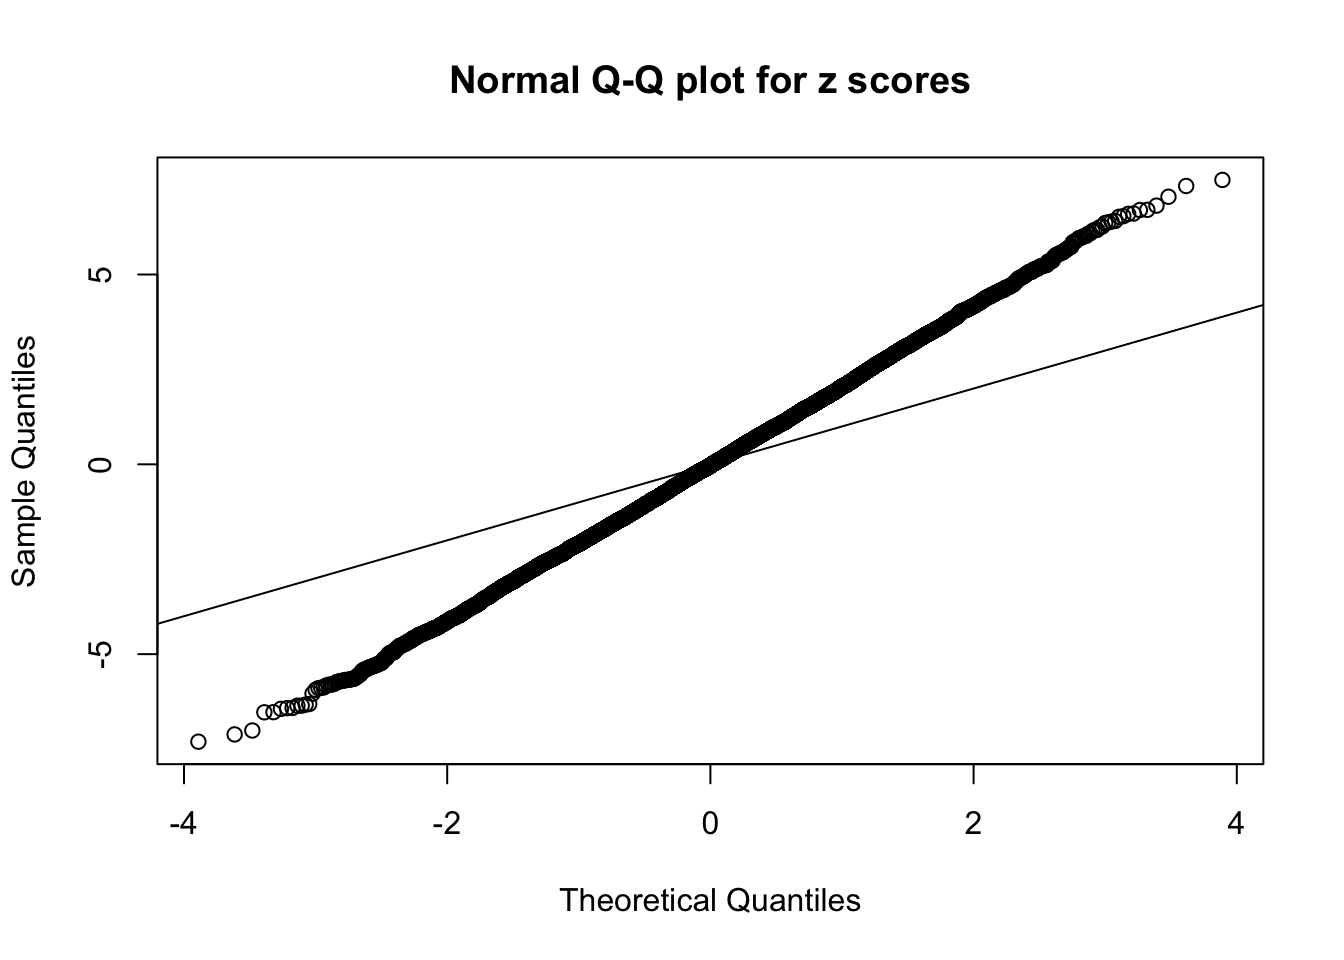


Zoom in to the left tail: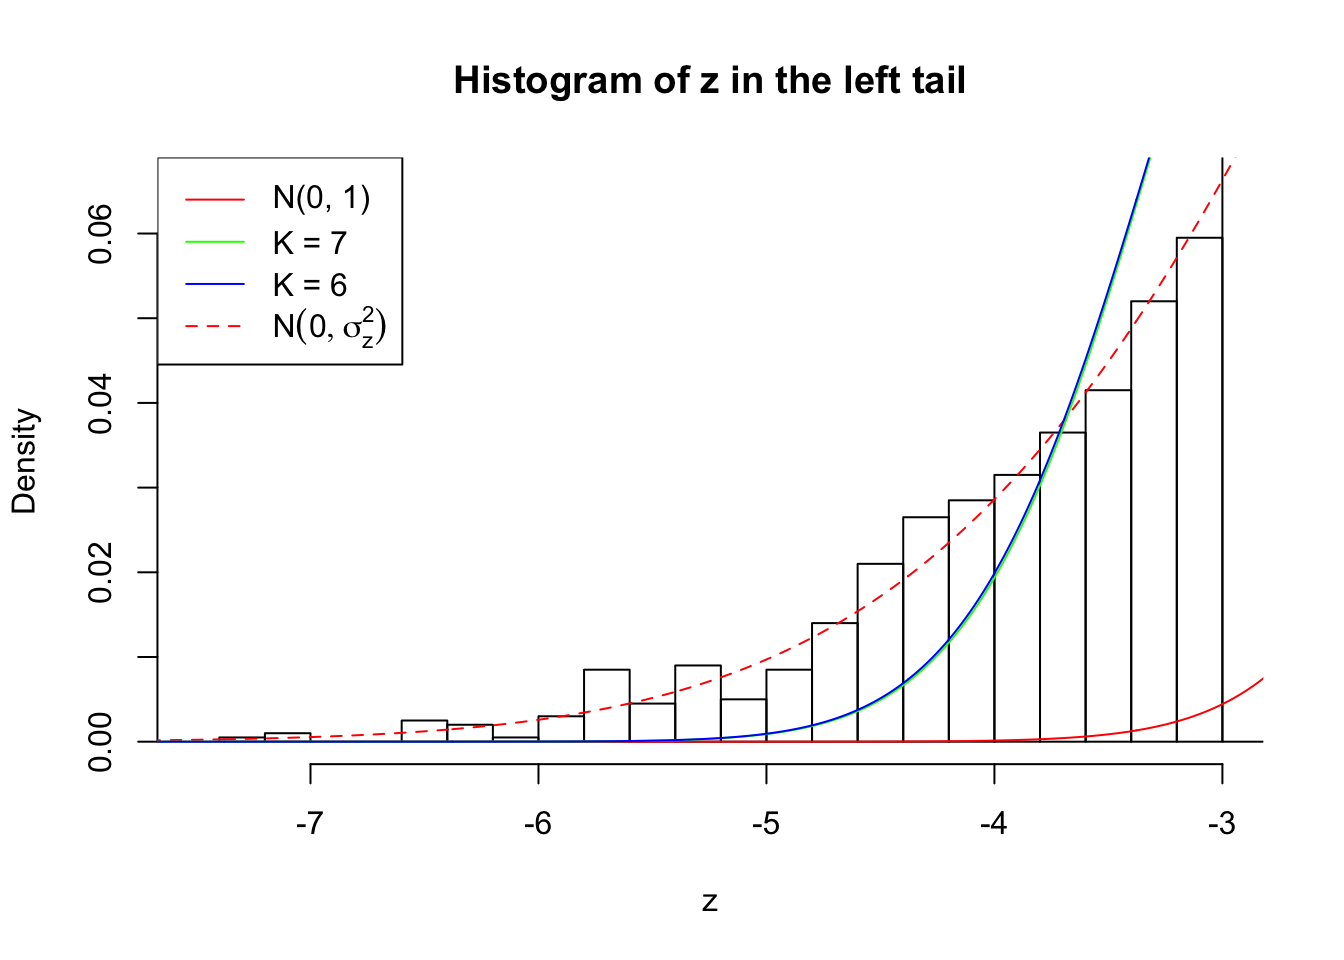
Zoom in to the right tail: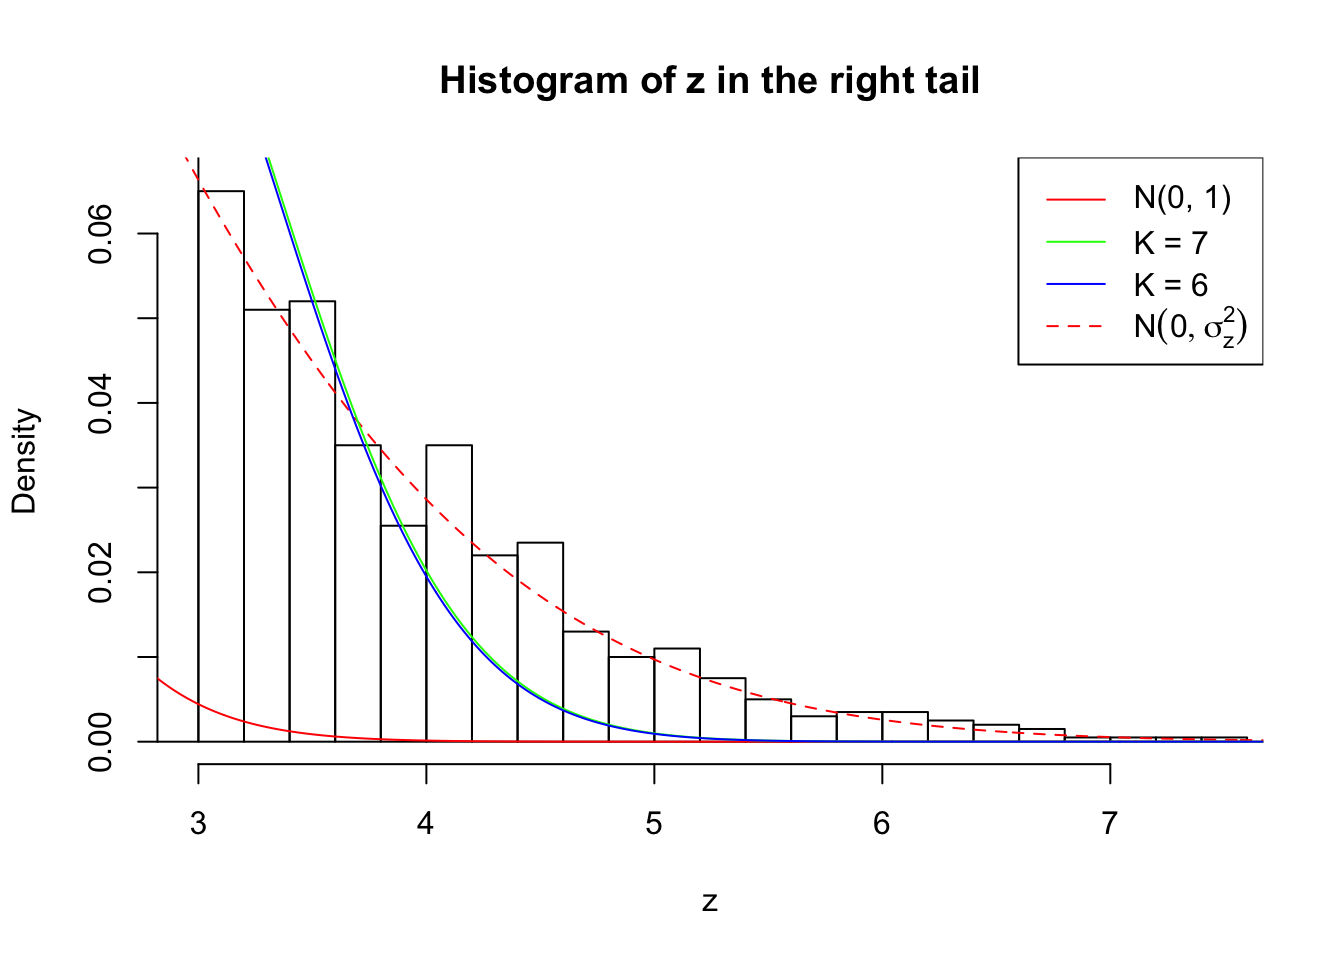
Example 2 :
SNR = 5 ;
True Distribution: N ( 0 , 4.162278 ) ;
Number of Discoveries: 2132 ;
pihat0 = 0.1710206 ;
Log-likelihood by True Distribution N ( 0, 4.162278 ) : -21360.19 ;
Log-likelihood by Gaussian Derivatives with K = 7 : -22056.24 ;
Log-likelihood Ratio between True Distribution N ( 0, 4.162278 ) and Fitted Gaussian Derivatives with K = 7 : 696.0522 ;
Normalized Weights of Gaussian Derivatives with K = 7 :
1 : -0.0302692305952895 ; 2 : 1.81095755971405 ; 3 : -0.123945606236119 ; 4 : 2.3625934945064 ; 5 : -0.16061012528612 ; 6 : 1.33954600169702 ; 7 : -0.0943016327906944 ;
Log-likelihood by Gaussian Derivatives with K = 6 : -22150.52 ;
Log-likelihood Ratio between True Distribution N ( 0, 4.162278 ) and Fitted Gaussian Derivatives with K = 6 : 790.3308 ;
Normalized Weights of Gaussian Derivatives with K = 6 :
1 : -0.0248164580551722 ; 2 : 1.79997755220376 ; 3 : -0.0786044913573935 ; 4 : 2.33958958474172 ; 5 : -0.0453793295236274 ; 6 : 1.32245550790188 ; 

Zoom in to the left tail: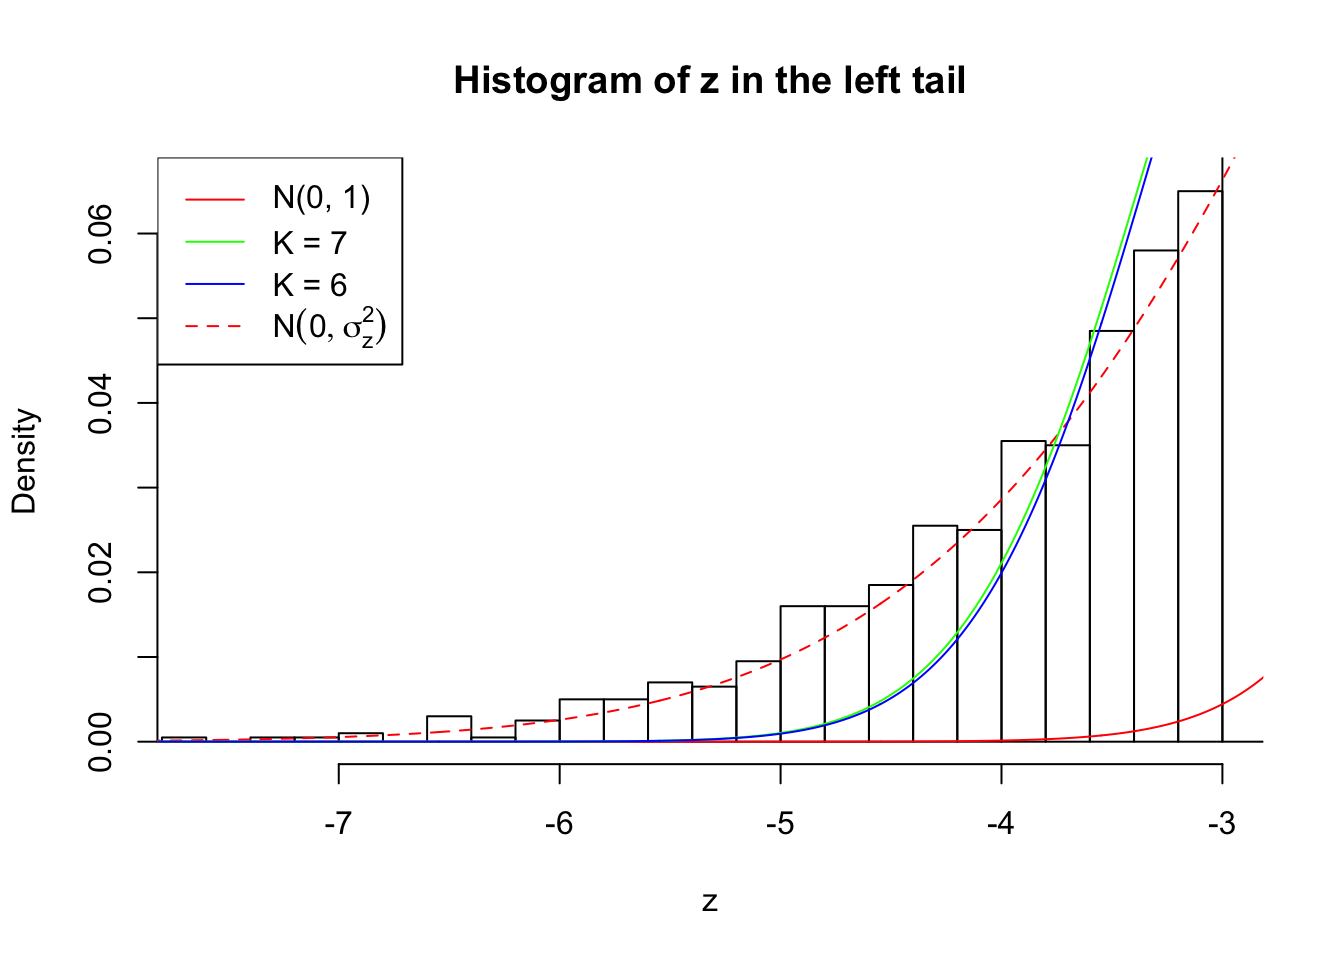
Zoom in to the right tail: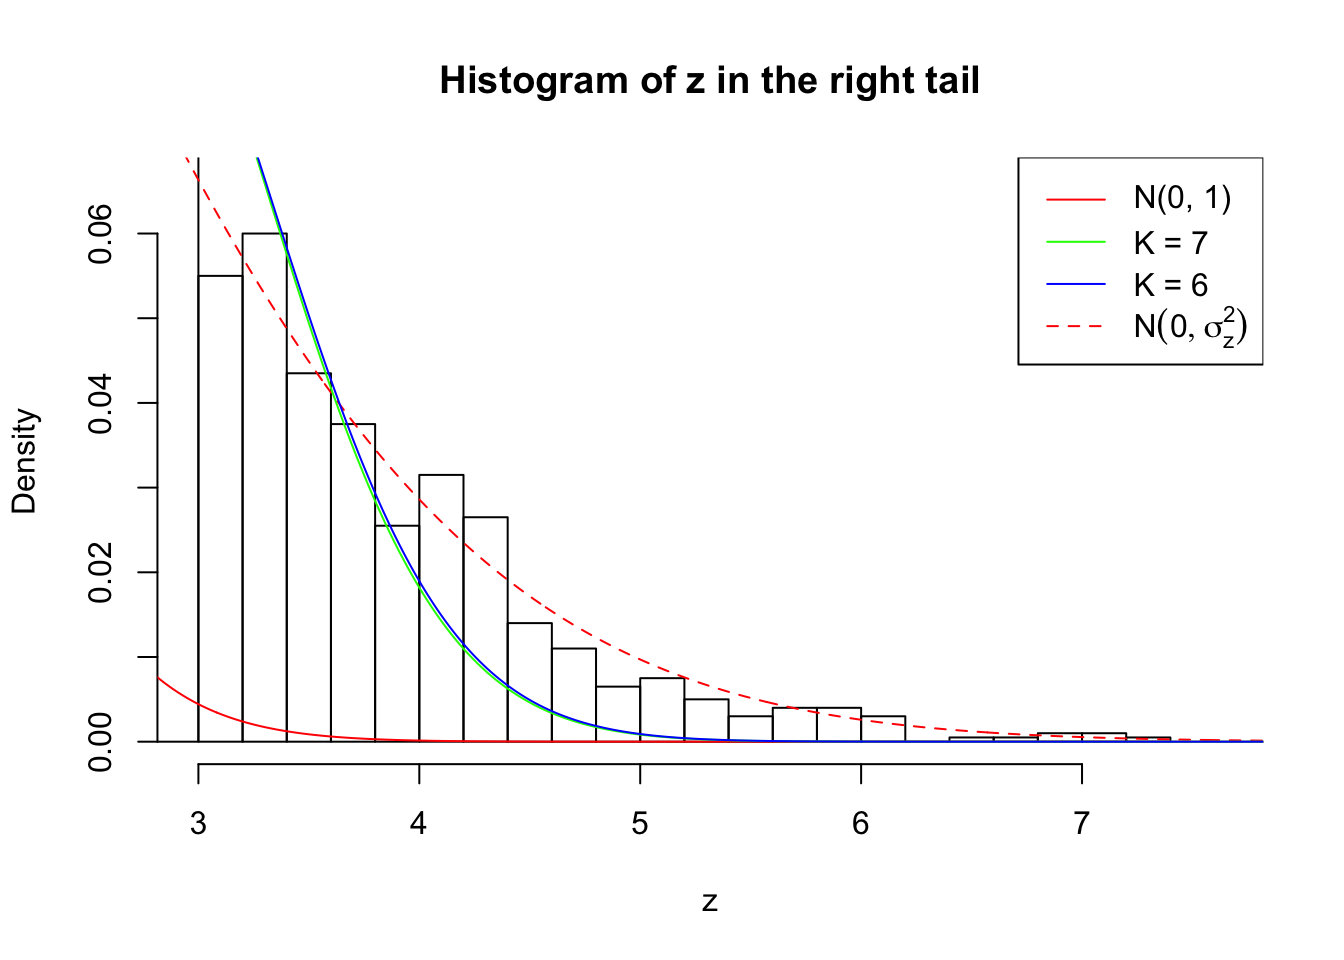
Example 3 :
SNR = 5 ;
True Distribution: N ( 0 , 4.162278 ) ;
Number of Discoveries: 2022 ;
pihat0 = 0.1179668 ;
Log-likelihood by True Distribution N ( 0, 4.162278 ) : -21300.12 ;
Log-likelihood by Gaussian Derivatives with K = 6 : -22024.14 ;
Log-likelihood Ratio between True Distribution N ( 0, 4.162278 ) and Fitted Gaussian Derivatives with K = 6 : 724.023 ;
Normalized Weights of Gaussian Derivatives with K = 6 :
1 : 0.000731727484443342 ; 2 : 1.77628066195772 ; 3 : -0.0183224310340538 ; 4 : 2.2544384353018 ; 5 : -0.0421725370426179 ; 6 : 1.25470467115244 ;
Log-likelihood by Gaussian Derivatives with K = 5 : -22930.59 ;
Log-likelihood Ratio between True Distribution N ( 0, 4.162278 ) and Fitted Gaussian Derivatives with K = 5 : 1630.466 ;
Normalized Weights of Gaussian Derivatives with K = 5 :
1 : 0.0109224327550832 ; 2 : 1.47160826685493 ; 3 : 0.0151877858144352 ; 4 : 1.05250752843448 ; 5 : -0.0104184675847151 ; 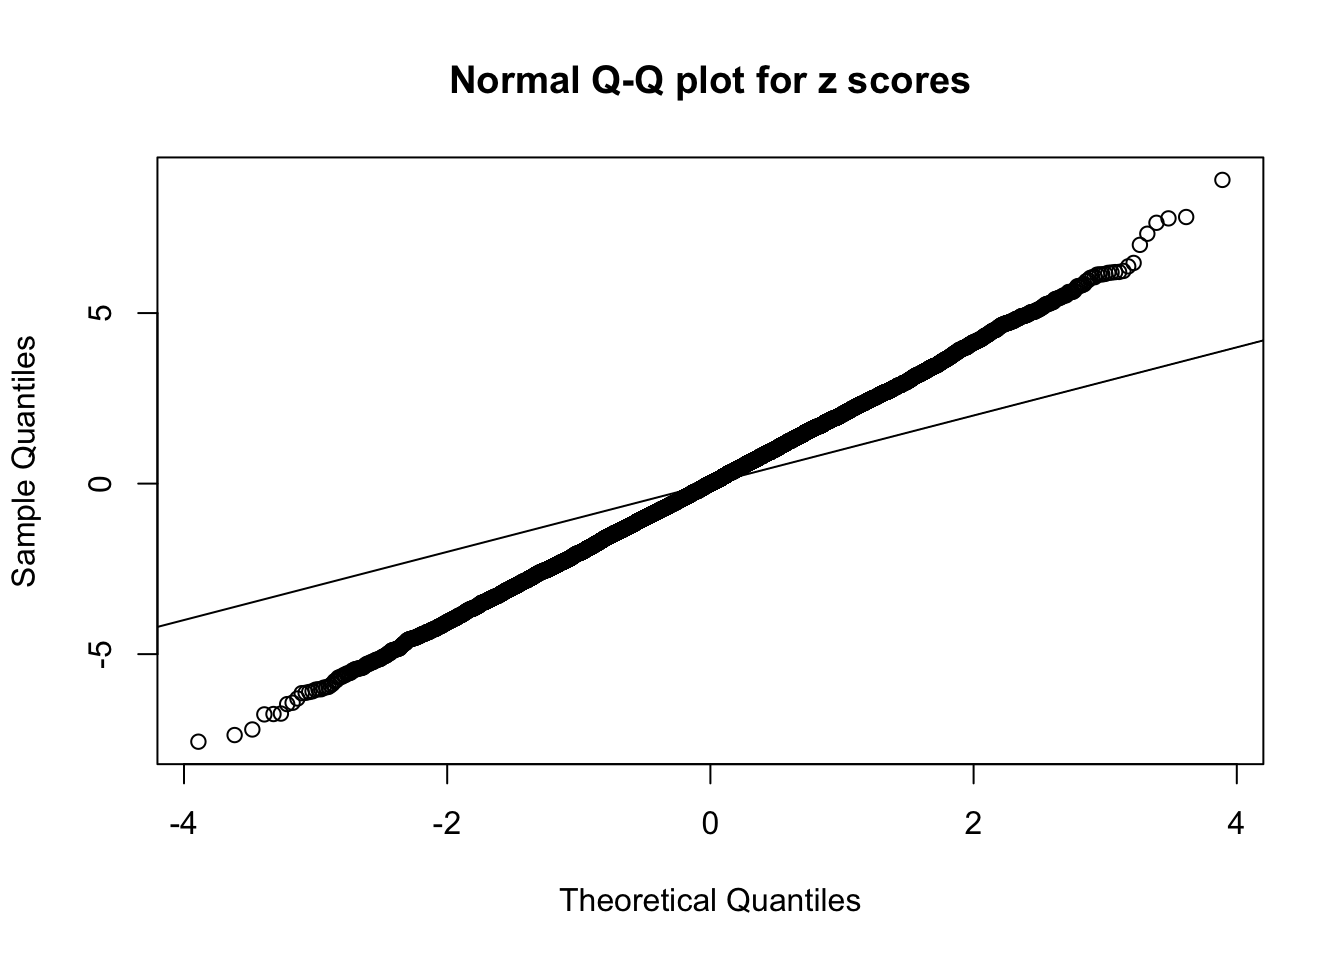


Zoom in to the left tail: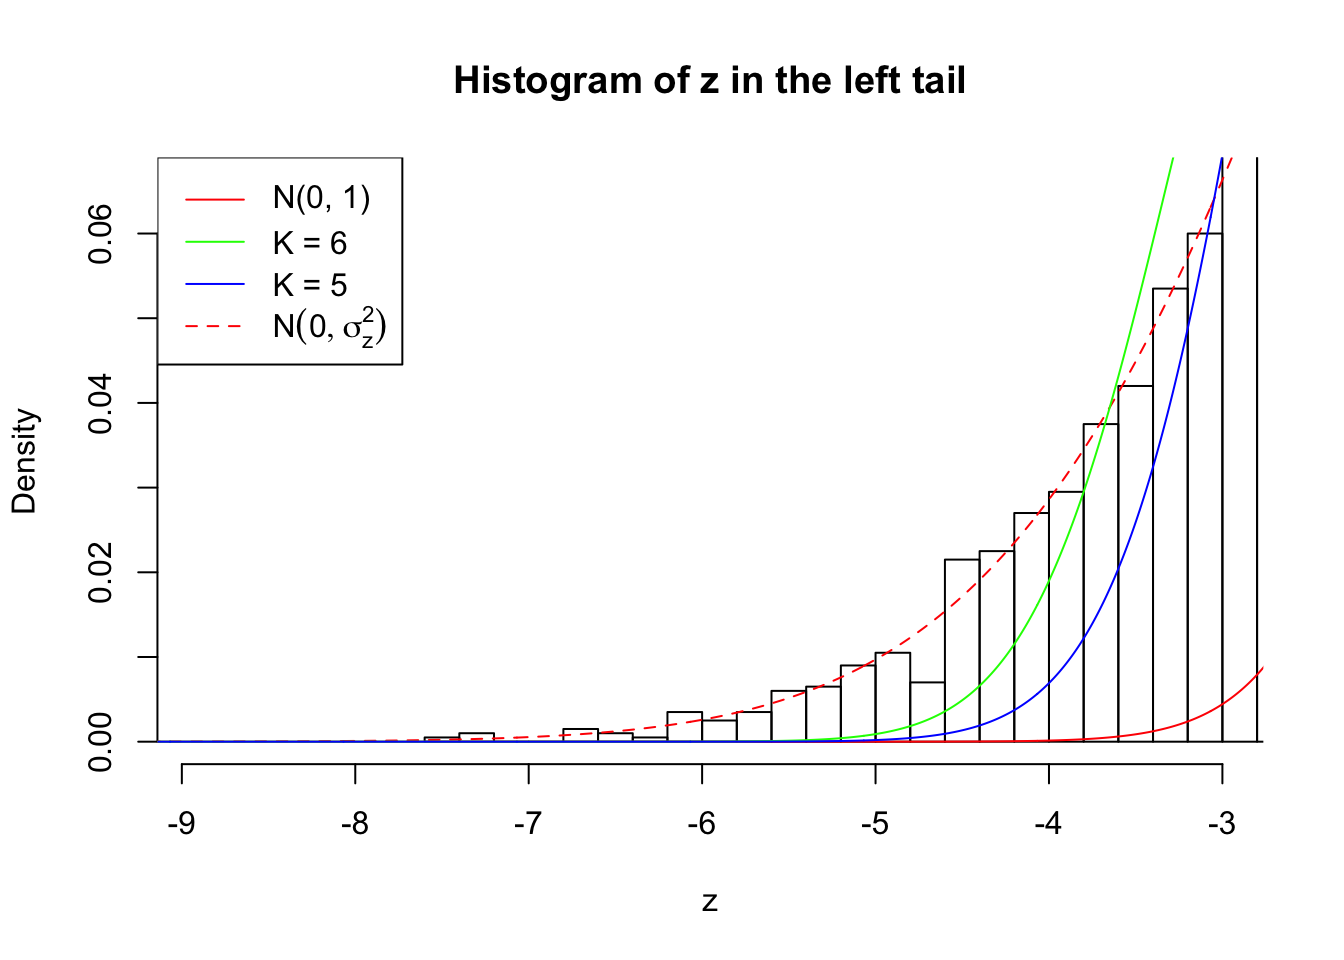
Zoom in to the right tail: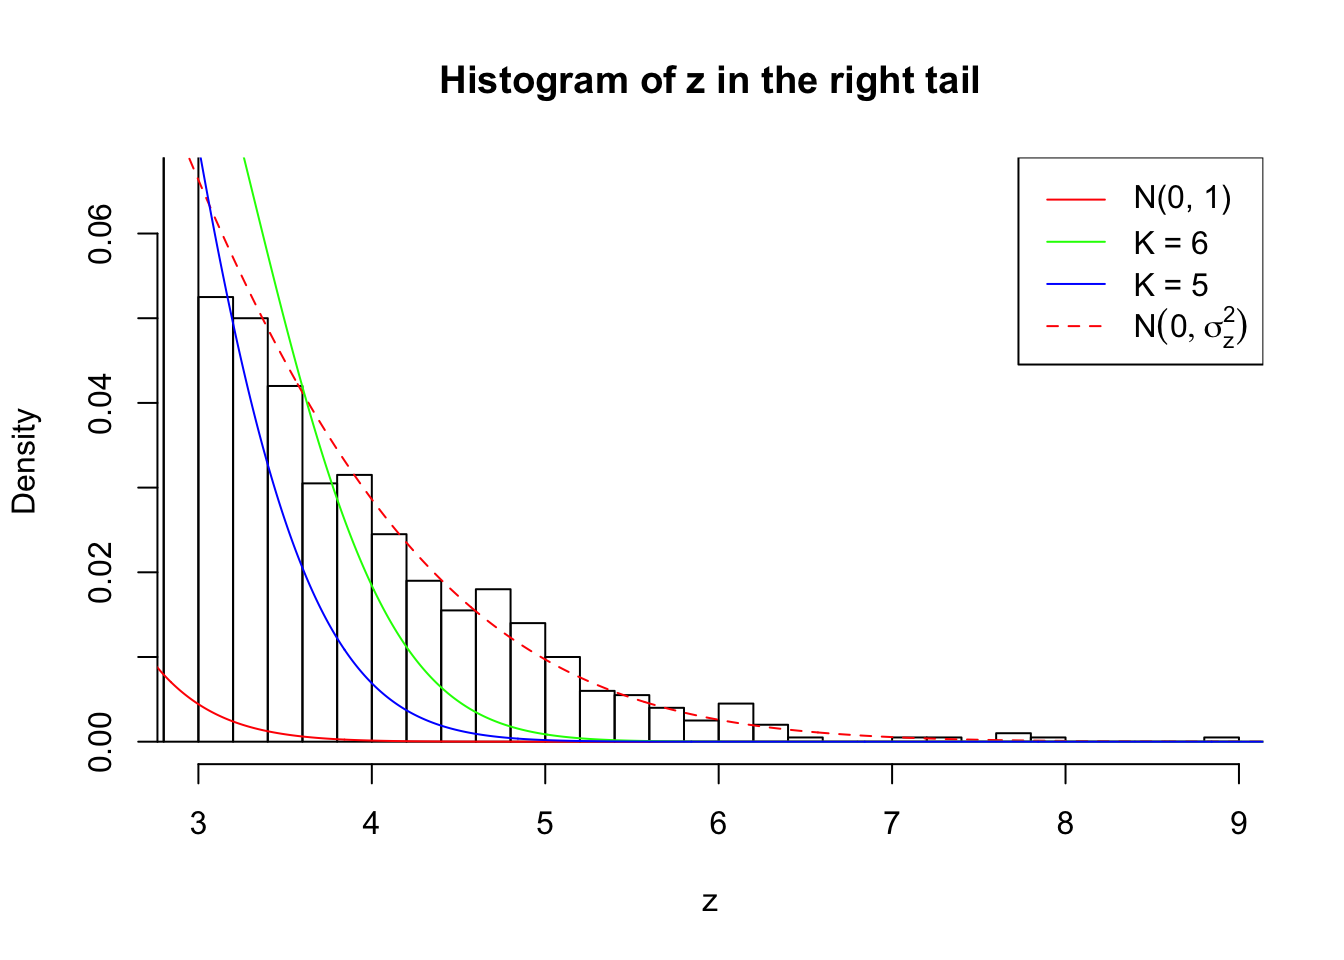
Example 4 :
SNR = 5 ;
True Distribution: N ( 0 , 4.162278 ) ;
Number of Discoveries: 1955 ;
pihat0 = 0.1390593 ;
Log-likelihood by True Distribution N ( 0, 4.162278 ) : -21222.54 ;
Log-likelihood by Gaussian Derivatives with K = 6 : -21916.99 ;
Log-likelihood Ratio between True Distribution N ( 0, 4.162278 ) and Fitted Gaussian Derivatives with K = 6 : 694.4488 ;
Normalized Weights of Gaussian Derivatives with K = 6 :
1 : -0.01082394354273 ; 2 : 1.76860322355297 ; 3 : -0.0212147026883038 ; 4 : 2.21317753779356 ; 5 : -0.0257310173508894 ; 6 : 1.20281481409197 ;
Log-likelihood by Gaussian Derivatives with K = 5 : -22712.84 ;
Log-likelihood Ratio between True Distribution N ( 0, 4.162278 ) and Fitted Gaussian Derivatives with K = 5 : 1490.302 ;
Normalized Weights of Gaussian Derivatives with K = 5 :
1 : -0.00519465956622556 ; 2 : 1.4699555974489 ; 3 : 0.000543992287838269 ; 4 : 1.04946806984471 ; 5 : -0.00321855532758913 ; 


Zoom in to the left tail: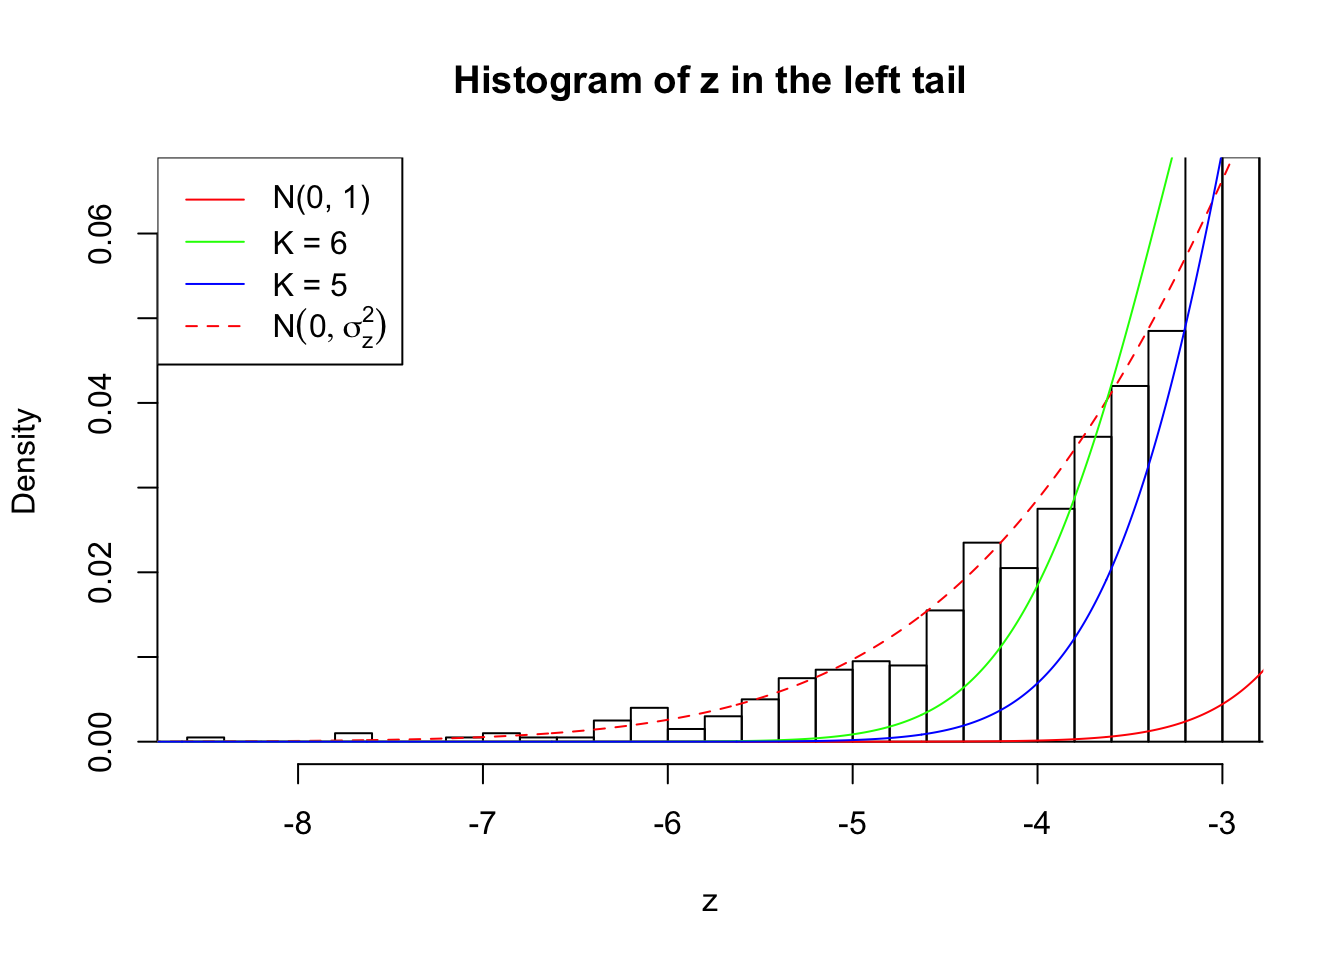
Zoom in to the right tail: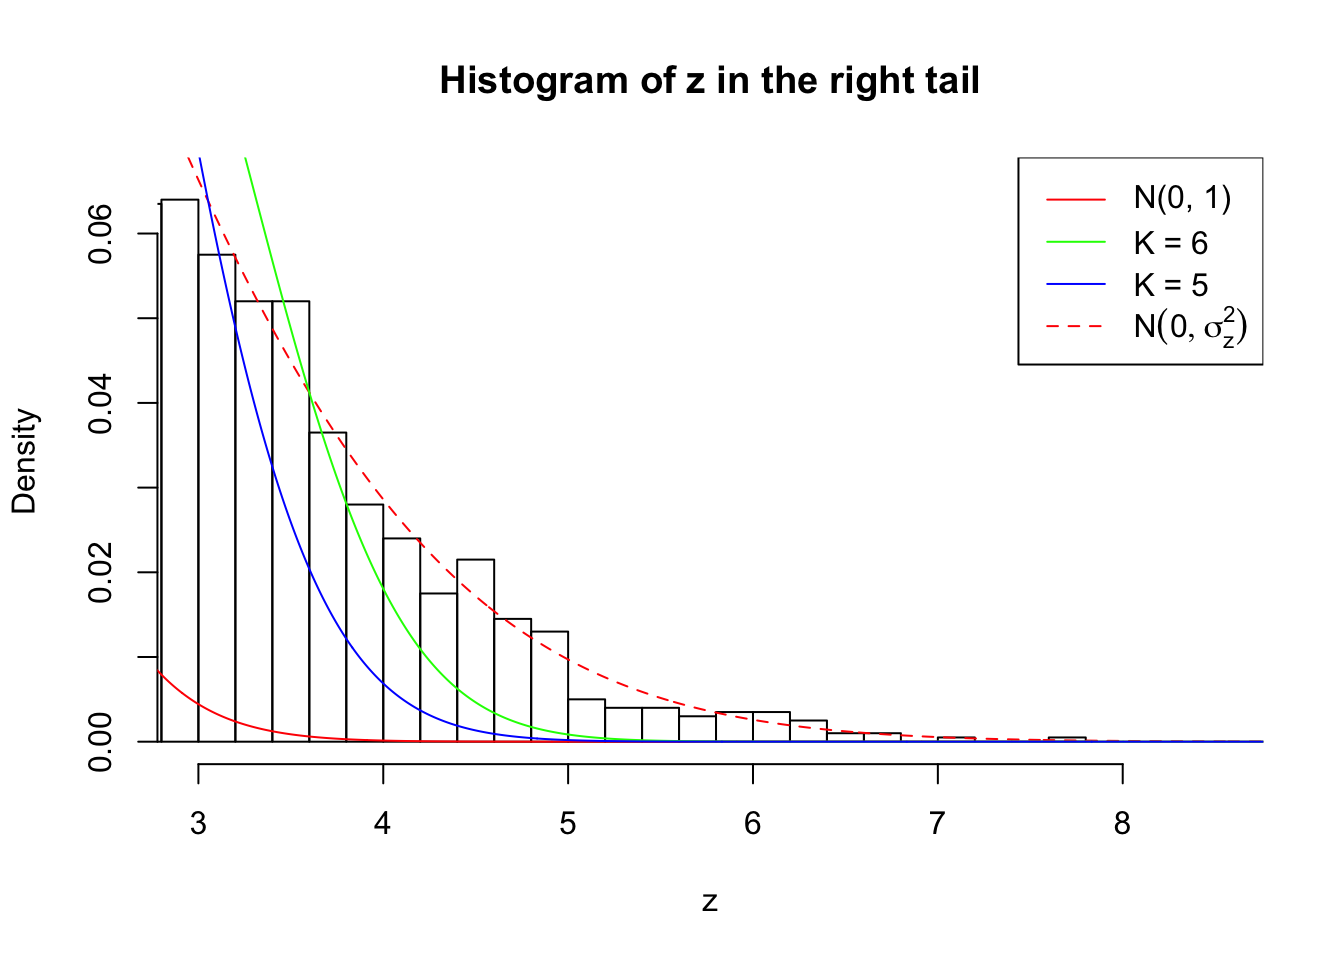
Example 5 :
SNR = 5 ;
True Distribution: N ( 0 , 4.162278 ) ;
Number of Discoveries: 2084 ;
pihat0 = 0.1694246 ;
Log-likelihood by True Distribution N ( 0, 4.162278 ) : -21326.66 ;
Log-likelihood by Gaussian Derivatives with K = 7 : -22026.65 ;
Log-likelihood Ratio between True Distribution N ( 0, 4.162278 ) and Fitted Gaussian Derivatives with K = 7 : 699.9825 ;
Normalized Weights of Gaussian Derivatives with K = 7 :
1 : 0.034611676260936 ; 2 : 1.8019192495016 ; 3 : 0.0702645299158879 ; 4 : 2.33324813754215 ; 5 : 0.0632684084249024 ; 6 : 1.30020235325766 ; 7 : 0.014351484665824 ;
Log-likelihood by Gaussian Derivatives with K = 6 : -22108.35 ;
Log-likelihood Ratio between True Distribution N ( 0, 4.162278 ) and Fitted Gaussian Derivatives with K = 6 : 781.6903 ;
Normalized Weights of Gaussian Derivatives with K = 6 :
1 : 0.0335621187013486 ; 2 : 1.79225356399466 ; 3 : 0.0627592982733057 ; 4 : 2.3134090885158 ; 5 : 0.0451433691894302 ; 6 : 1.28552689070843 ; 


Zoom in to the left tail: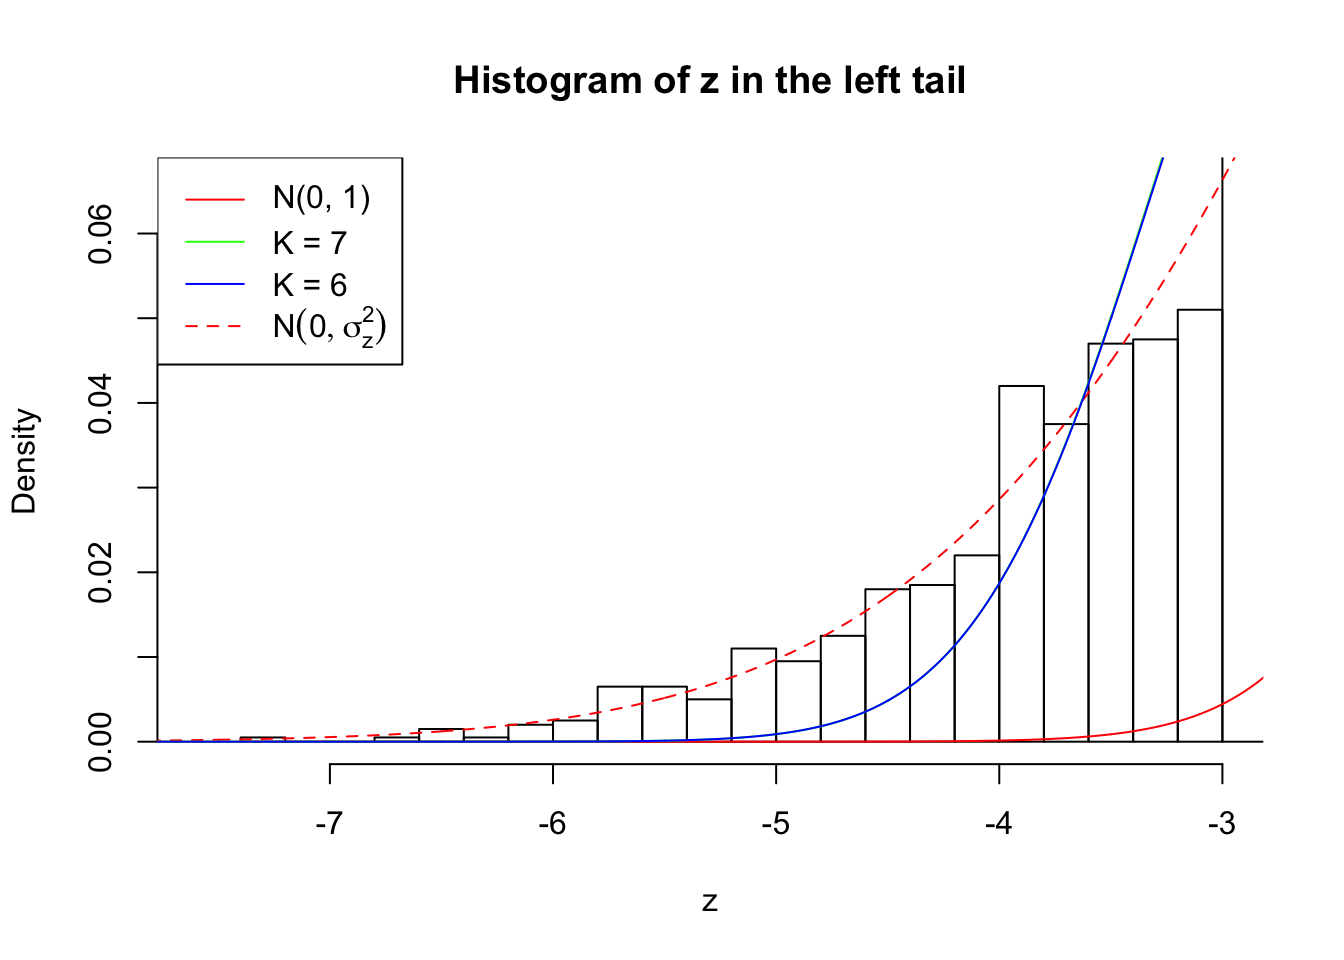
Zoom in to the right tail: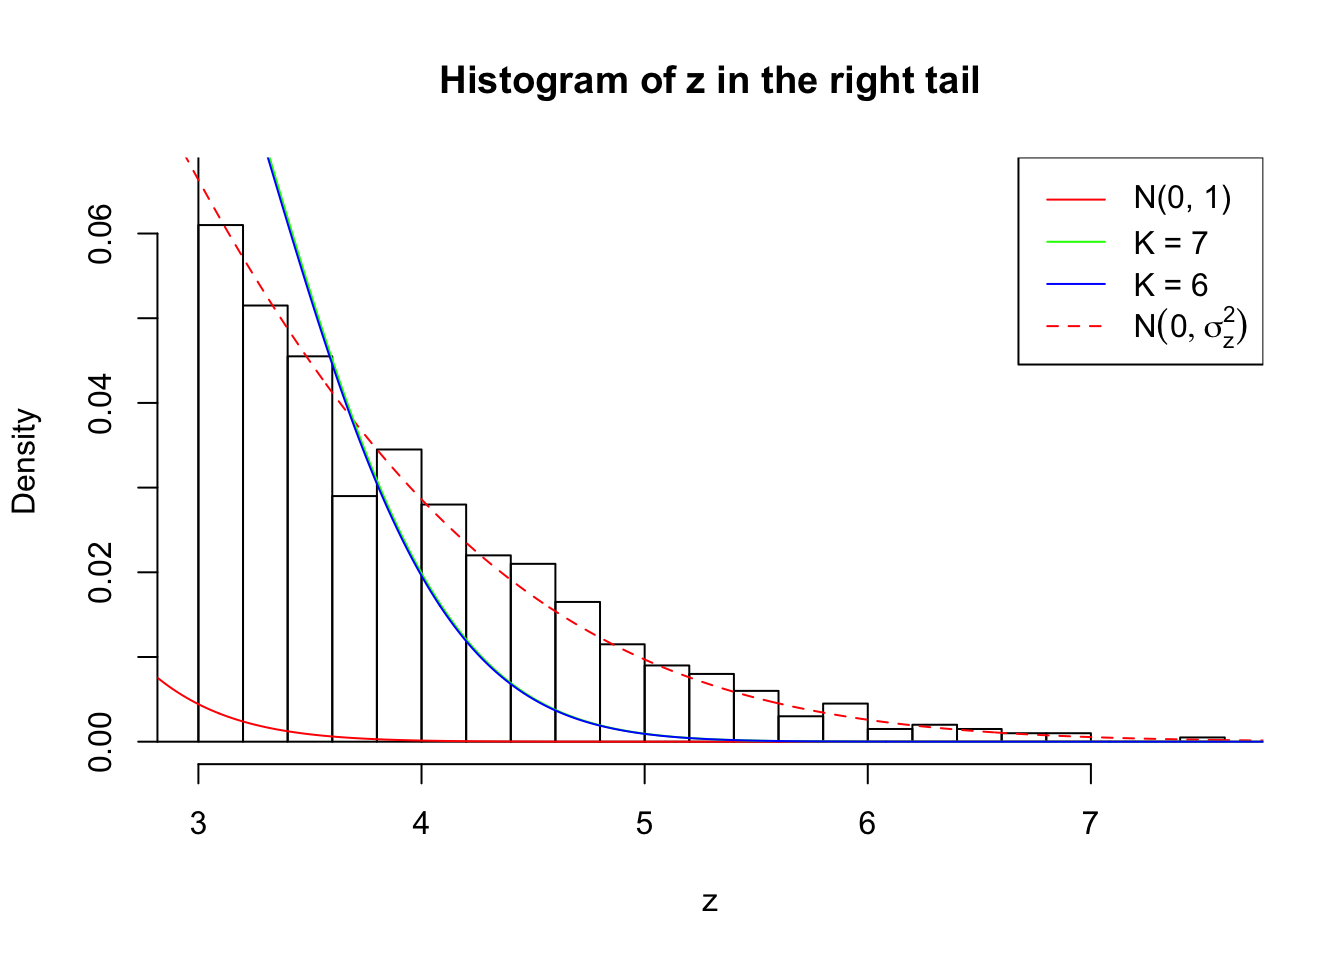
## SNR = 6 ; sigma_z = 2.231831 ; True Distribution: N ( 0 , 4.981072 ) .
Example 1 :
SNR = 6 ;
True Distribution: N ( 0 , 4.981072 ) ;
Number of Discoveries: 2683 ;
pihat0 = 0.1414556 ;
Log-likelihood by True Distribution N ( 0, 4.981072 ) : -22239.22 ;
Log-likelihood by Gaussian Derivatives with K = 6 : -23730.07 ;
Log-likelihood Ratio between True Distribution N ( 0, 4.981072 ) and Fitted Gaussian Derivatives with K = 6 : 1490.851 ;
Normalized Weights of Gaussian Derivatives with K = 6 :
1 : 0.0296803542499545 ; 2 : 2.07614733637123 ; 3 : 0.0703932598614685 ; 4 : 2.85025980724701 ; 5 : 0.0596934102982105 ; 6 : 1.60294149075837 ;
Log-likelihood by Gaussian Derivatives with K = 5 : -25033.34 ;
Log-likelihood Ratio between True Distribution N ( 0, 4.981072 ) and Fitted Gaussian Derivatives with K = 5 : 2794.116 ;
Normalized Weights of Gaussian Derivatives with K = 5 :
1 : 0.00787281872235832 ; 2 : 1.6598745095546 ; 3 : 0.0327468776020723 ; 4 : 1.26207912428607 ; 5 : 0.0409404655346192 ; 


Zoom in to the left tail: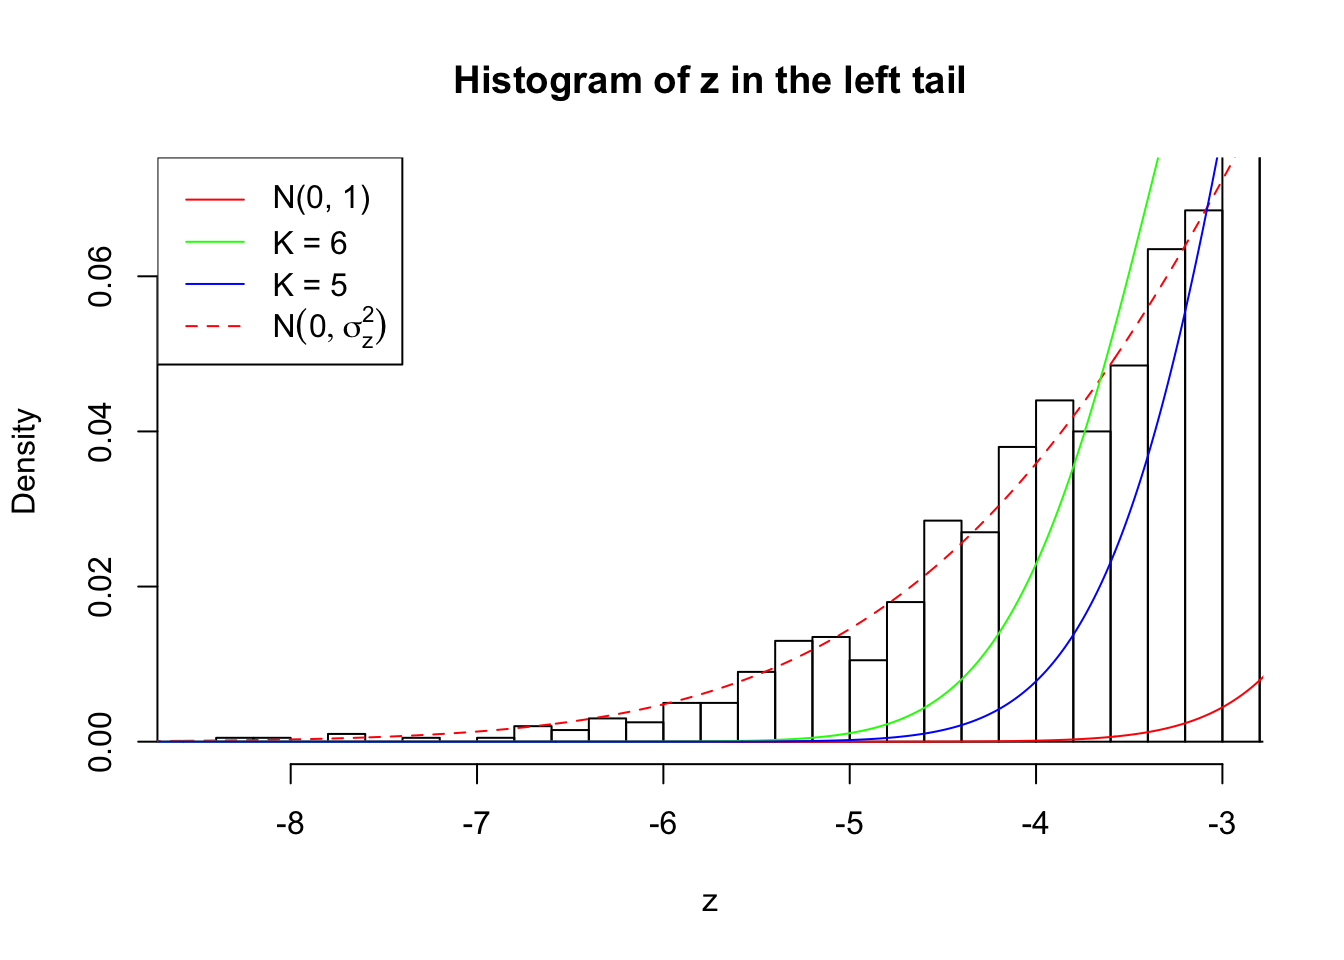
Zoom in to the right tail: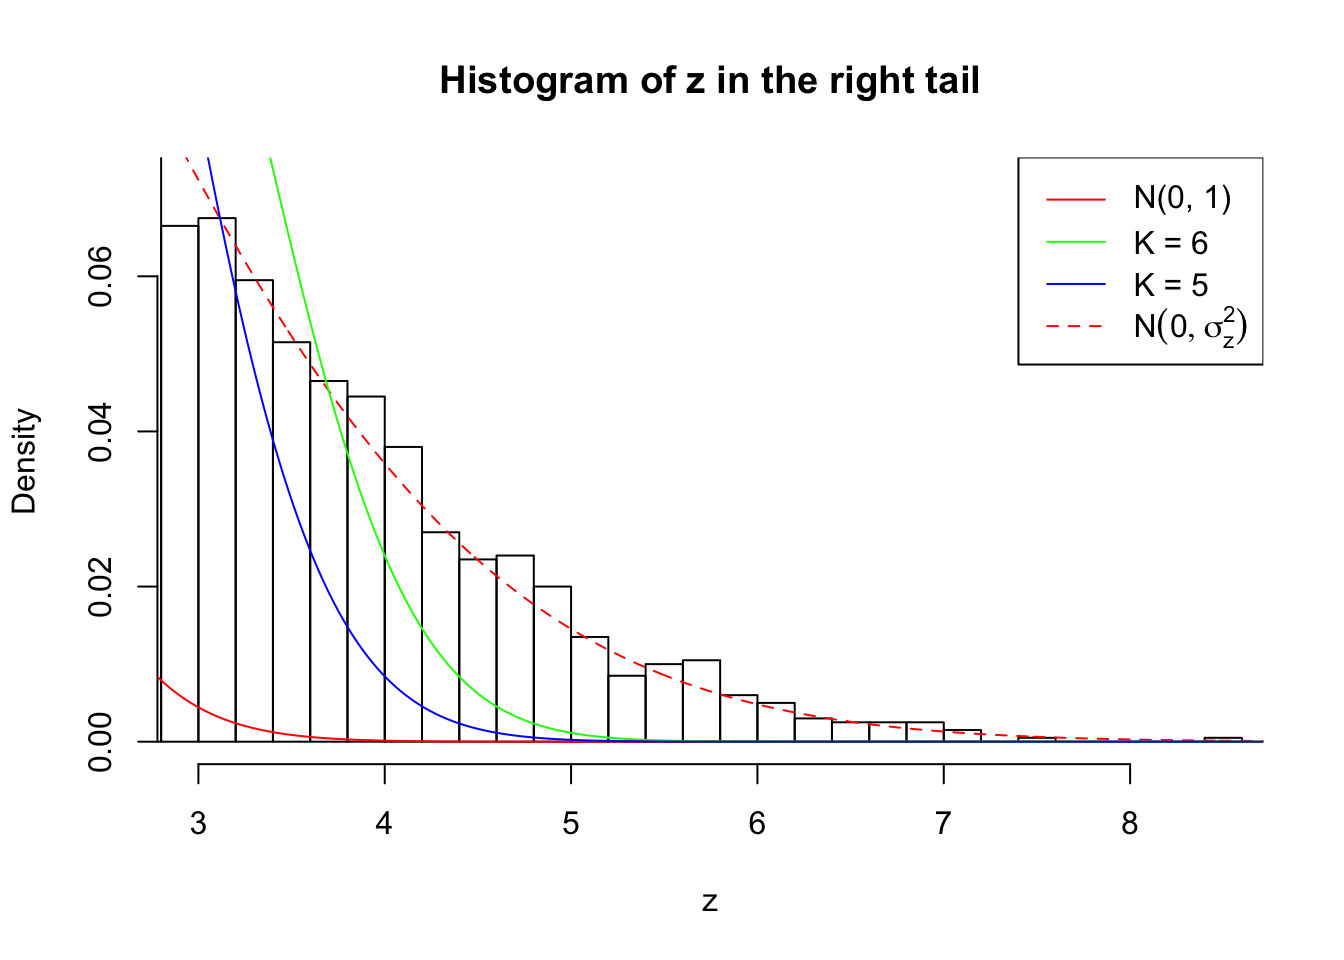
Example 2 :
SNR = 6 ;
True Distribution: N ( 0 , 4.981072 ) ;
Number of Discoveries: 2782 ;
pihat0 = 0.14379 ;
Log-likelihood by True Distribution N ( 0, 4.981072 ) : -22307.73 ;
Log-likelihood by Gaussian Derivatives with K = 6 : -23759.97 ;
Log-likelihood Ratio between True Distribution N ( 0, 4.981072 ) and Fitted Gaussian Derivatives with K = 6 : 1452.239 ;
Normalized Weights of Gaussian Derivatives with K = 6 :
1 : 0.00968653765934509 ; 2 : 2.11764080114054 ; 3 : 0.00614427739560328 ; 4 : 2.91545496587689 ; 5 : -0.0290001943355776 ; 6 : 1.65319096959502 ;
Log-likelihood by Gaussian Derivatives with K = 5 : -25154.82 ;
Log-likelihood Ratio between True Distribution N ( 0, 4.981072 ) and Fitted Gaussian Derivatives with K = 5 : 2847.087 ;
Normalized Weights of Gaussian Derivatives with K = 5 :
1 : 0.0128279354380785 ; 2 : 1.68364560918076 ; 3 : 0.0160969375686653 ; 4 : 1.2704432431804 ; 5 : -0.0126453926481678 ; 

Zoom in to the left tail: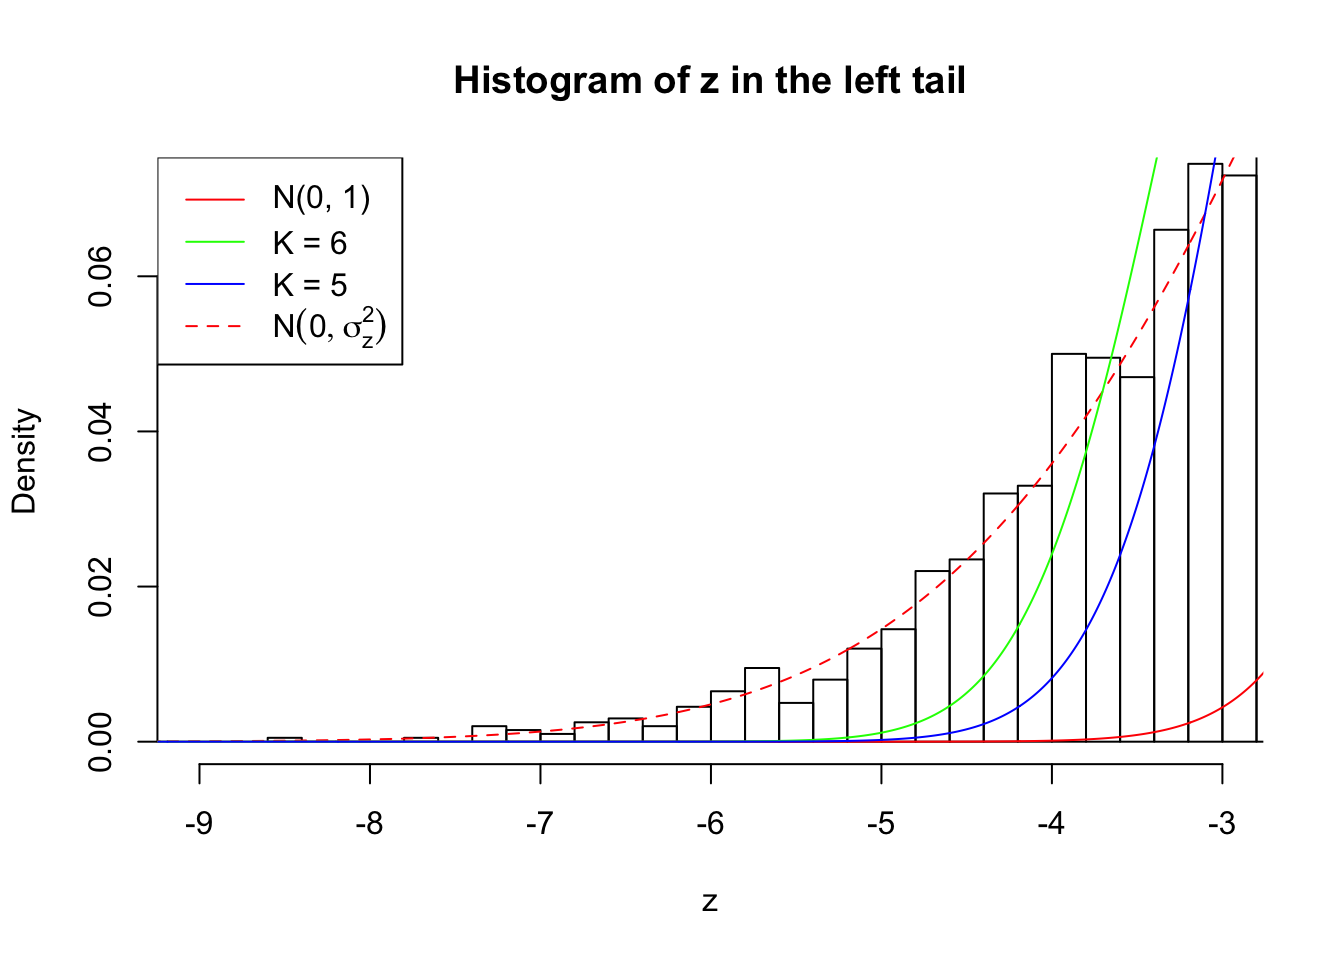
Zoom in to the right tail: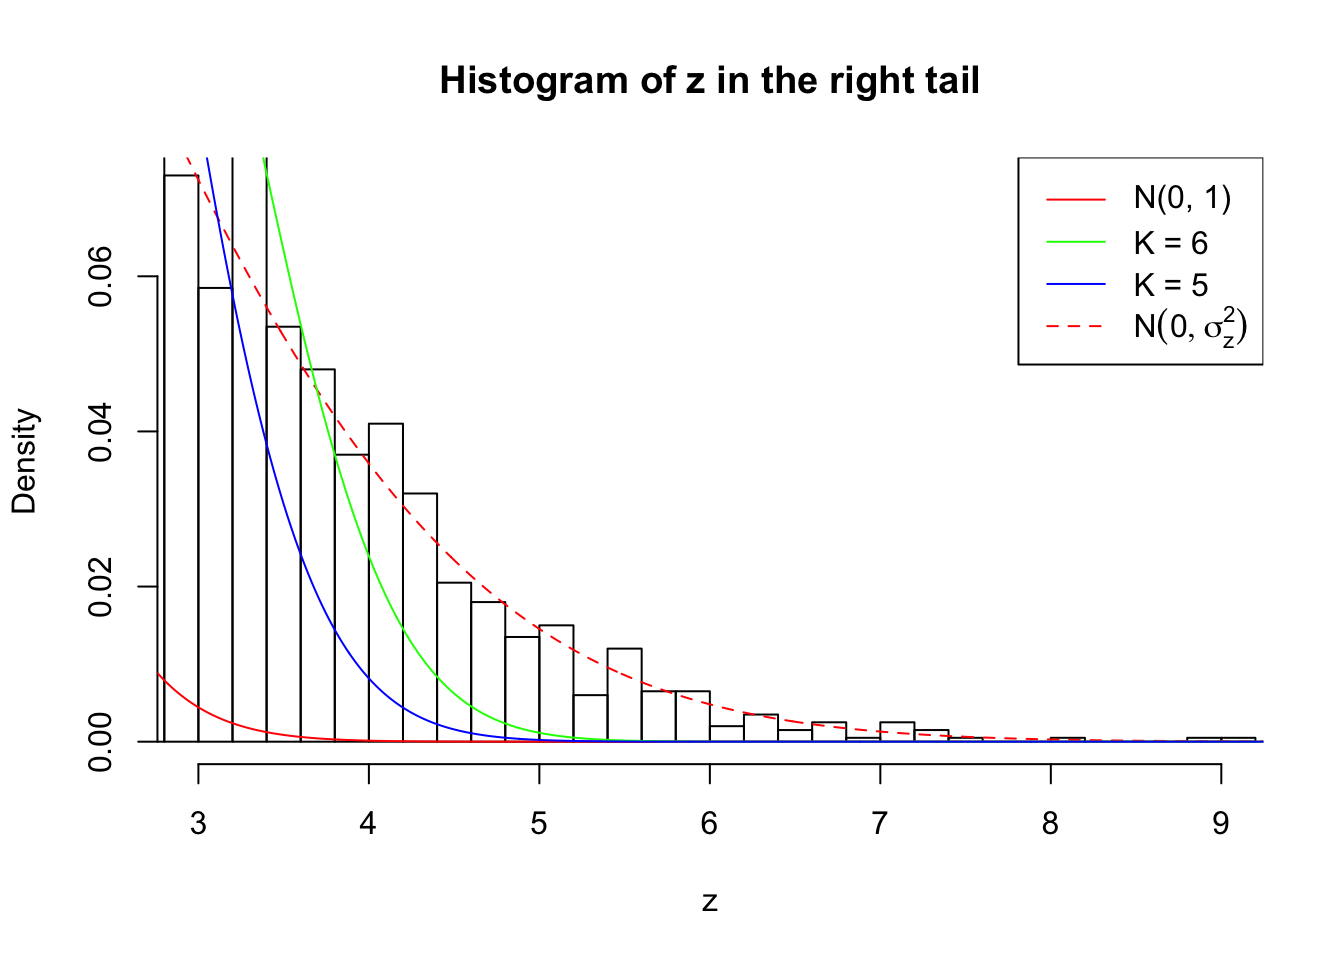
Example 3 :
SNR = 6 ;
True Distribution: N ( 0 , 4.981072 ) ;
Number of Discoveries: 2649 ;
pihat0 = 0.1090815 ;
Log-likelihood by True Distribution N ( 0, 4.981072 ) : -22258.28 ;
Log-likelihood by Gaussian Derivatives with K = 6 : -23529.81 ;
Log-likelihood Ratio between True Distribution N ( 0, 4.981072 ) and Fitted Gaussian Derivatives with K = 6 : 1271.533 ;
Normalized Weights of Gaussian Derivatives with K = 6 :
1 : 0.0011428411494417 ; 2 : 1.95662124625593 ; 3 : -0.0224171808790388 ; 4 : 2.49991702360509 ; 5 : -0.00366220135857955 ; 6 : 1.36757833770512 ;
Log-likelihood by Gaussian Derivatives with K = 5 : -25155.11 ;
Log-likelihood Ratio between True Distribution N ( 0, 4.981072 ) and Fitted Gaussian Derivatives with K = 5 : 2896.828 ;
Normalized Weights of Gaussian Derivatives with K = 5 :
1 : -0.00385085258044298 ; 2 : 1.67314628611184 ; 3 : -0.0169085908314758 ; 4 : 1.24156513591502 ; 5 : 0.00800909685413182 ; 


Zoom in to the left tail: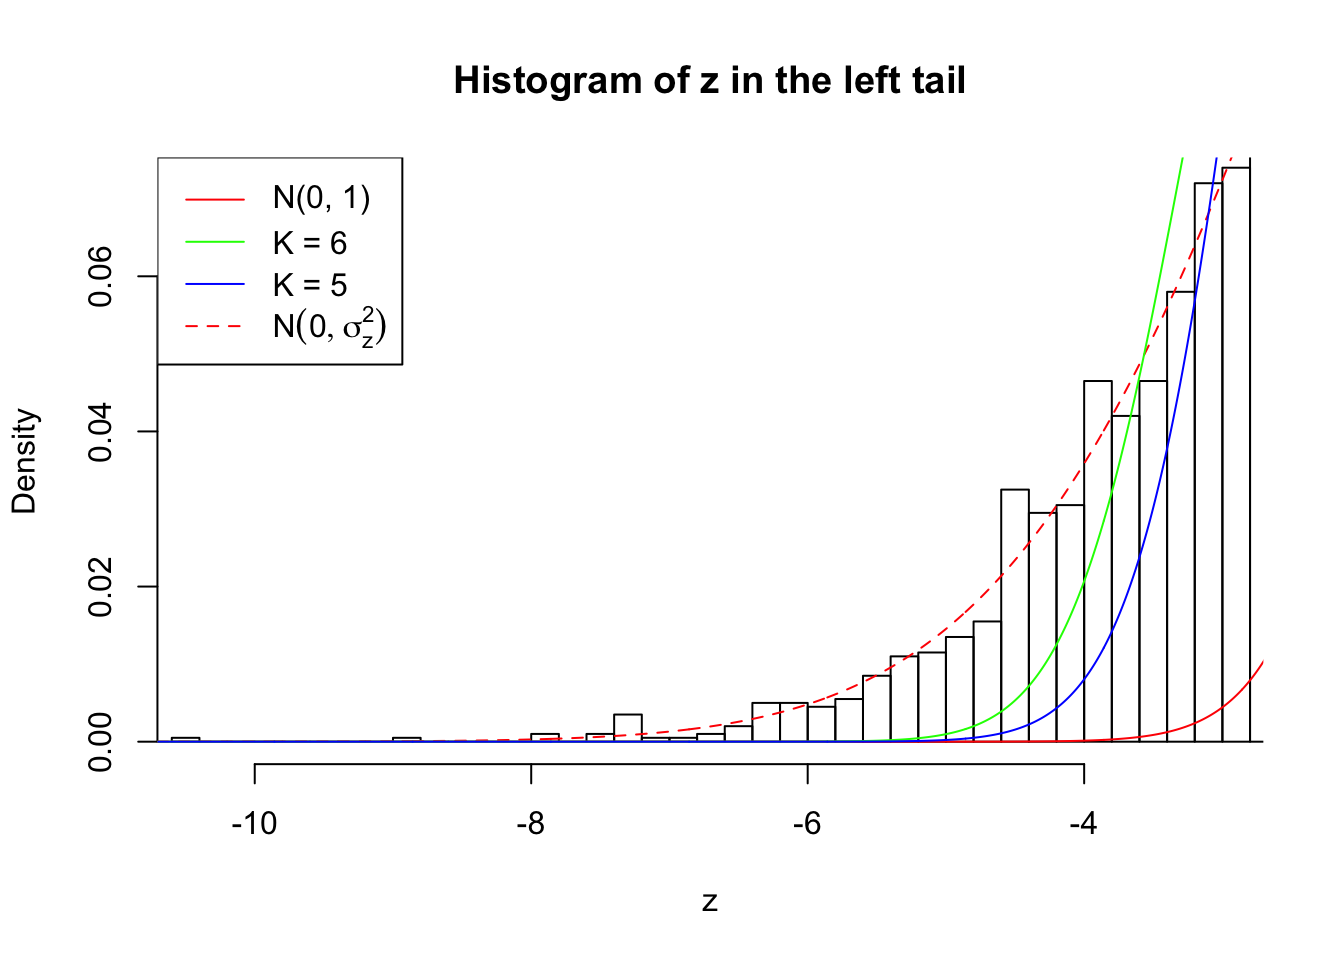
Zoom in to the right tail: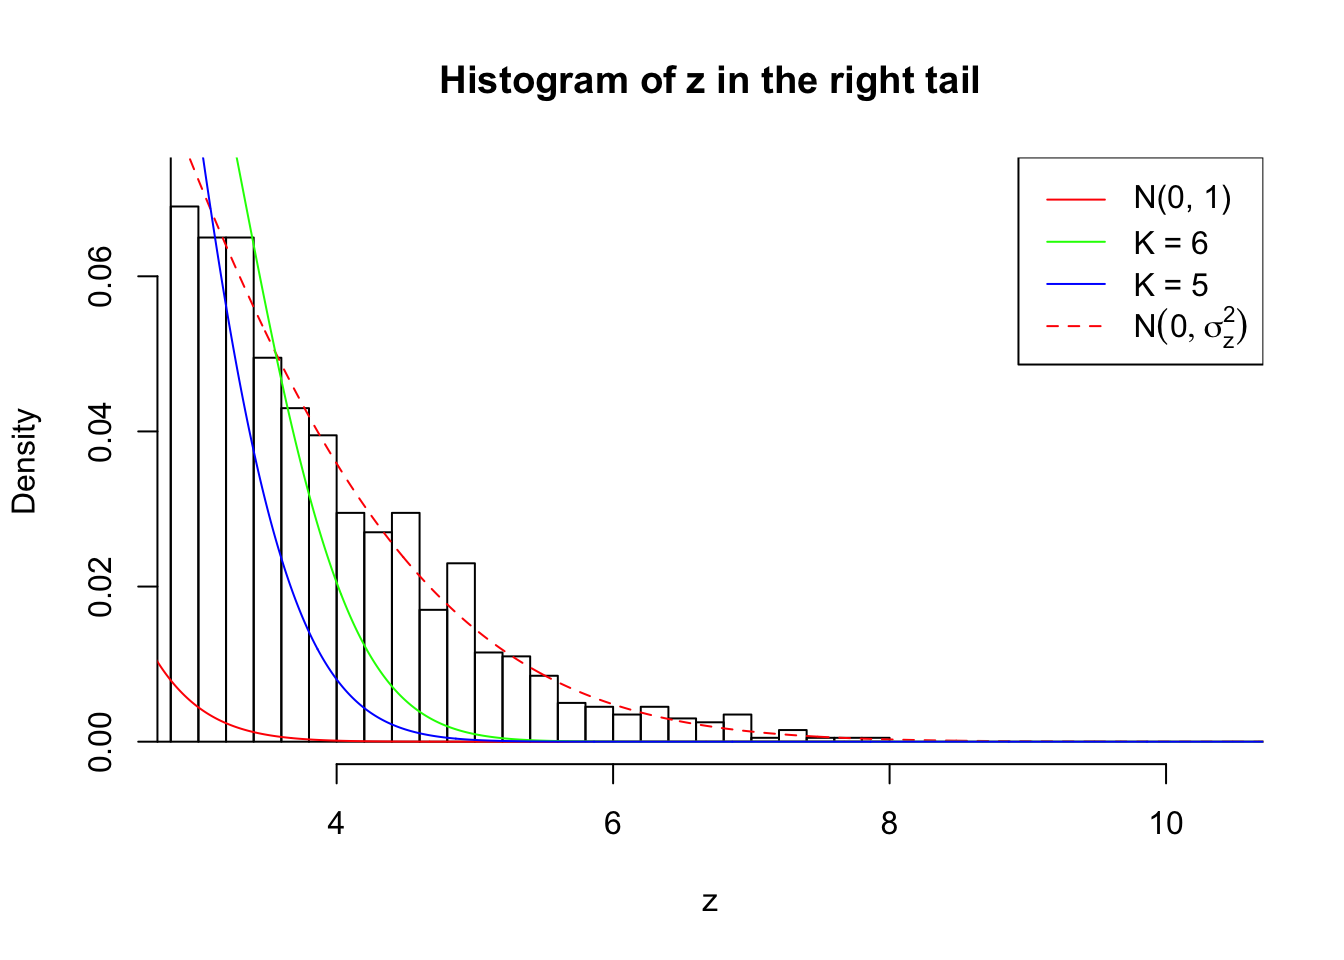
Example 4 :
SNR = 6 ;
True Distribution: N ( 0 , 4.981072 ) ;
Number of Discoveries: 2611 ;
pihat0 = 0.1362864 ;
Log-likelihood by True Distribution N ( 0, 4.981072 ) : -22094.39 ;
Log-likelihood by Gaussian Derivatives with K = 5 : -24651.41 ;
Log-likelihood Ratio between True Distribution N ( 0, 4.981072 ) and Fitted Gaussian Derivatives with K = 5 : 2557.016 ;
Normalized Weights of Gaussian Derivatives with K = 5 :
1 : 0.0207456250918557 ; 2 : 1.64776347409511 ; 3 : 0.0408372151048951 ; 4 : 1.23516153632877 ; 5 : -0.00209962997563955 ;
Log-likelihood by Gaussian Derivatives with K = 4 : -24654.08 ;
Log-likelihood Ratio between True Distribution N ( 0, 4.981072 ) and Fitted Gaussian Derivatives with K = 4 : 2559.692 ;
Normalized Weights of Gaussian Derivatives with K = 4 :
1 : 0.0211027886566392 ; 2 : 1.64814189178002 ; 3 : 0.0425671978787183 ; 4 : 1.2356285923639 ; 

Zoom in to the left tail: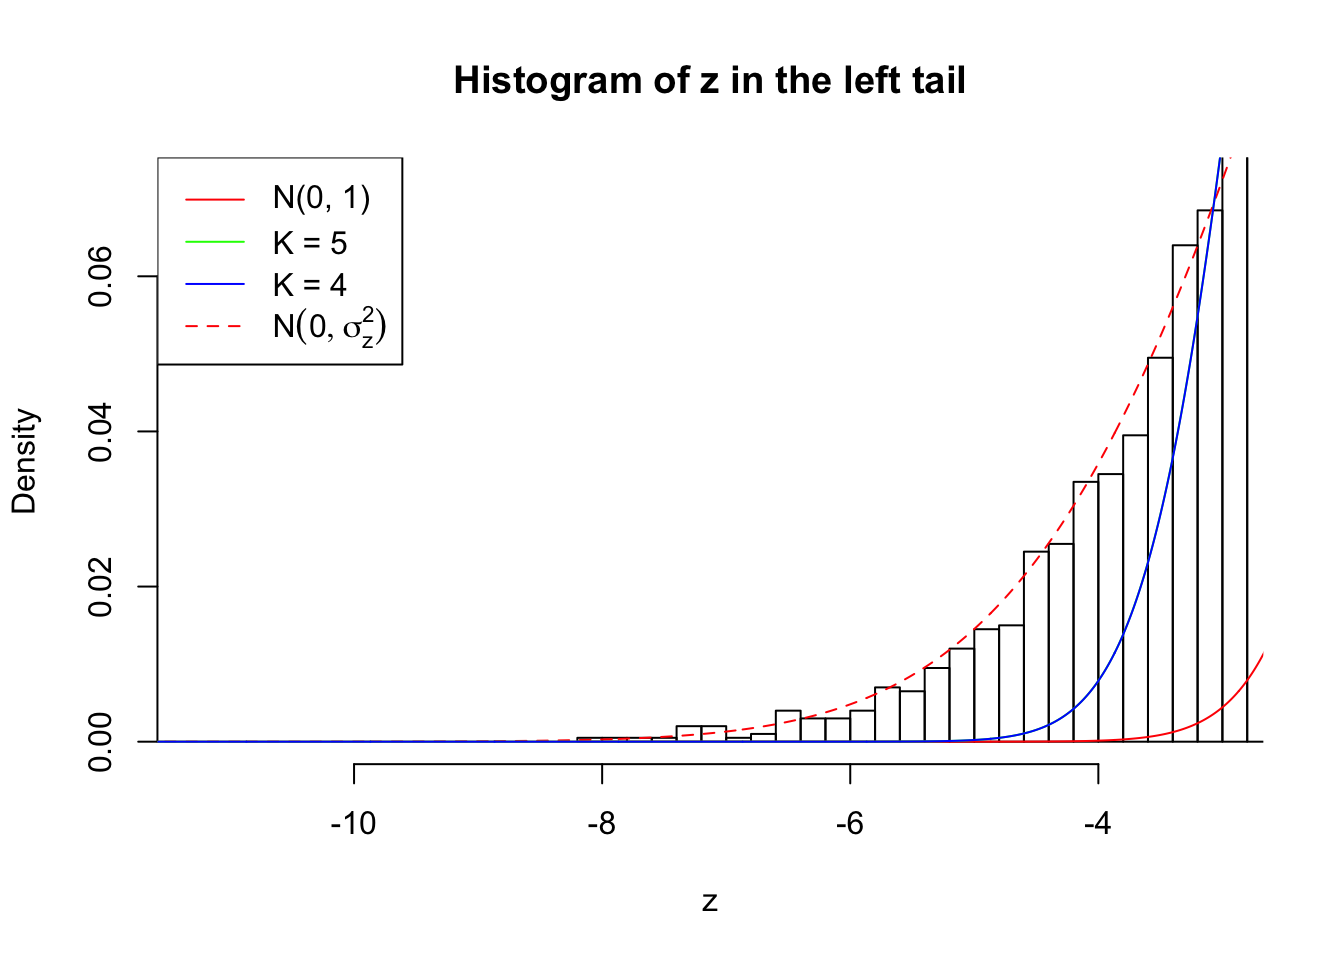
Zoom in to the right tail: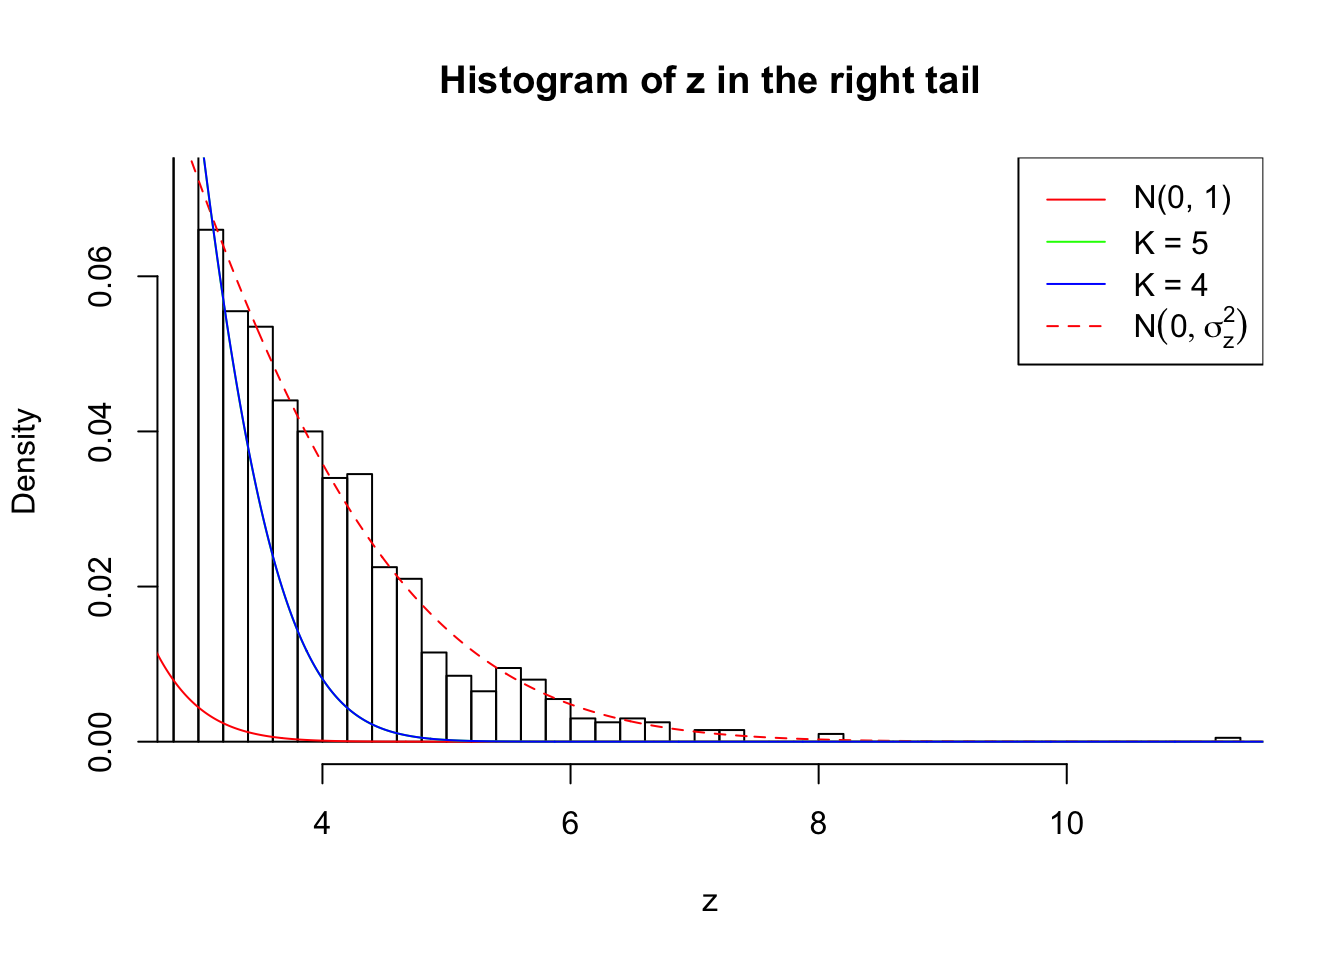
Example 5 :
SNR = 6 ;
True Distribution: N ( 0 , 4.981072 ) ;
Number of Discoveries: 2649 ;
pihat0 = 0.1092557 ;
Log-likelihood by True Distribution N ( 0, 4.981072 ) : -22215.9 ;
Log-likelihood by Gaussian Derivatives with K = 6 : -23754.87 ;
Log-likelihood Ratio between True Distribution N ( 0, 4.981072 ) and Fitted Gaussian Derivatives with K = 6 : 1538.97 ;
Normalized Weights of Gaussian Derivatives with K = 6 :
1 : 0.0116366532166927 ; 2 : 2.06025482639985 ; 3 : -0.011516485335873 ; 4 : 2.79783722718127 ; 5 : -0.0163523967952556 ; 6 : 1.58041329223154 ;
Log-likelihood by Gaussian Derivatives with K = 5 : -25071.74 ;
Log-likelihood Ratio between True Distribution N ( 0, 4.981072 ) and Fitted Gaussian Derivatives with K = 5 : 2855.842 ;
Normalized Weights of Gaussian Derivatives with K = 5 :
1 : 0.0167193129430813 ; 2 : 1.65088940488345 ; 3 : 0.0112739770964507 ; 4 : 1.23275554575975 ; 5 : 0.000220131488046469 ; 


Zoom in to the left tail: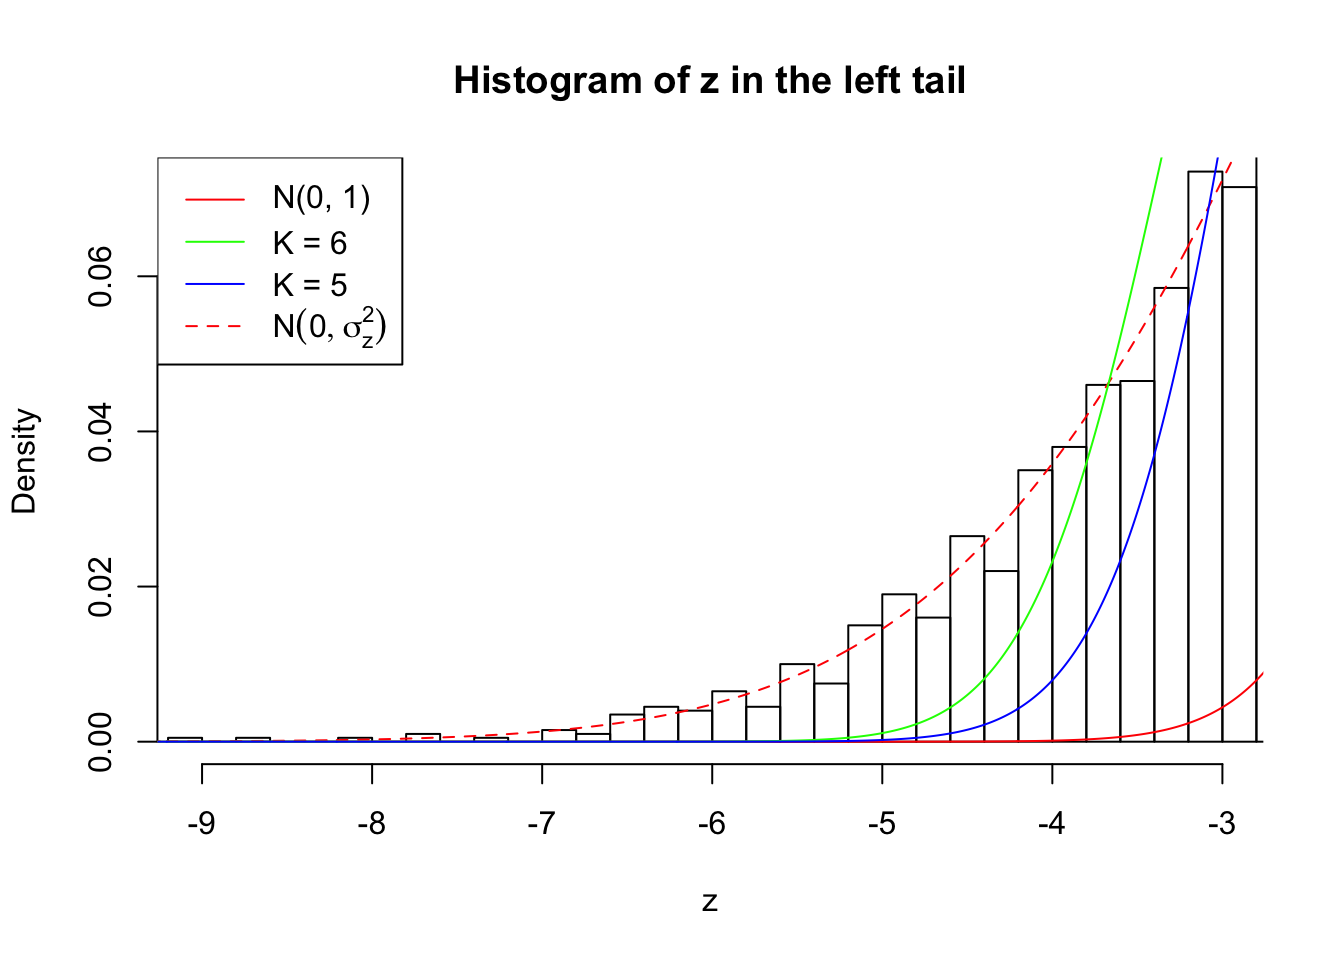
Zoom in to the right tail: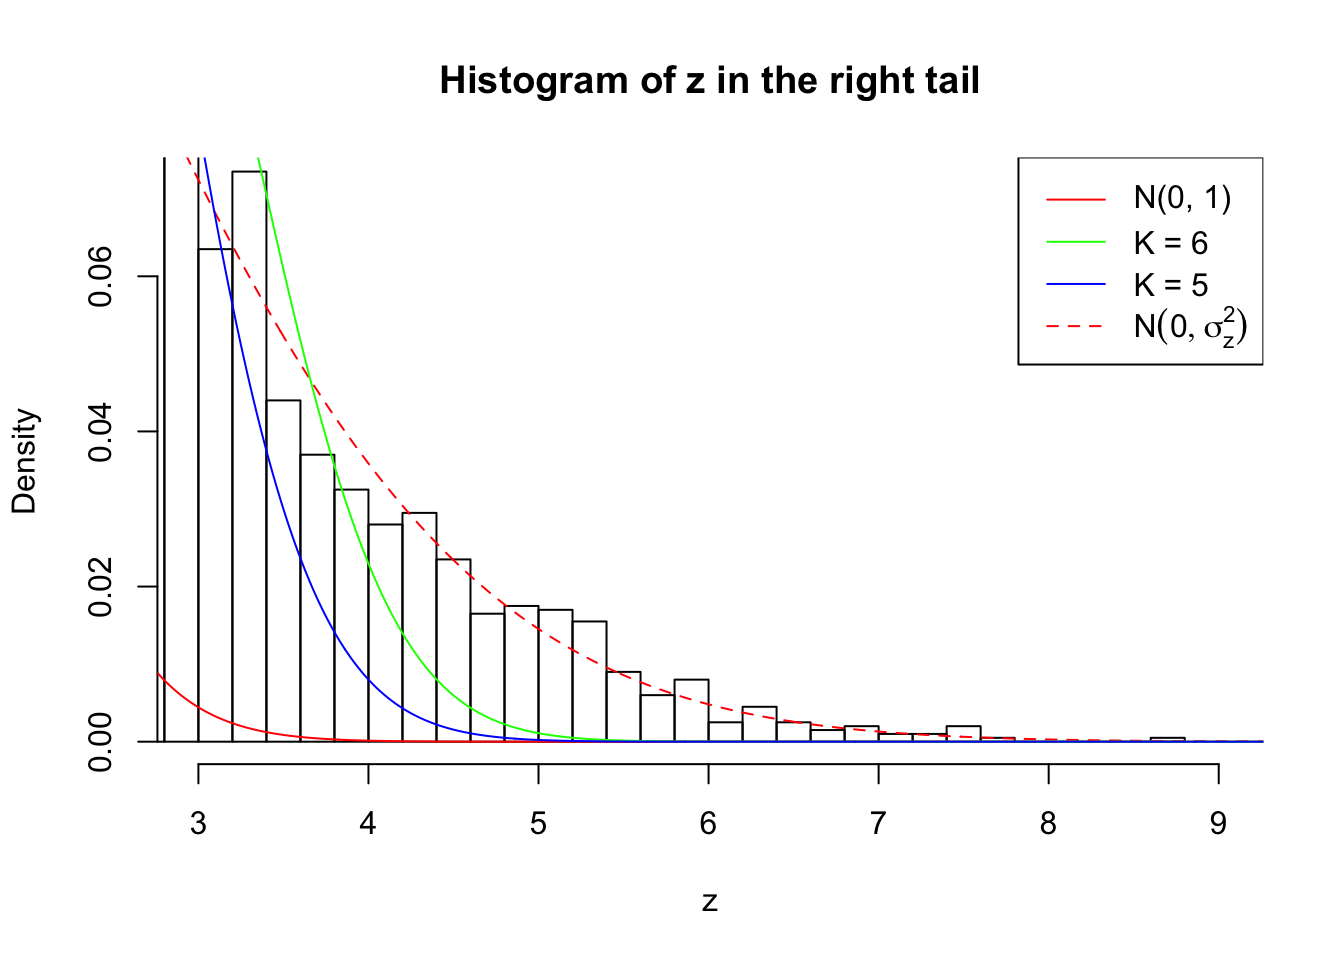
## SNR = 7 ; sigma_z = 2.451912 ; True Distribution: N ( 0 , 6.011872 ) .
Example 1 :
SNR = 7 ;
True Distribution: N ( 0 , 6.011872 ) ;
Number of Discoveries: 3288 ;
pihat0 = 0.08928676 ;
Log-likelihood by True Distribution N ( 0, 6.011872 ) : -23260.7 ;
Log-likelihood by Gaussian Derivatives with K = 6 : -26298.95 ;
Log-likelihood Ratio between True Distribution N ( 0, 6.011872 ) and Fitted Gaussian Derivatives with K = 6 : 3038.251 ;
Normalized Weights of Gaussian Derivatives with K = 6 :
1 : -0.0183005878150952 ; 2 : 2.34484205485819 ; 3 : -0.0298238324987321 ; 4 : 3.36367097754695 ; 5 : -0.0263635043049669 ; 6 : 1.95573111007512 ;
Log-likelihood by Gaussian Derivatives with K = 5 : -28345.43 ;
Log-likelihood Ratio between True Distribution N ( 0, 6.011872 ) and Fitted Gaussian Derivatives with K = 5 : 5084.722 ;
Normalized Weights of Gaussian Derivatives with K = 5 :
1 : -0.0207339186941601 ; 2 : 1.82651582430218 ; 3 : -0.0233716676525867 ; 4 : 1.40075833244072 ; 5 : -0.016455641490395 ; 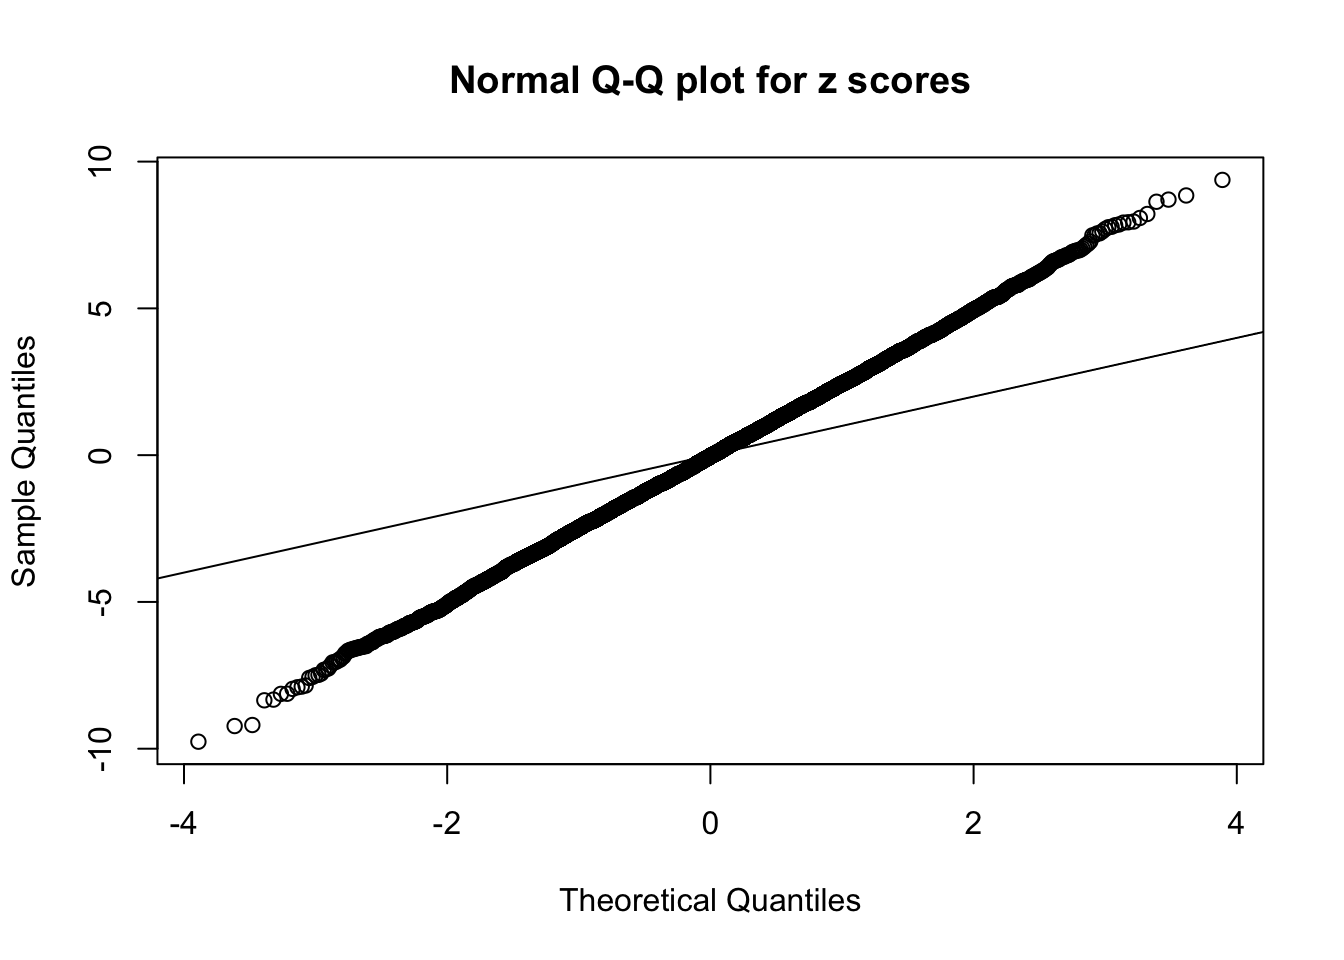

Zoom in to the left tail: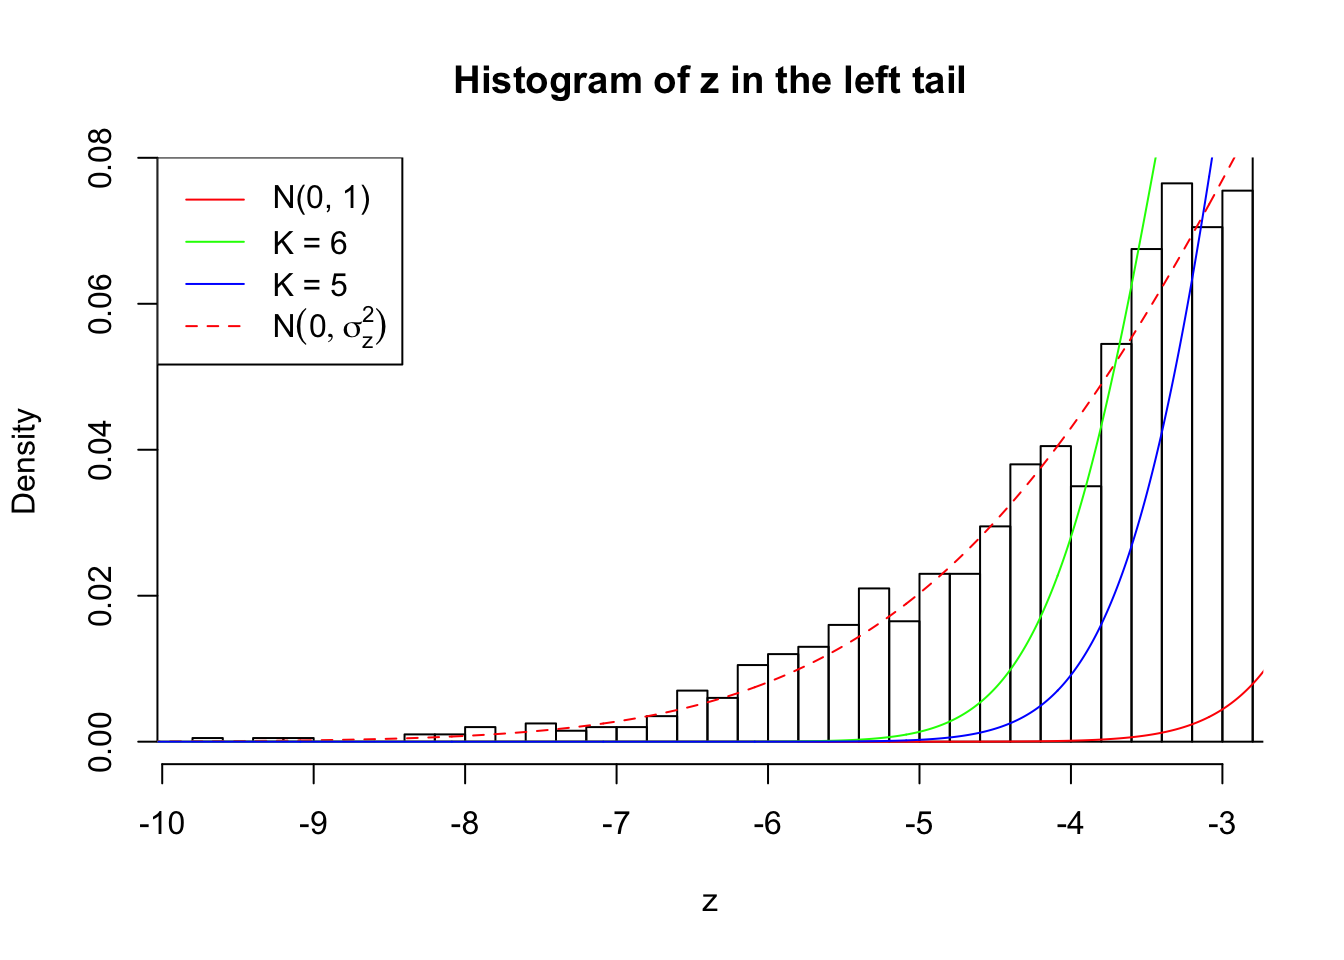
Zoom in to the right tail: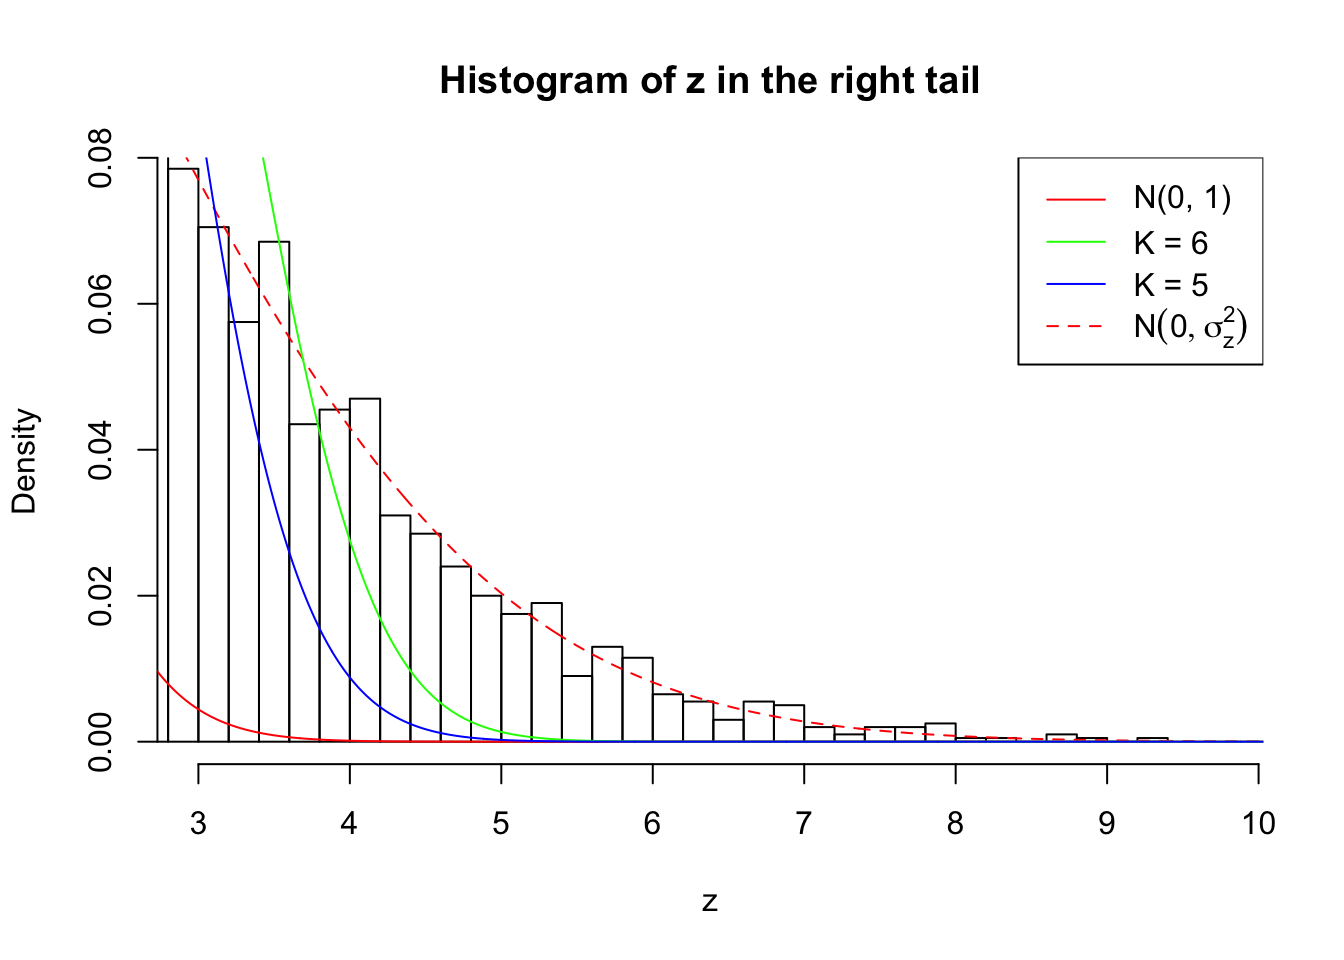
Example 2 :
SNR = 7 ;
True Distribution: N ( 0 , 6.011872 ) ;
Number of Discoveries: 3333 ;
pihat0 = 0.09588348 ;
Log-likelihood by True Distribution N ( 0, 6.011872 ) : -23213.25 ;
Log-likelihood by Gaussian Derivatives with K = 6 : -25965.71 ;
Log-likelihood Ratio between True Distribution N ( 0, 6.011872 ) and Fitted Gaussian Derivatives with K = 6 : 2752.465 ;
Normalized Weights of Gaussian Derivatives with K = 6 :
1 : -0.0157497749468068 ; 2 : 2.29522111448563 ; 3 : -0.0504594888083231 ; 4 : 3.2716206983689 ; 5 : -0.0434371740666126 ; 6 : 1.88971138582365 ;
Log-likelihood by Gaussian Derivatives with K = 5 : -28063.64 ;
Log-likelihood Ratio between True Distribution N ( 0, 6.011872 ) and Fitted Gaussian Derivatives with K = 5 : 4850.391 ;
Normalized Weights of Gaussian Derivatives with K = 5 :
1 : -0.00125856771424838 ; 2 : 1.82848294685367 ; 3 : -0.00862514412274113 ; 4 : 1.41531531673069 ; 5 : -0.0113003931850965 ; 


Zoom in to the left tail: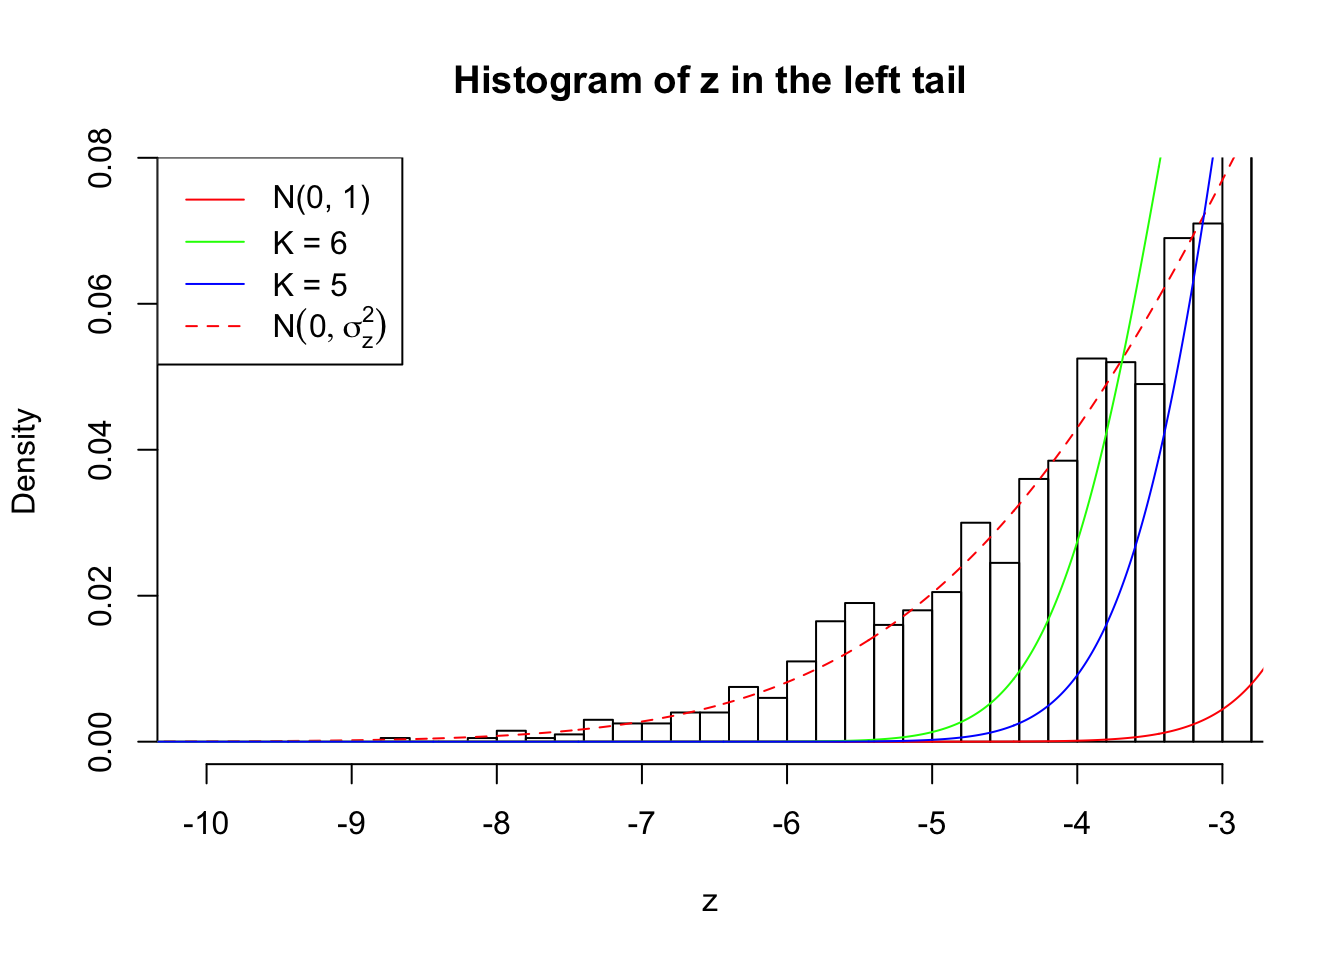
Zoom in to the right tail: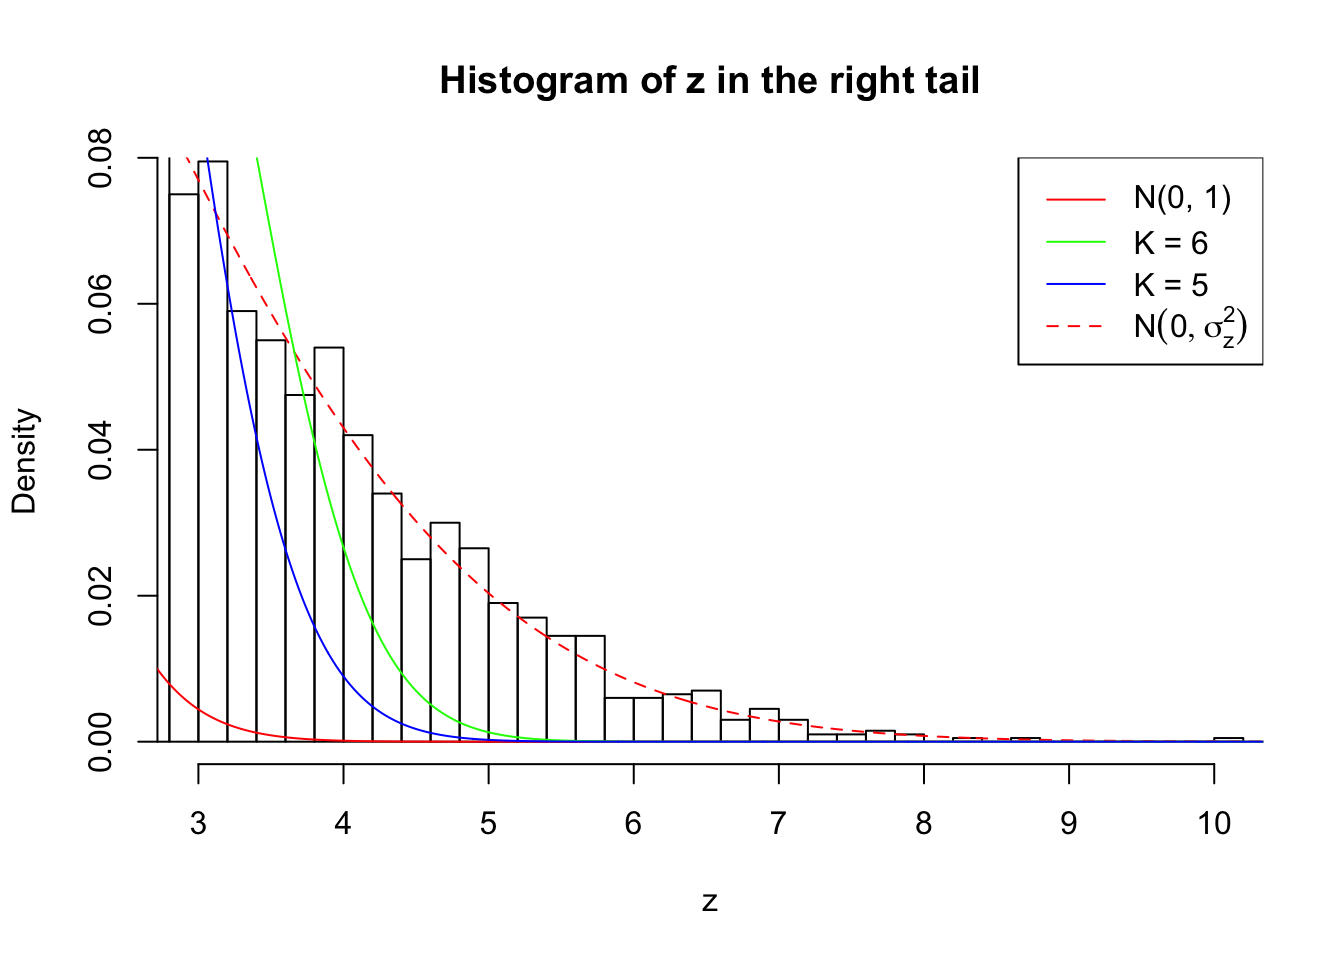
Example 3 :
SNR = 7 ;
True Distribution: N ( 0 , 6.011872 ) ;
Number of Discoveries: 3176 ;
pihat0 = 0.1297791 ;
Log-likelihood by True Distribution N ( 0, 6.011872 ) : -23073.36 ;
Log-likelihood by Gaussian Derivatives with K = 6 : -25730.54 ;
Log-likelihood Ratio between True Distribution N ( 0, 6.011872 ) and Fitted Gaussian Derivatives with K = 6 : 2657.185 ;
Normalized Weights of Gaussian Derivatives with K = 6 :
1 : 0.00547516103293227 ; 2 : 2.24562303322161 ; 3 : 0.0493165965305574 ; 4 : 3.16335068855266 ; 5 : 0.0400002165361984 ; 6 : 1.7738638592201 ;
Log-likelihood by Gaussian Derivatives with K = 5 : -27667.42 ;
Log-likelihood Ratio between True Distribution N ( 0, 6.011872 ) and Fitted Gaussian Derivatives with K = 5 : 4594.065 ;
Normalized Weights of Gaussian Derivatives with K = 5 :
1 : -0.00781400536548428 ; 2 : 1.78824512444825 ; 3 : 0.0305422935251163 ; 4 : 1.41139215177903 ; 5 : 0.0299925365790375 ; 


Zoom in to the left tail: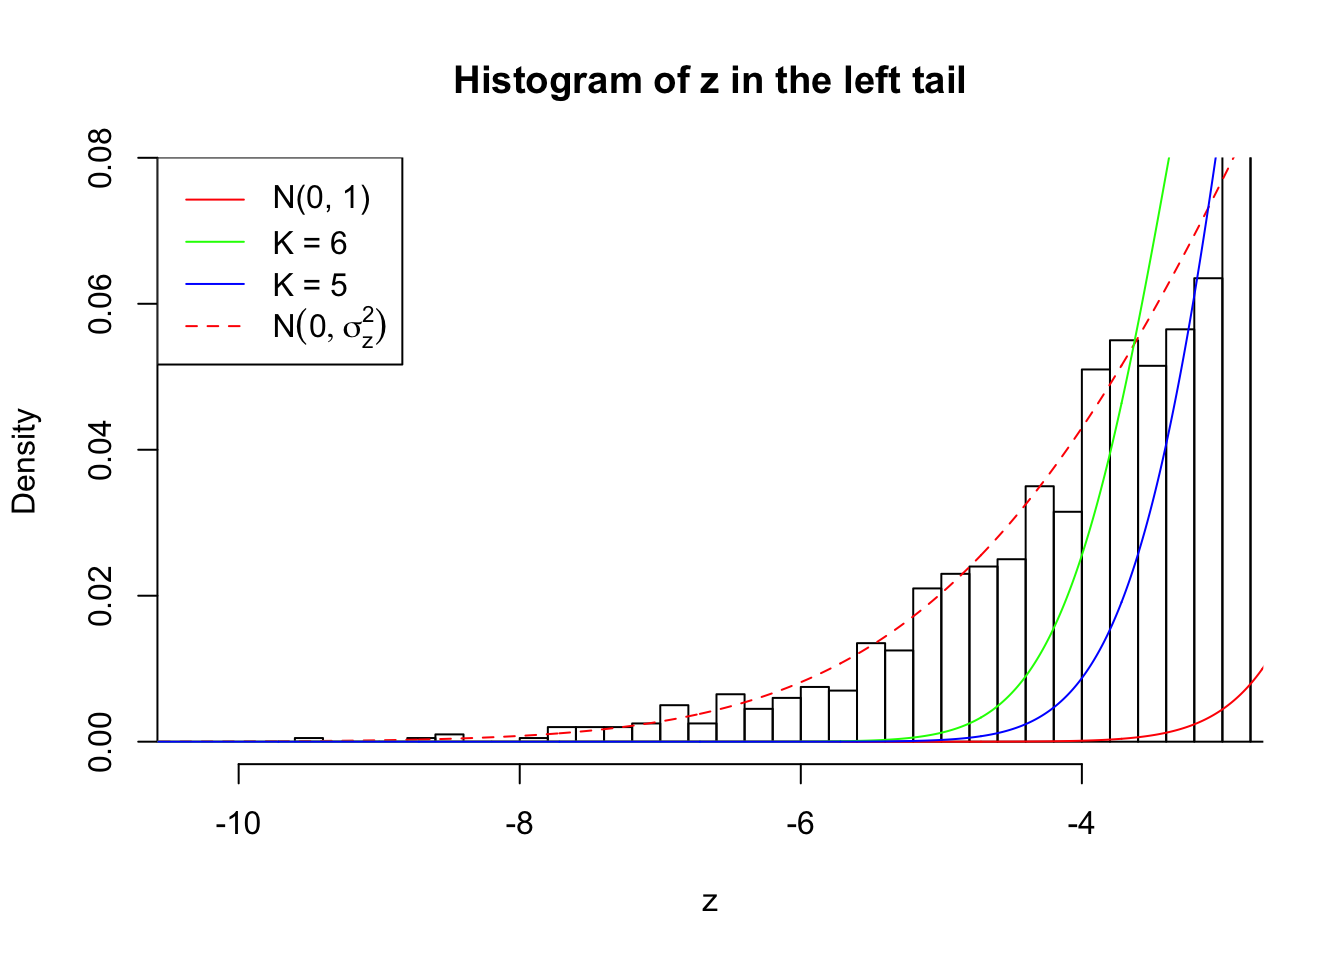
Zoom in to the right tail: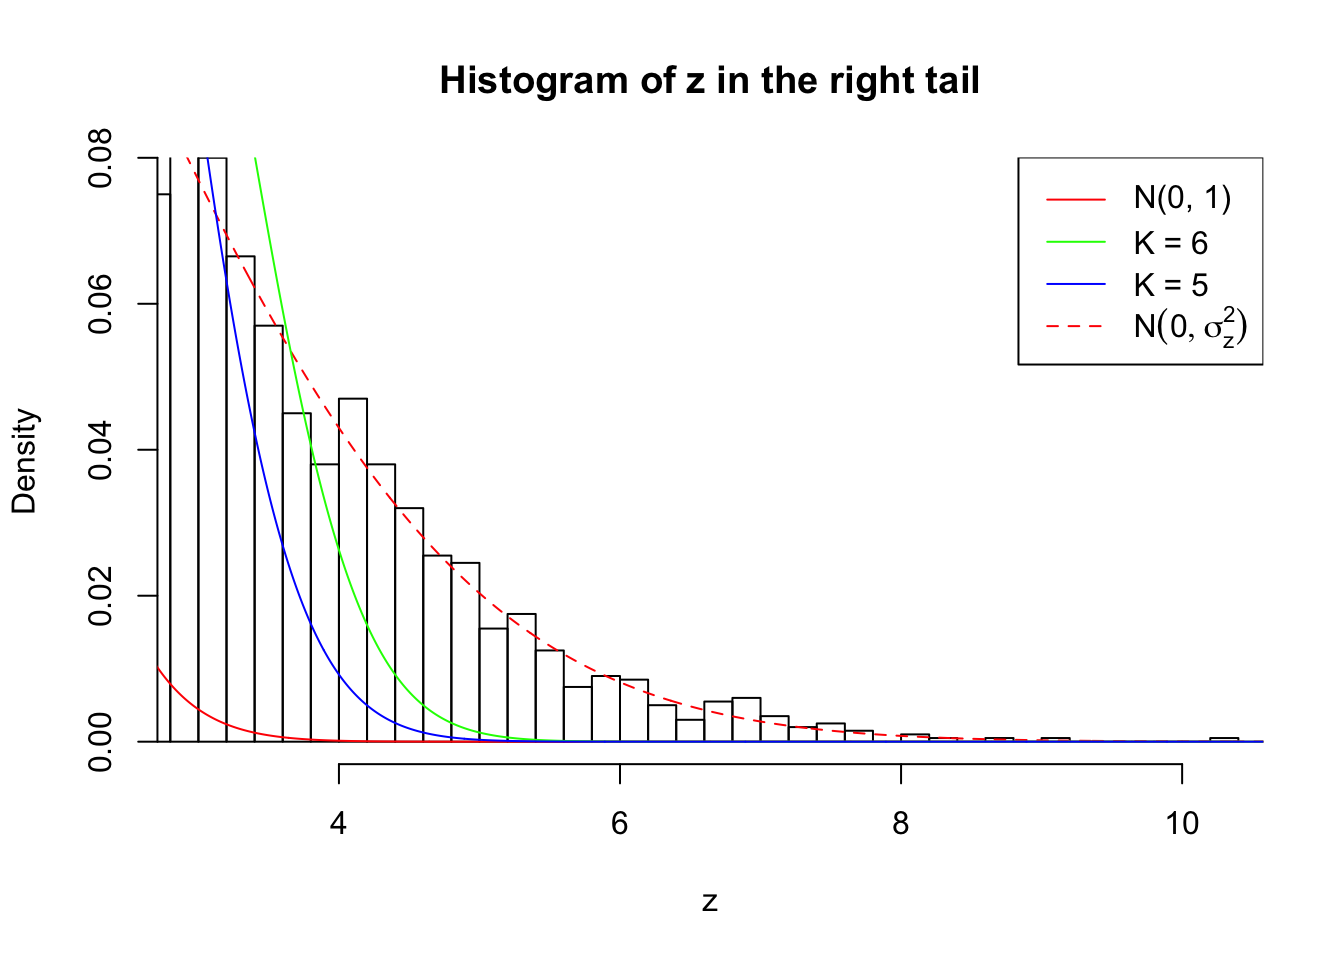
Example 4 :
SNR = 7 ;
True Distribution: N ( 0 , 6.011872 ) ;
Number of Discoveries: 3194 ;
pihat0 = 0.1000719 ;
Log-likelihood by True Distribution N ( 0, 6.011872 ) : -23103.79 ;
Log-likelihood by Gaussian Derivatives with K = 6 : -25884.9 ;
Log-likelihood Ratio between True Distribution N ( 0, 6.011872 ) and Fitted Gaussian Derivatives with K = 6 : 2781.118 ;
Normalized Weights of Gaussian Derivatives with K = 6 :
1 : 0.019831930425411 ; 2 : 2.28723915997433 ; 3 : 0.0334406444701634 ; 4 : 3.25360120421447 ; 5 : 0.0113572300675825 ; 6 : 1.87558158578094 ;
Log-likelihood by Gaussian Derivatives with K = 5 : -27793.23 ;
Log-likelihood Ratio between True Distribution N ( 0, 6.011872 ) and Fitted Gaussian Derivatives with K = 5 : 4689.439 ;
Normalized Weights of Gaussian Derivatives with K = 5 :
1 : 0.021214778576848 ; 2 : 1.80481775316164 ; 3 : 0.0330643574613194 ; 4 : 1.38231477760038 ; 5 : 0.00396533588188546 ; 


Zoom in to the left tail: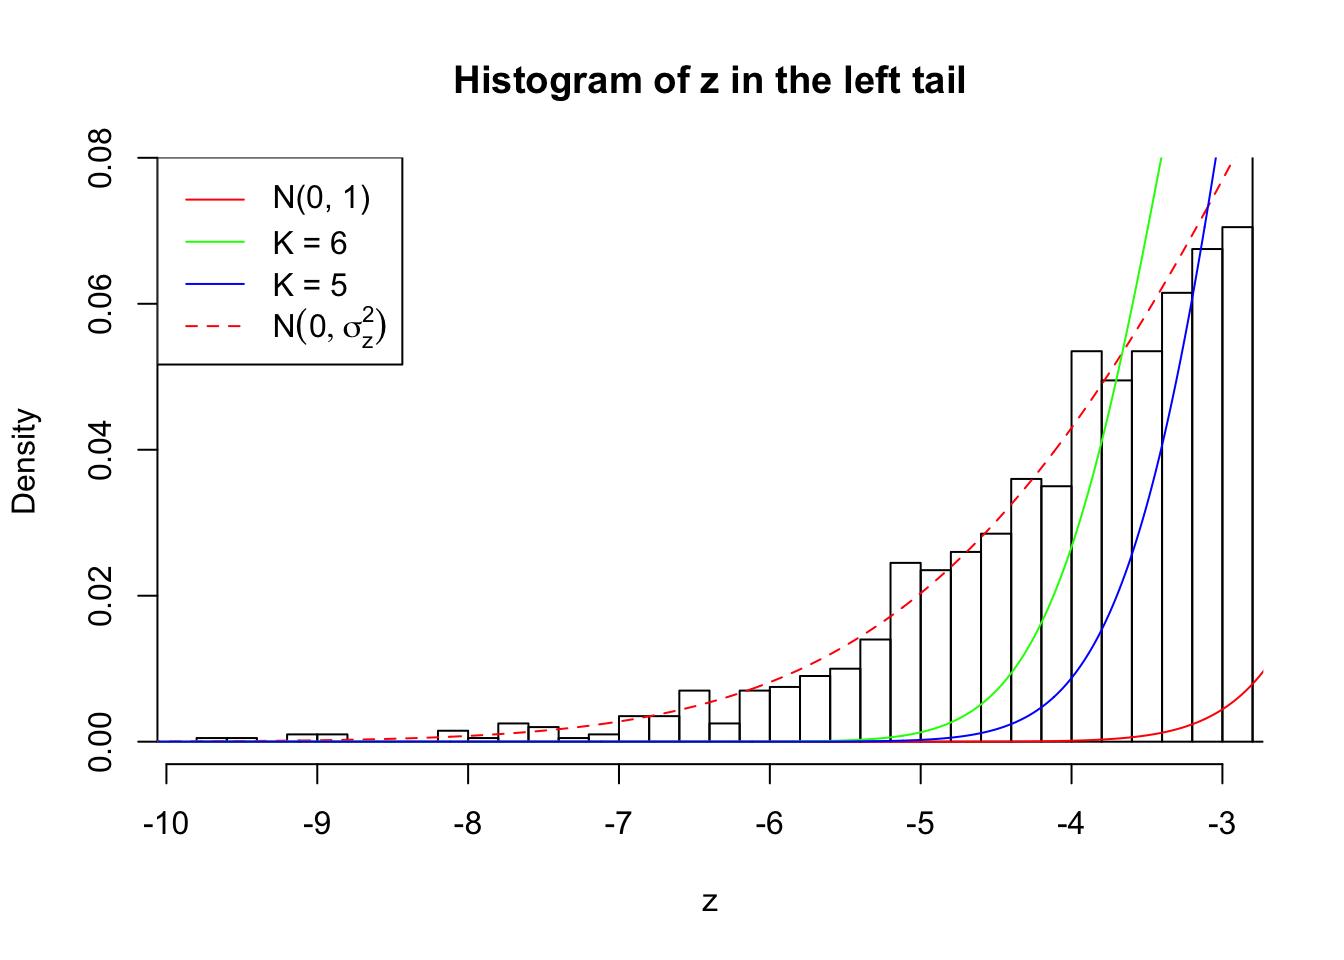
Zoom in to the right tail: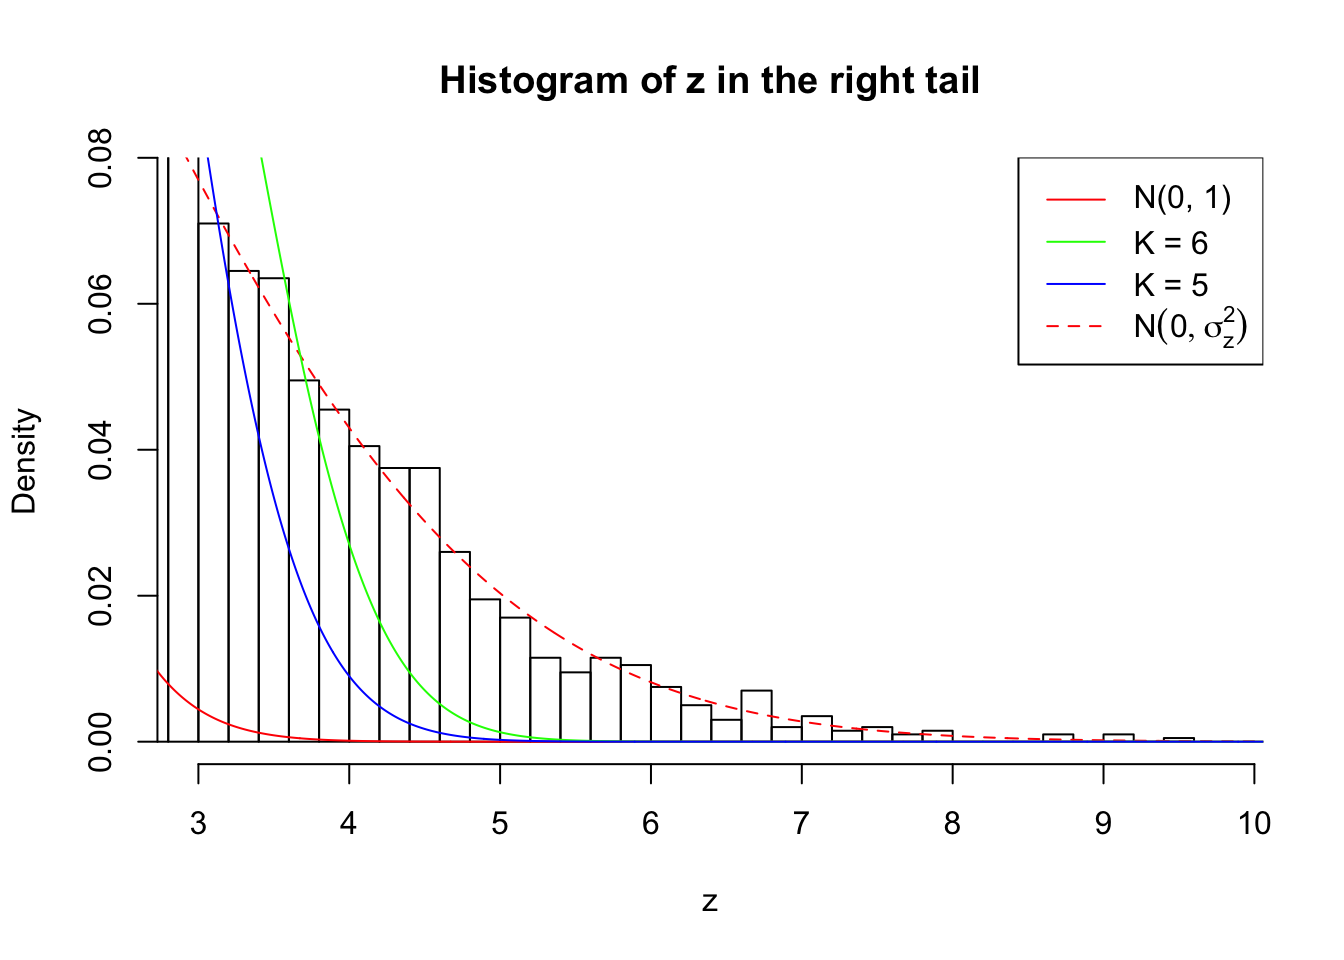
Example 5 :
SNR = 7 ;
True Distribution: N ( 0 , 6.011872 ) ;
Number of Discoveries: 3235 ;
pihat0 = 0.1134862 ;
Log-likelihood by True Distribution N ( 0, 6.011872 ) : -23044.41 ;
Log-likelihood by Gaussian Derivatives with K = 6 : -25484.16 ;
Log-likelihood Ratio between True Distribution N ( 0, 6.011872 ) and Fitted Gaussian Derivatives with K = 6 : 2439.756 ;
Normalized Weights of Gaussian Derivatives with K = 6 :
1 : 0.00715356253823022 ; 2 : 2.27436645331824 ; 3 : 0.00105952221137104 ; 4 : 3.20013131956896 ; 5 : 0.00118057804423982 ; 6 : 1.78681955956309 ;
Log-likelihood by Gaussian Derivatives with K = 5 : -27372.31 ;
Log-likelihood Ratio between True Distribution N ( 0, 6.011872 ) and Fitted Gaussian Derivatives with K = 5 : 4327.9 ;
Normalized Weights of Gaussian Derivatives with K = 5 :
1 : 0.0105083874094317 ; 2 : 1.8119786043687 ; 3 : 0.0202691225905926 ; 4 : 1.41690219054158 ; 5 : 0.0194692182232266 ; 

Zoom in to the left tail: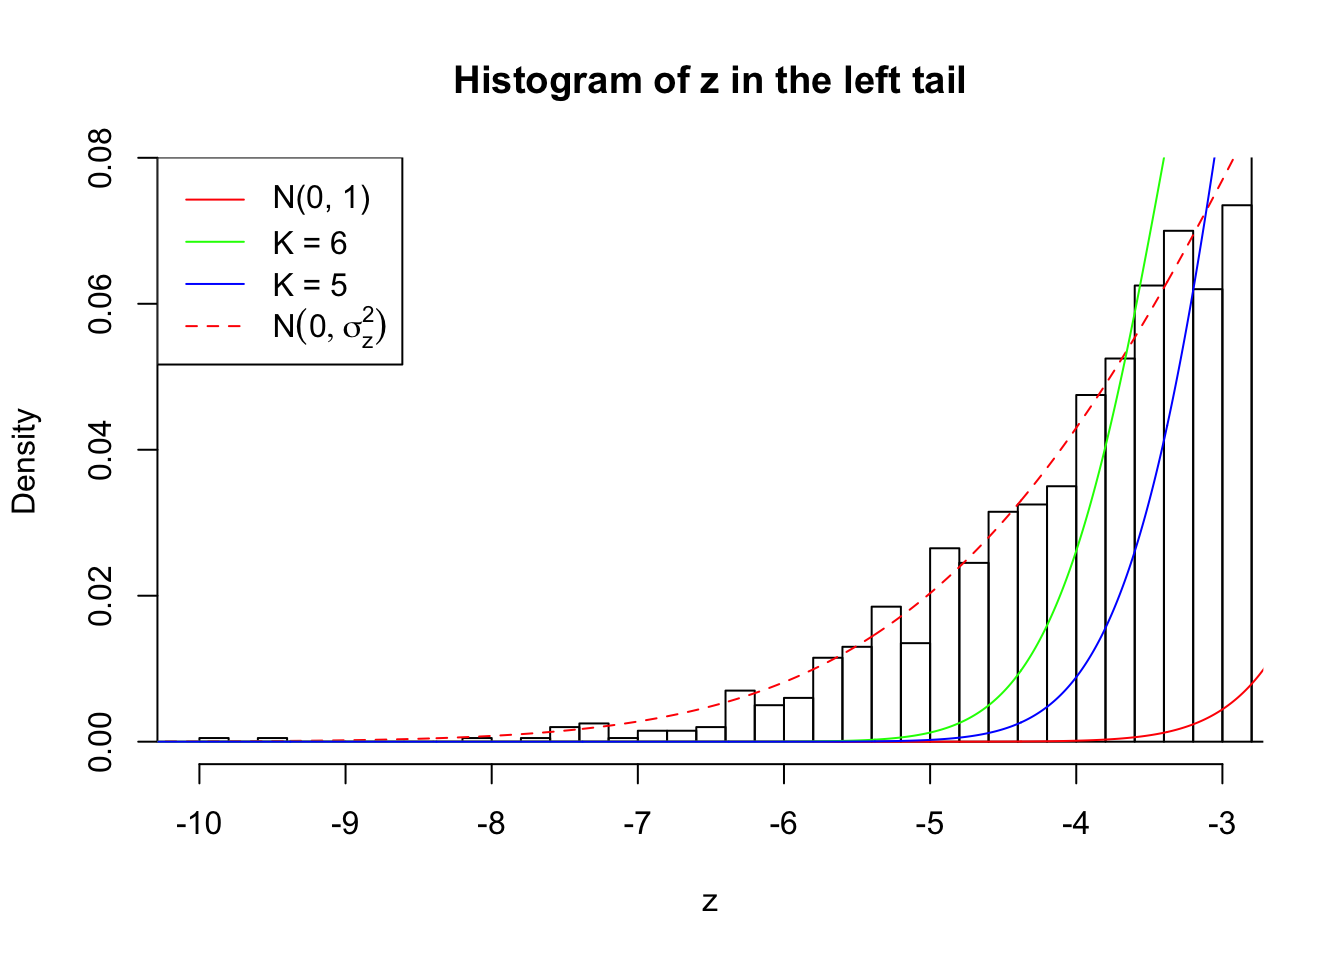
Zoom in to the right tail: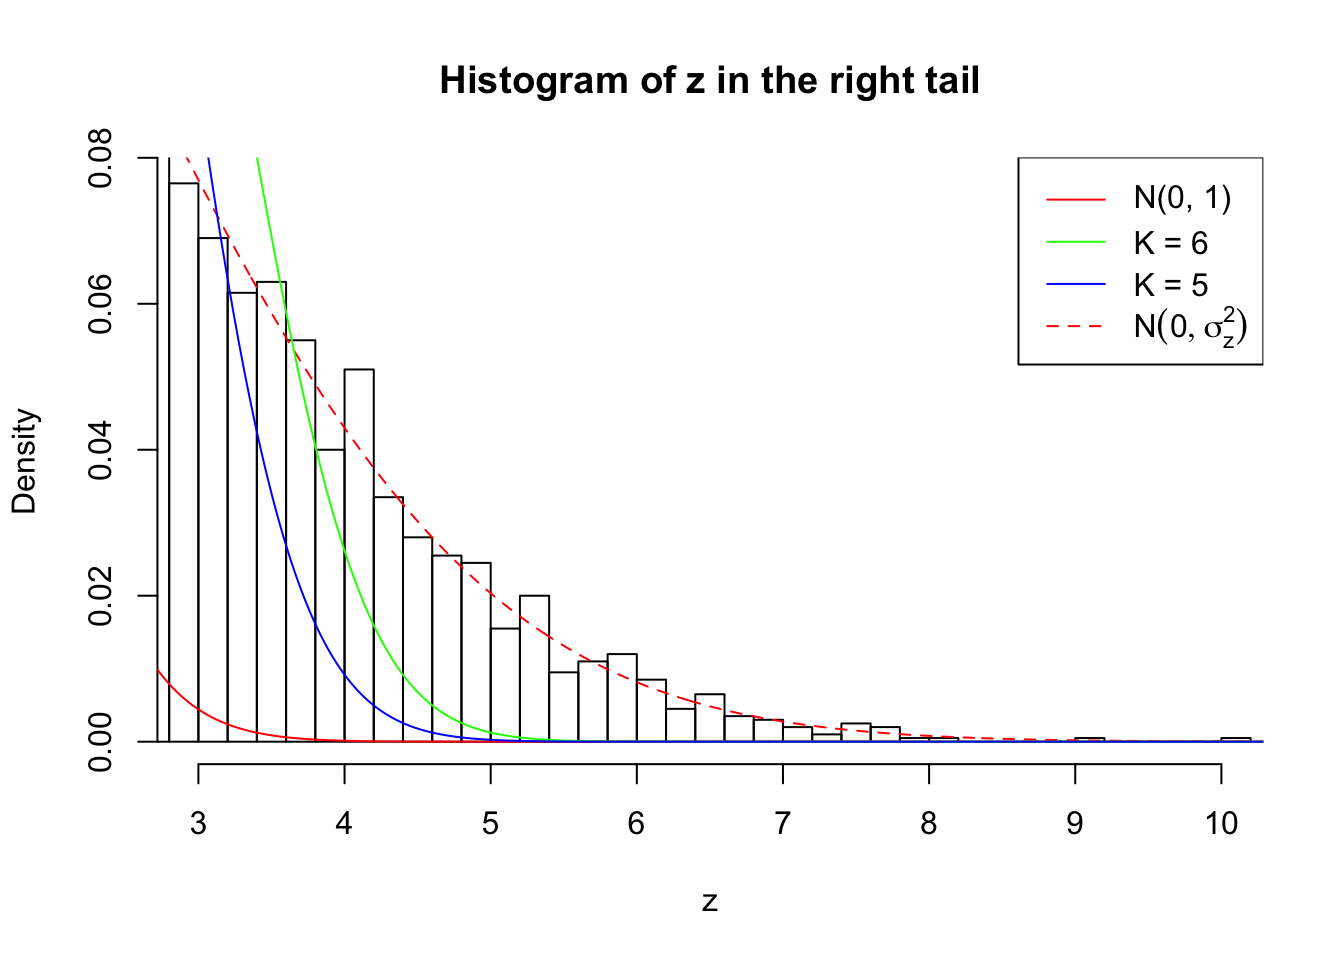
## SNR = 8 ; sigma_z = 2.703622 ; True Distribution: N ( 0 , 7.309573 ) .
Example 1 :
SNR = 8 ;
True Distribution: N ( 0 , 7.309573 ) ;
Number of Discoveries: 3768 ;
pihat0 = 0.07033265 ;
Log-likelihood by True Distribution N ( 0, 7.309573 ) : -24083.99 ;
Log-likelihood by Gaussian Derivatives with K = 6 : -28842.7 ;
Log-likelihood Ratio between True Distribution N ( 0, 7.309573 ) and Fitted Gaussian Derivatives with K = 6 : 4758.717 ;
Normalized Weights of Gaussian Derivatives with K = 6 :
1 : -0.000677264290150885 ; 2 : 2.53874231778277 ; 3 : -0.00561937268793838 ; 4 : 3.72454384154009 ; 5 : 0.0210042933210722 ; 6 : 2.16093057958714 ;
Log-likelihood by Gaussian Derivatives with K = 5 : -31542.48 ;
Log-likelihood Ratio between True Distribution N ( 0, 7.309573 ) and Fitted Gaussian Derivatives with K = 5 : 7458.492 ;
Normalized Weights of Gaussian Derivatives with K = 5 :
1 : -0.00719984954595982 ; 2 : 1.97534018546734 ; 3 : -0.0159195281654859 ; 4 : 1.54212762351448 ; 5 : 0.0134058274996992 ; 

Zoom in to the left tail: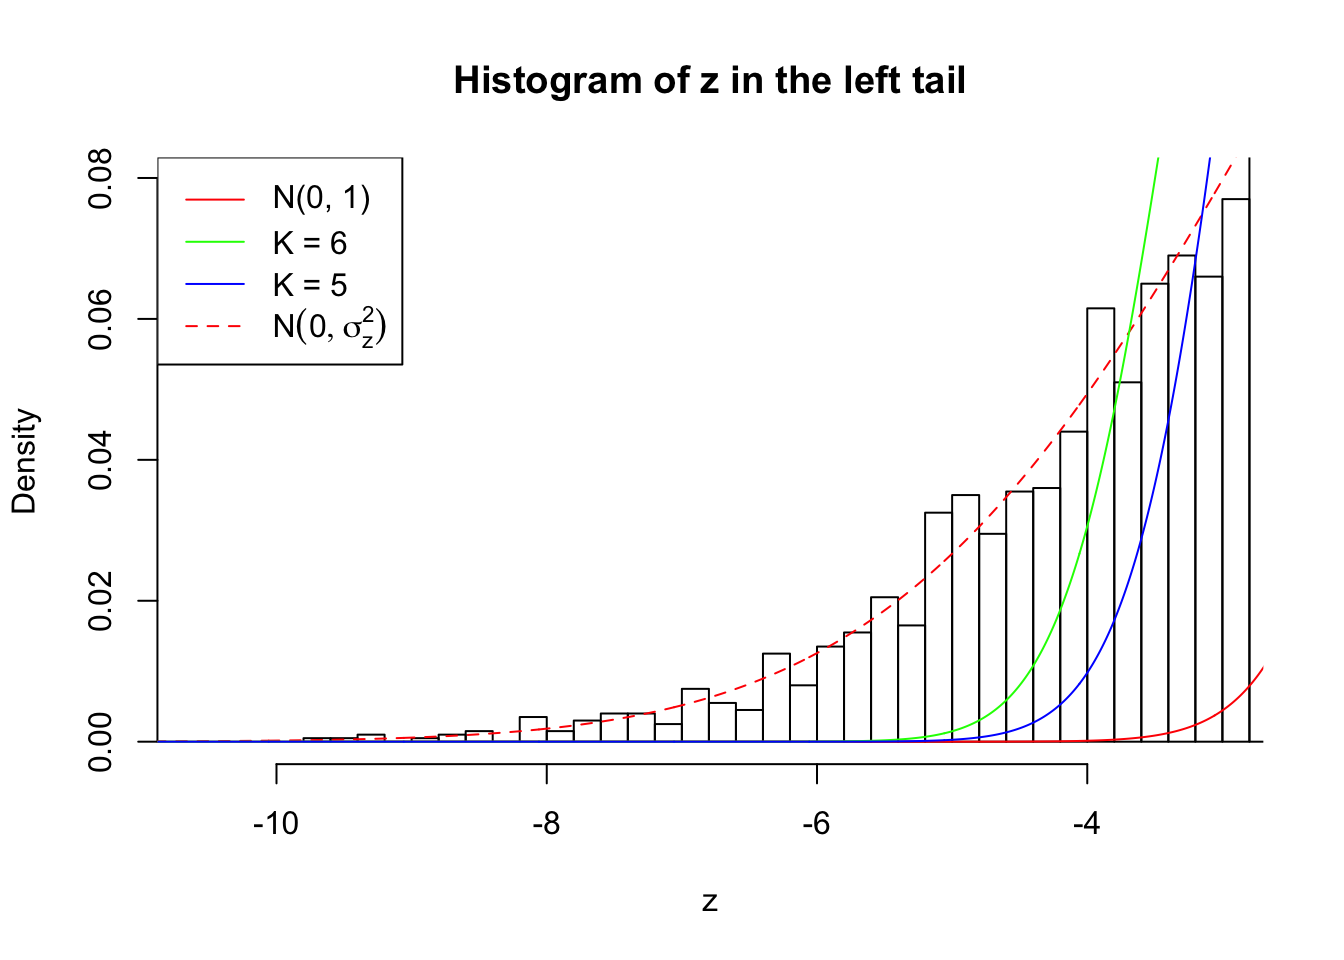
Zoom in to the right tail: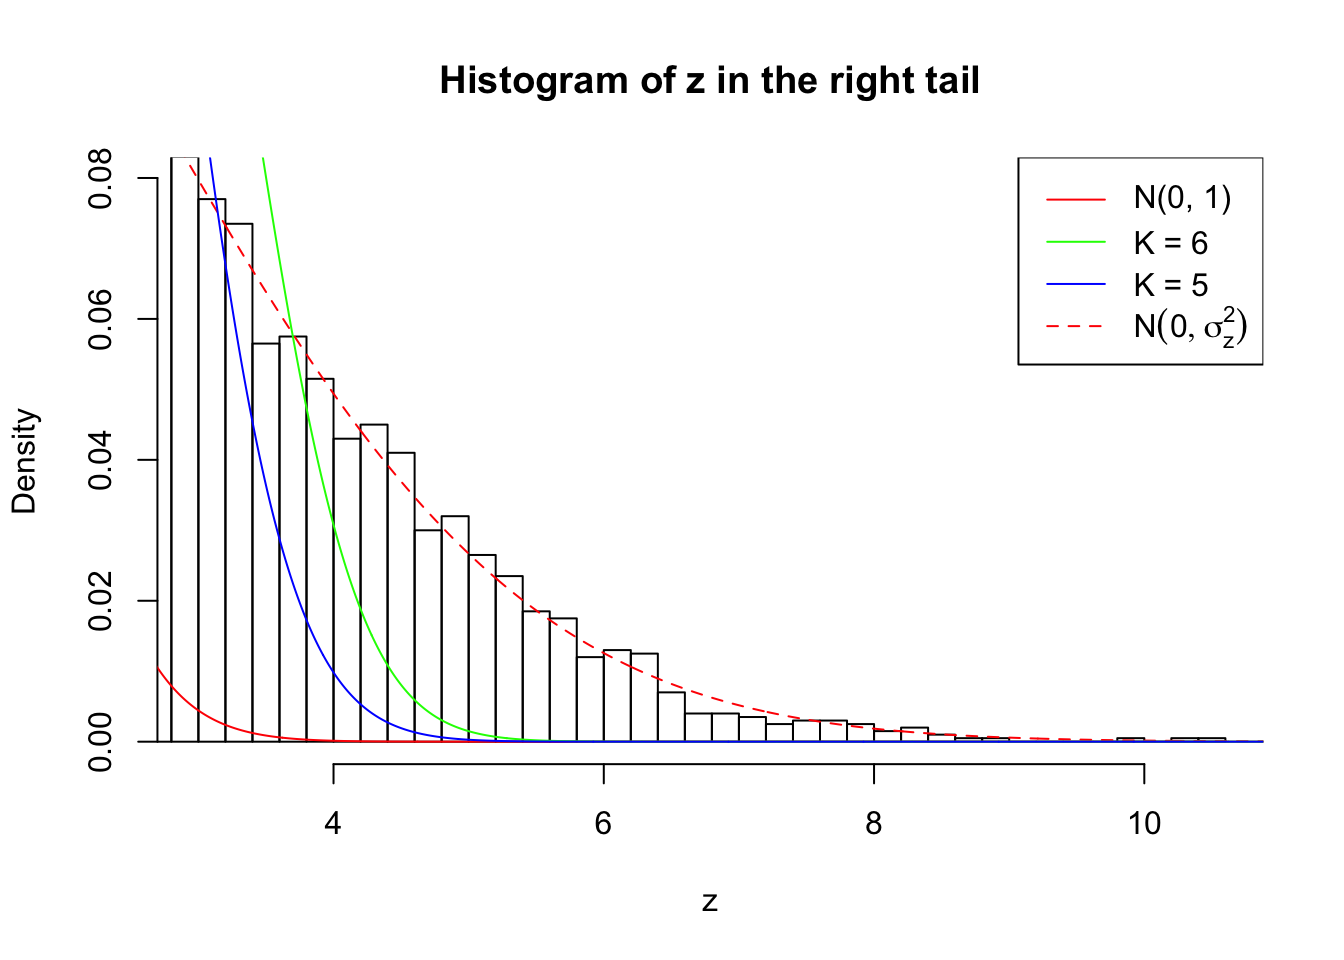
Example 2 :
SNR = 8 ;
True Distribution: N ( 0 , 7.309573 ) ;
Number of Discoveries: 3950 ;
pihat0 = 0.08759456 ;
Log-likelihood by True Distribution N ( 0, 7.309573 ) : -24216.05 ;
Log-likelihood by Gaussian Derivatives with K = 6 : -29100.75 ;
Log-likelihood Ratio between True Distribution N ( 0, 7.309573 ) and Fitted Gaussian Derivatives with K = 6 : 4884.702 ;
Normalized Weights of Gaussian Derivatives with K = 6 :
1 : 0.00471661063579975 ; 2 : 2.52271547230107 ; 3 : -0.0328067689142773 ; 4 : 3.70553494414676 ; 5 : -0.0498341710748214 ; 6 : 2.15158211636193 ;
Log-likelihood by Gaussian Derivatives with K = 5 : -32137.13 ;
Log-likelihood Ratio between True Distribution N ( 0, 7.309573 ) and Fitted Gaussian Derivatives with K = 5 : 7921.075 ;
Normalized Weights of Gaussian Derivatives with K = 5 :
1 : 0.022164827818991 ; 2 : 1.97427468128317 ; 3 : 0.0092283343891227 ; 4 : 1.56649329906334 ; 5 : -0.0252294737613793 ; 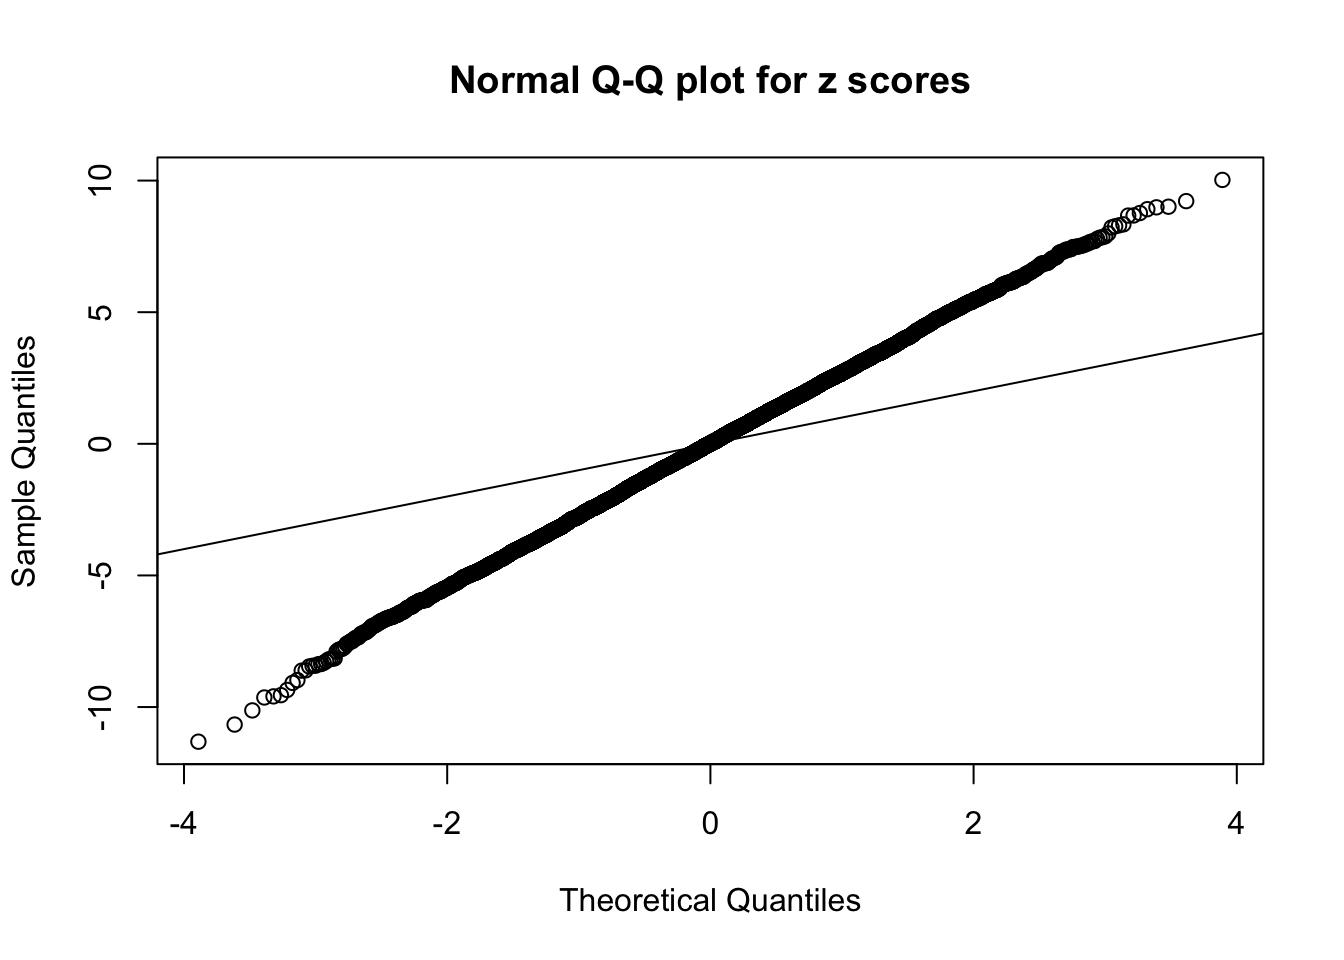

Zoom in to the left tail: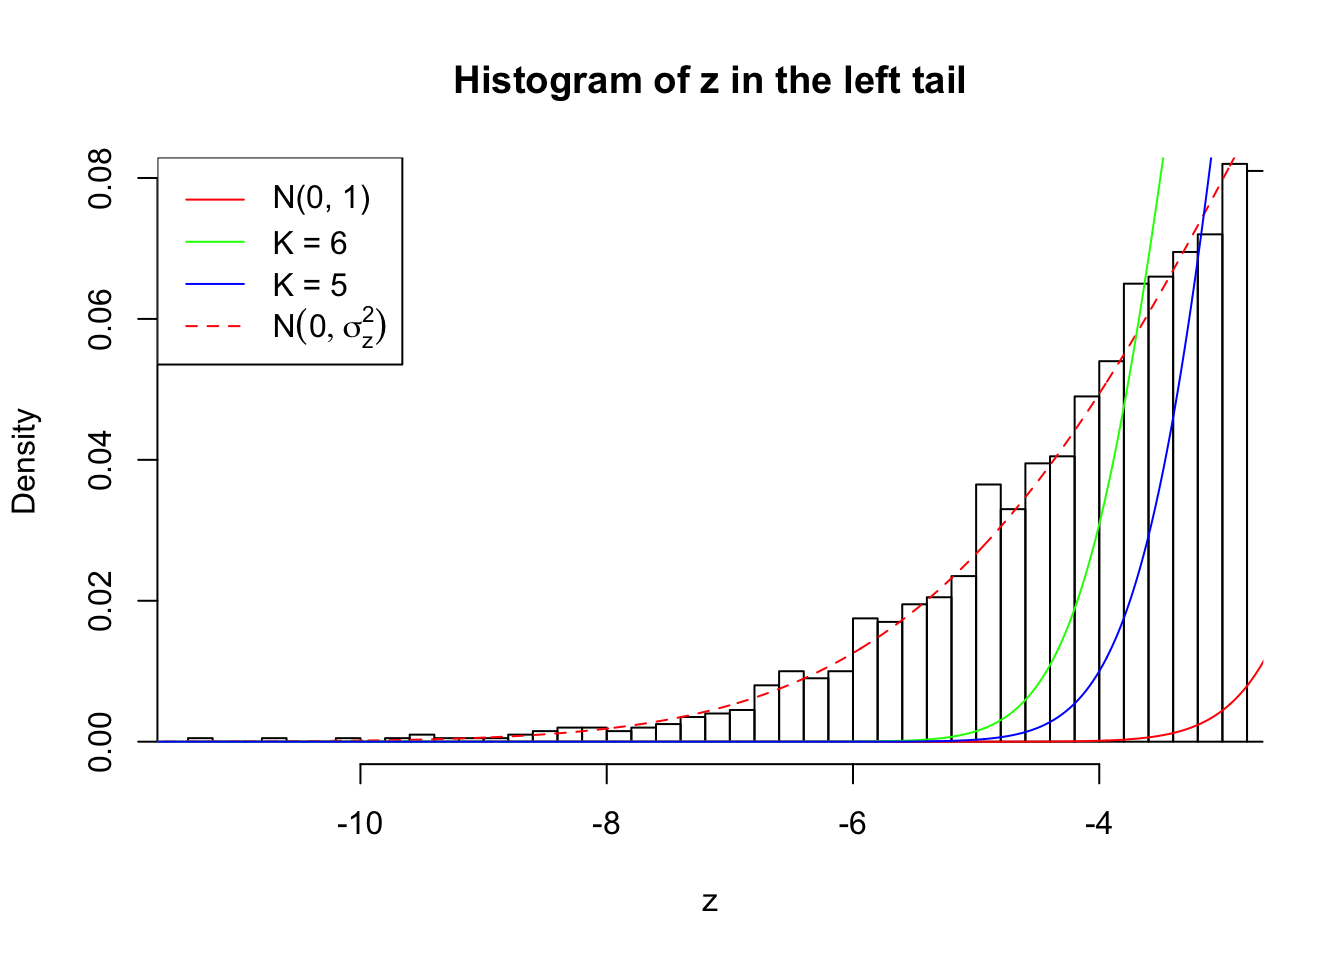
Zoom in to the right tail: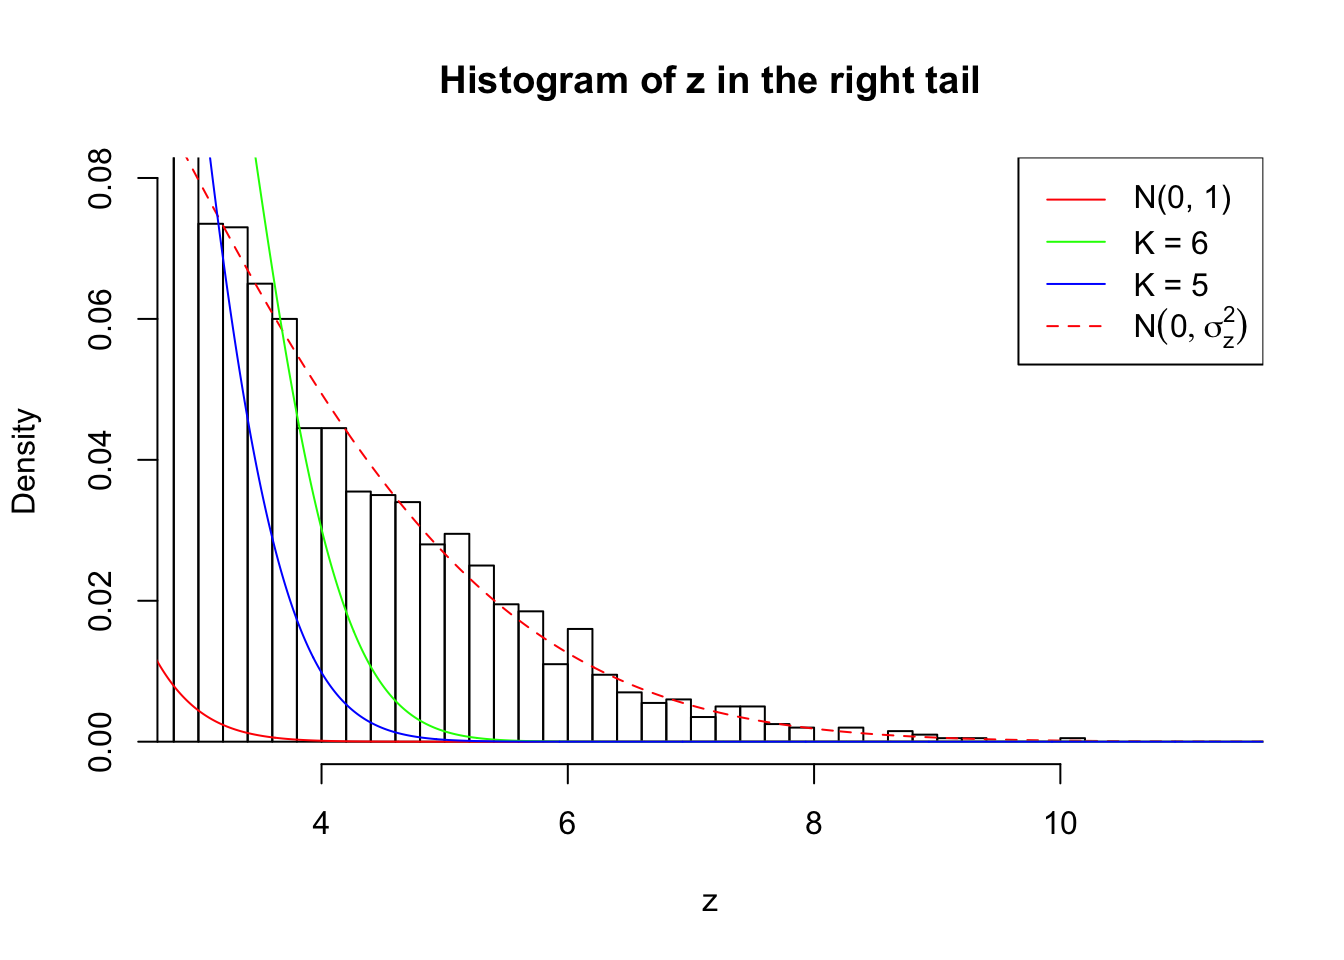
Example 3 :
SNR = 8 ;
True Distribution: N ( 0 , 7.309573 ) ;
Number of Discoveries: 3869 ;
pihat0 = 0.07653203 ;
Log-likelihood by True Distribution N ( 0, 7.309573 ) : -24190.71 ;
Log-likelihood by Gaussian Derivatives with K = 6 : -29333.05 ;
Log-likelihood Ratio between True Distribution N ( 0, 7.309573 ) and Fitted Gaussian Derivatives with K = 6 : 5142.335 ;
Normalized Weights of Gaussian Derivatives with K = 6 :
1 : -0.00362625059133025 ; 2 : 2.59051580056953 ; 3 : -0.0110301347352026 ; 4 : 3.85770452188801 ; 5 : -0.0325210274551719 ; 6 : 2.26162663690691 ;
Log-likelihood by Gaussian Derivatives with K = 5 : -32114.77 ;
Log-likelihood Ratio between True Distribution N ( 0, 7.309573 ) and Fitted Gaussian Derivatives with K = 5 : 7924.057 ;
Normalized Weights of Gaussian Derivatives with K = 5 :
1 : 0.00823123809677517 ; 2 : 1.97684485306676 ; 3 : 0.0108132563951897 ; 4 : 1.54891889152428 ; 5 : -0.0162193203234067 ; 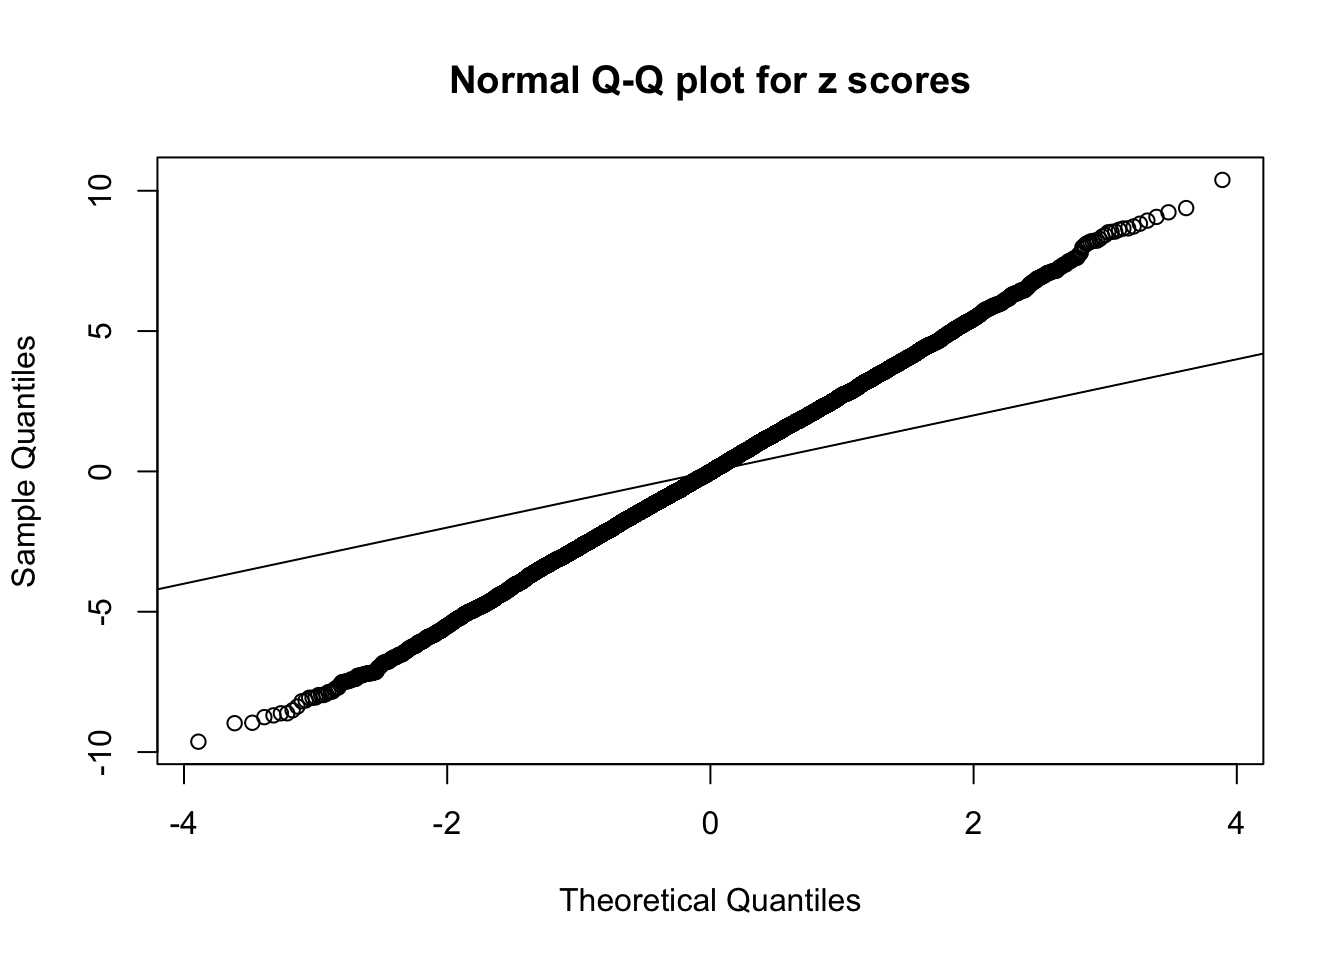


Zoom in to the left tail: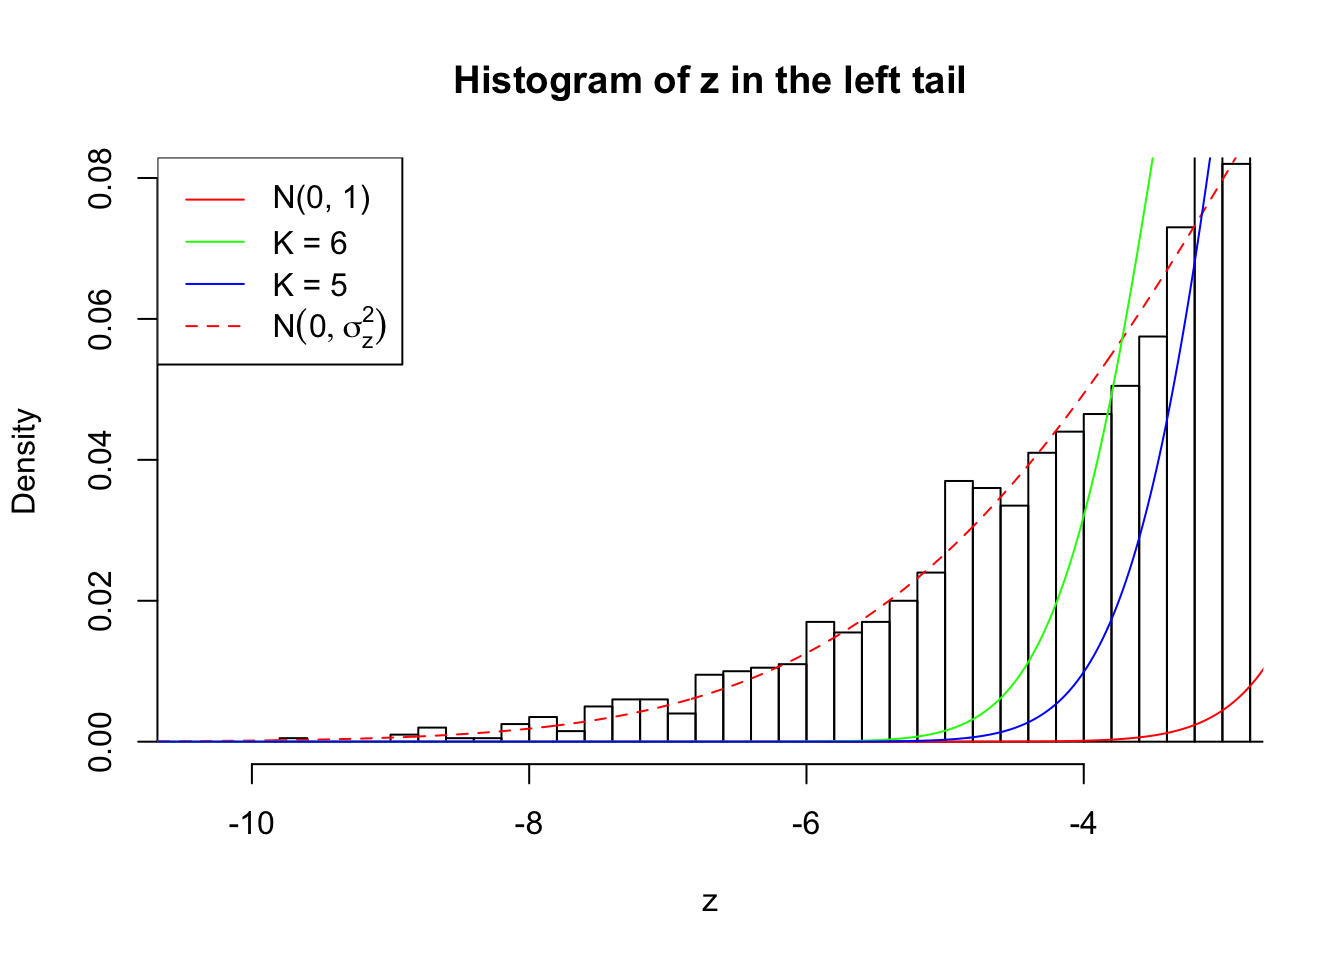
Zoom in to the right tail: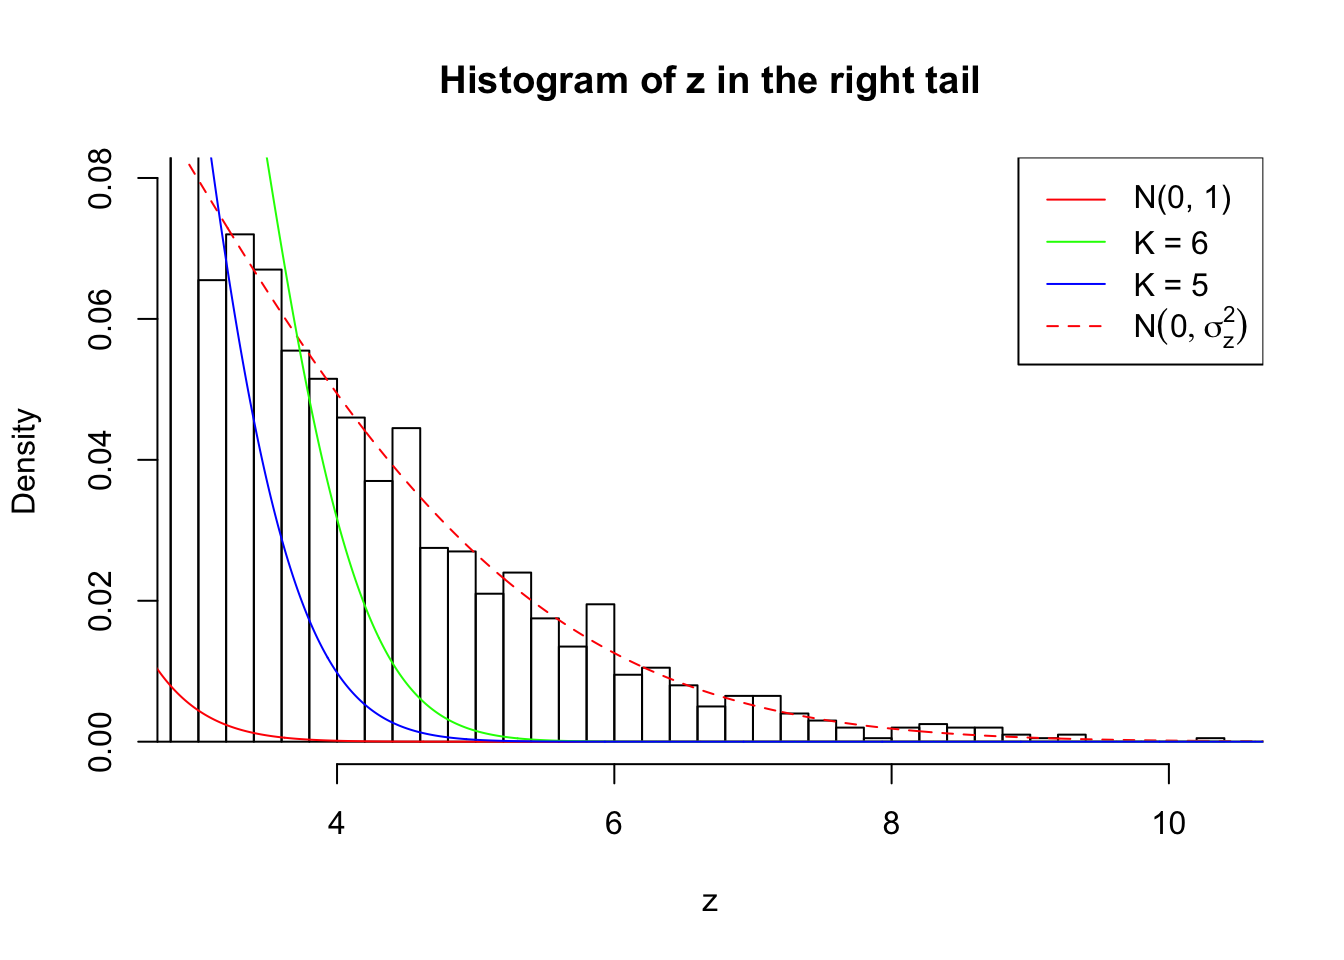
Example 4 :
SNR = 8 ;
True Distribution: N ( 0 , 7.309573 ) ;
Number of Discoveries: 3952 ;
pihat0 = 0.08656298 ;
Log-likelihood by True Distribution N ( 0, 7.309573 ) : -24187 ;
Log-likelihood by Gaussian Derivatives with K = 6 : -29045.38 ;
Log-likelihood Ratio between True Distribution N ( 0, 7.309573 ) and Fitted Gaussian Derivatives with K = 6 : 4858.372 ;
Normalized Weights of Gaussian Derivatives with K = 6 :
1 : -0.0206034448835079 ; 2 : 2.56735543697531 ; 3 : -0.0195051816112572 ; 4 : 3.80522687316745 ; 5 : -0.00201564696868051 ; 6 : 2.22210637473464 ;
Log-likelihood by Gaussian Derivatives with K = 5 : -31944.19 ;
Log-likelihood Ratio between True Distribution N ( 0, 7.309573 ) and Fitted Gaussian Derivatives with K = 5 : 7757.19 ;
Normalized Weights of Gaussian Derivatives with K = 5 :
1 : -0.027016205328516 ; 2 : 1.98489748843074 ; 3 : -0.0270749603534199 ; 4 : 1.56565594649678 ; 5 : -0.00611079194533588 ; 


Zoom in to the left tail: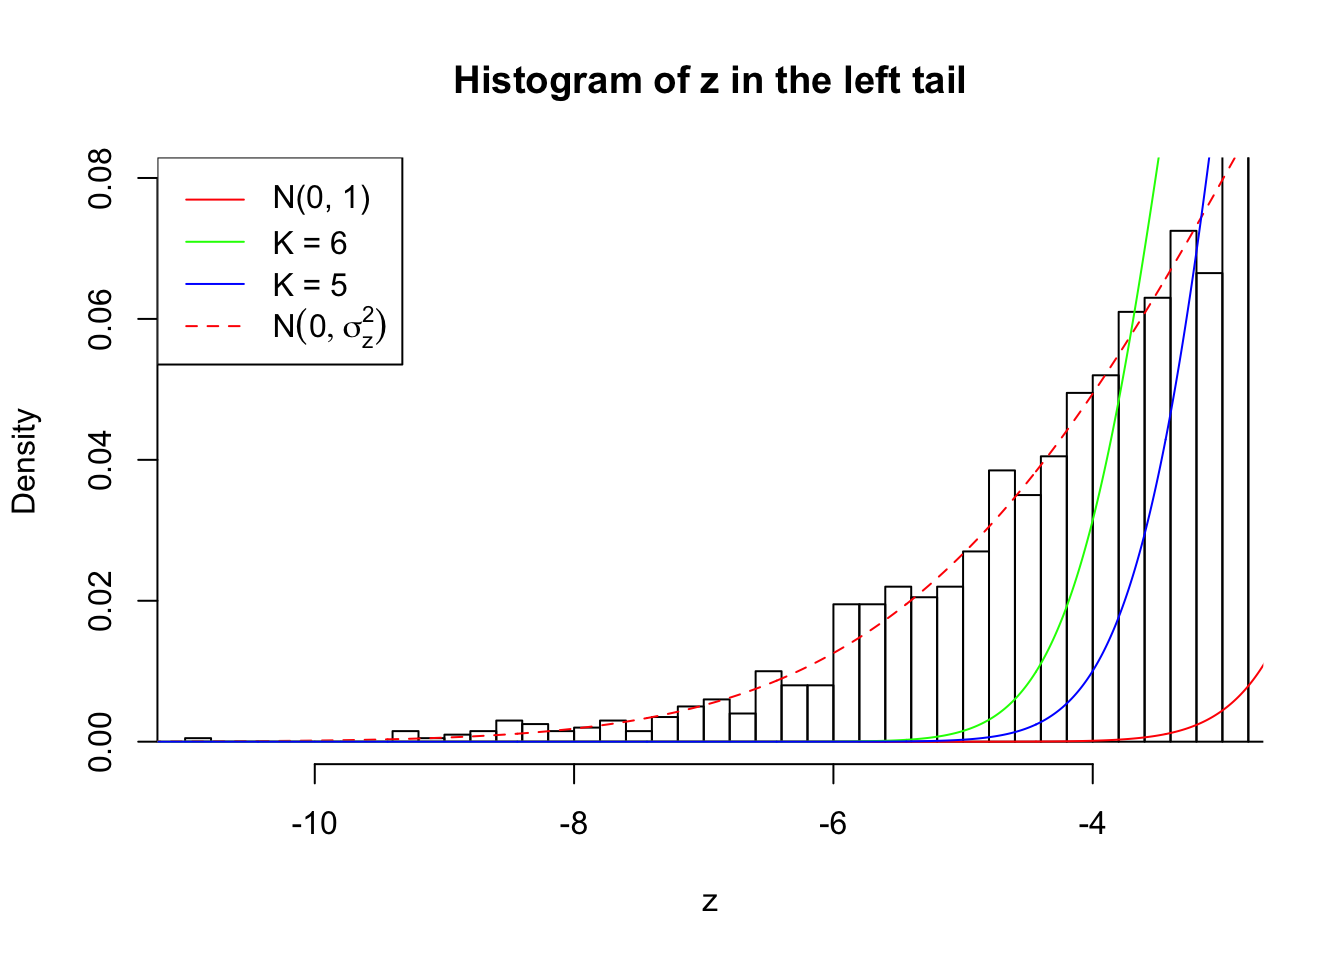
Zoom in to the right tail: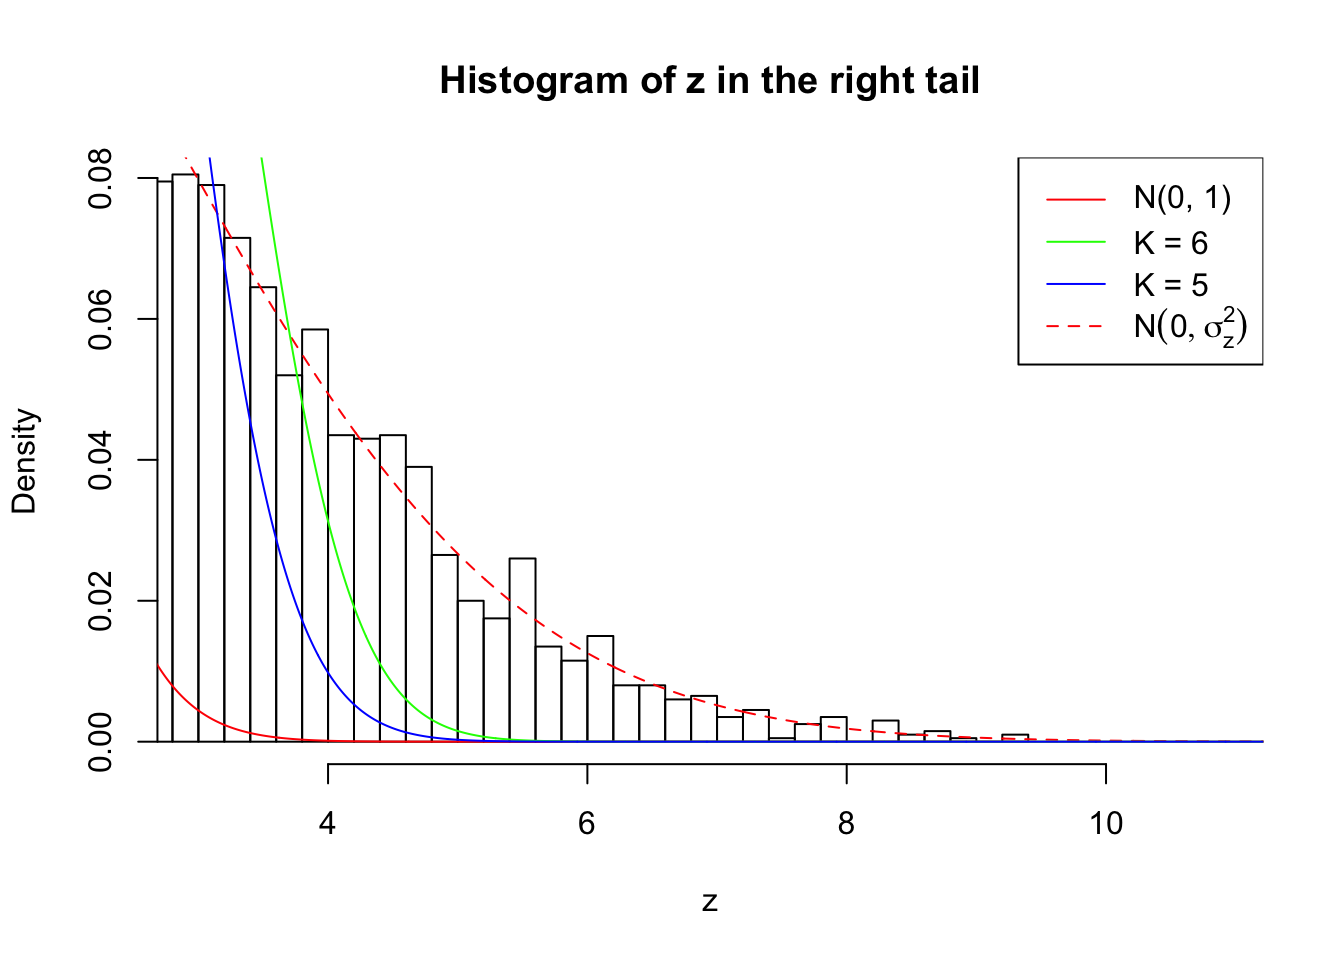
Example 5 :
SNR = 8 ;
True Distribution: N ( 0 , 7.309573 ) ;
Number of Discoveries: 3899 ;
pihat0 = 0.1077967 ;
Log-likelihood by True Distribution N ( 0, 7.309573 ) : -24166.42 ;
Log-likelihood by Gaussian Derivatives with K = 6 : -29164.99 ;
Log-likelihood Ratio between True Distribution N ( 0, 7.309573 ) and Fitted Gaussian Derivatives with K = 6 : 4998.566 ;
Normalized Weights of Gaussian Derivatives with K = 6 :
1 : 0.0427398762094977 ; 2 : 2.61806859203705 ; 3 : 0.0777731701832885 ; 4 : 3.91059345316949 ; 5 : 0.0448564315430896 ; 6 : 2.26738457298974 ;
Log-likelihood by Gaussian Derivatives with K = 5 : -31851.62 ;
Log-likelihood Ratio between True Distribution N ( 0, 7.309573 ) and Fitted Gaussian Derivatives with K = 5 : 7685.195 ;
Normalized Weights of Gaussian Derivatives with K = 5 :
1 : 0.045548659776884 ; 2 : 1.98322811808131 ; 3 : 0.0659398154220372 ; 4 : 1.58559580543908 ; 5 : 0.0182038967082177 ; 
Zoom in to the left tail: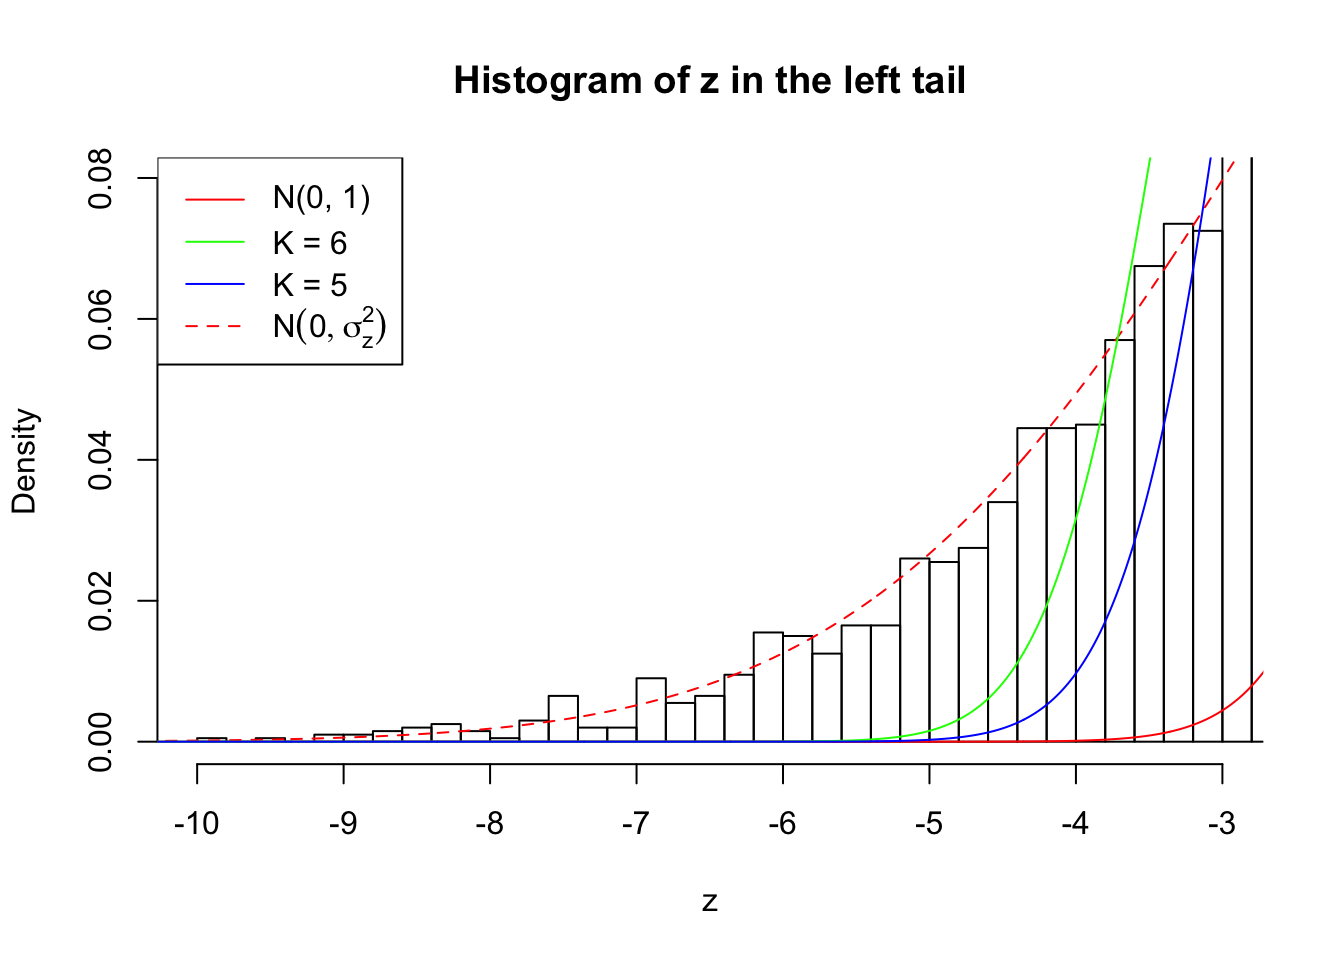
Zoom in to the right tail: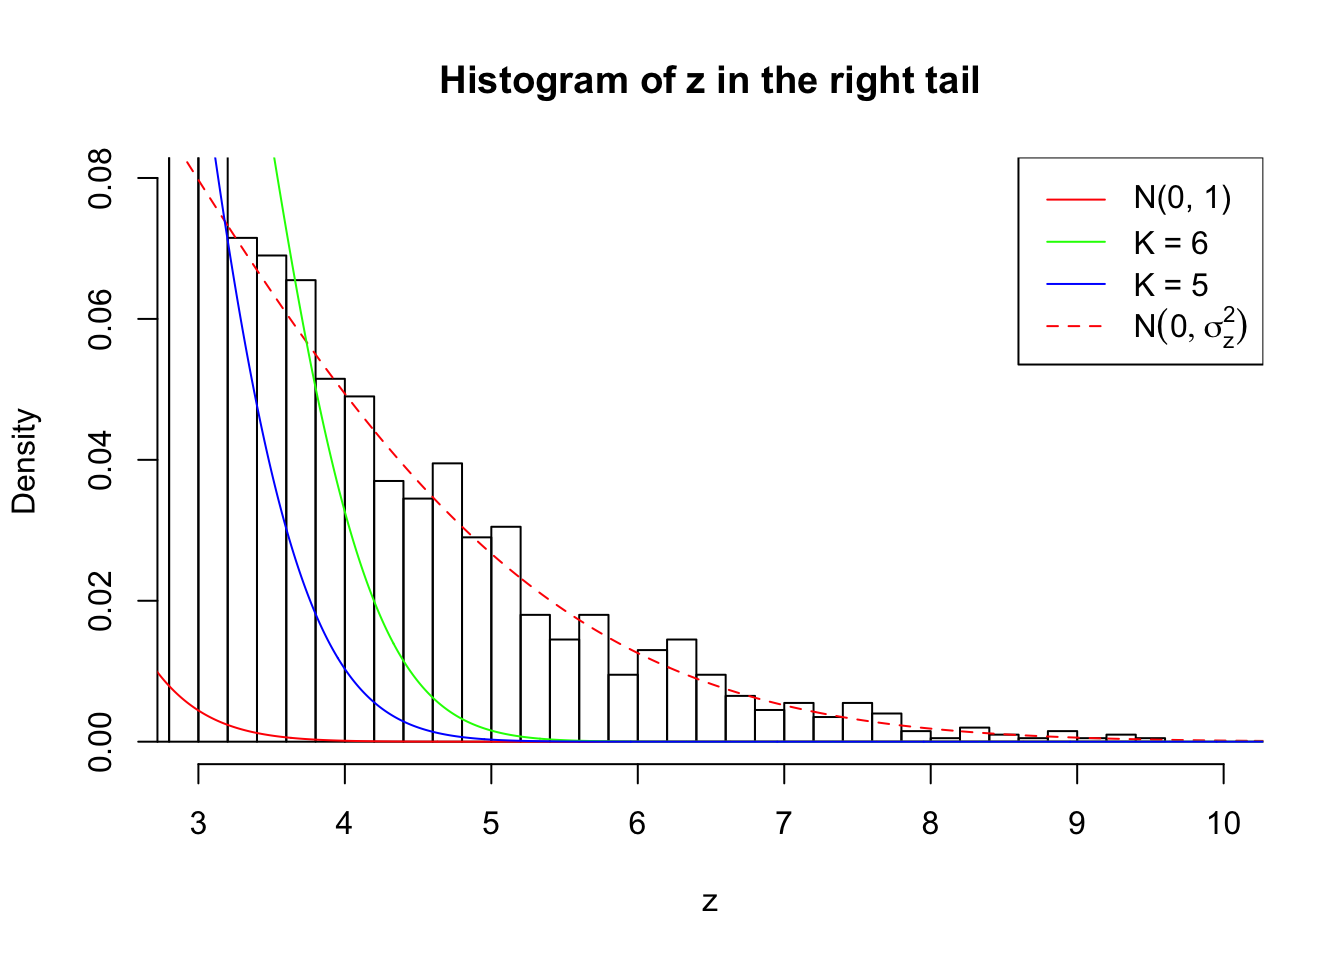
## SNR = 9 ; sigma_z = 2.990532 ; True Distribution: N ( 0 , 8.943282 ) .
Example 1 :
SNR = 9 ;
True Distribution: N ( 0 , 8.943282 ) ;
Number of Discoveries: 4482 ;
pihat0 = 0.07214675 ;
Log-likelihood by True Distribution N ( 0, 8.943282 ) : -25260.2 ;
Log-likelihood by Gaussian Derivatives with K = 6 : -33591.66 ;
Log-likelihood Ratio between True Distribution N ( 0, 8.943282 ) and Fitted Gaussian Derivatives with K = 6 : 8331.452 ;
Normalized Weights of Gaussian Derivatives with K = 6 :
1 : -0.0200952702053063 ; 2 : 2.70577564712737 ; 3 : 0.0234755479272126 ; 4 : 4.00771362970997 ; 5 : 0.0207216012591999 ; 6 : 2.29917777268476 ;
Log-likelihood by Gaussian Derivatives with K = 5 : -37680.12 ;
Log-likelihood Ratio between True Distribution N ( 0, 8.943282 ) and Fitted Gaussian Derivatives with K = 5 : 12419.92 ;
Normalized Weights of Gaussian Derivatives with K = 5 :
1 : -0.0355092626574237 ; 2 : 2.12868510144083 ; 3 : -0.0328340929155301 ; 4 : 1.71968825181984 ; 5 : -0.0155997016077485 ; 


Zoom in to the left tail: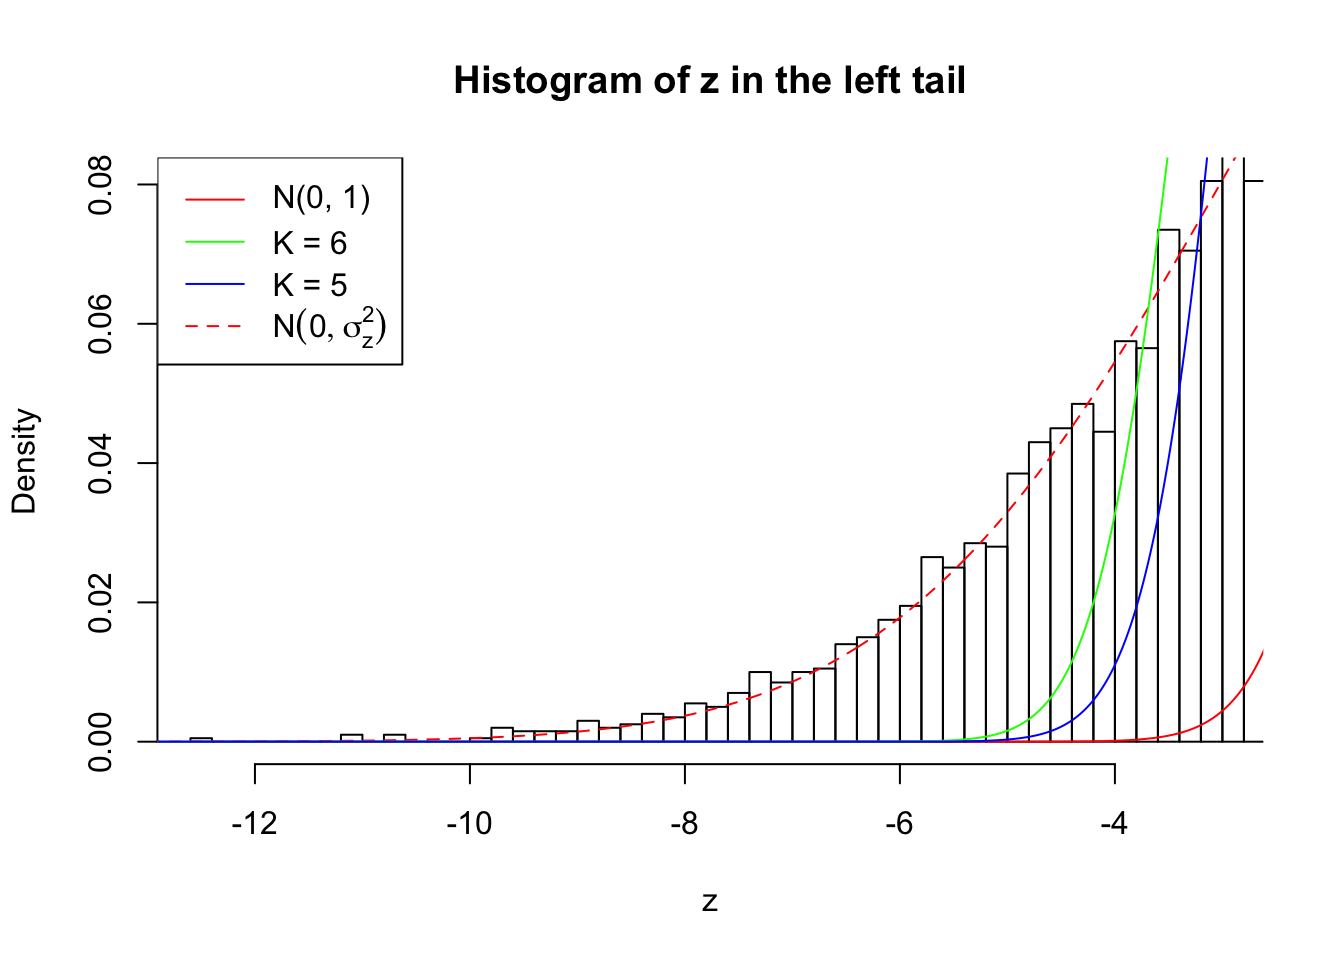
Zoom in to the right tail: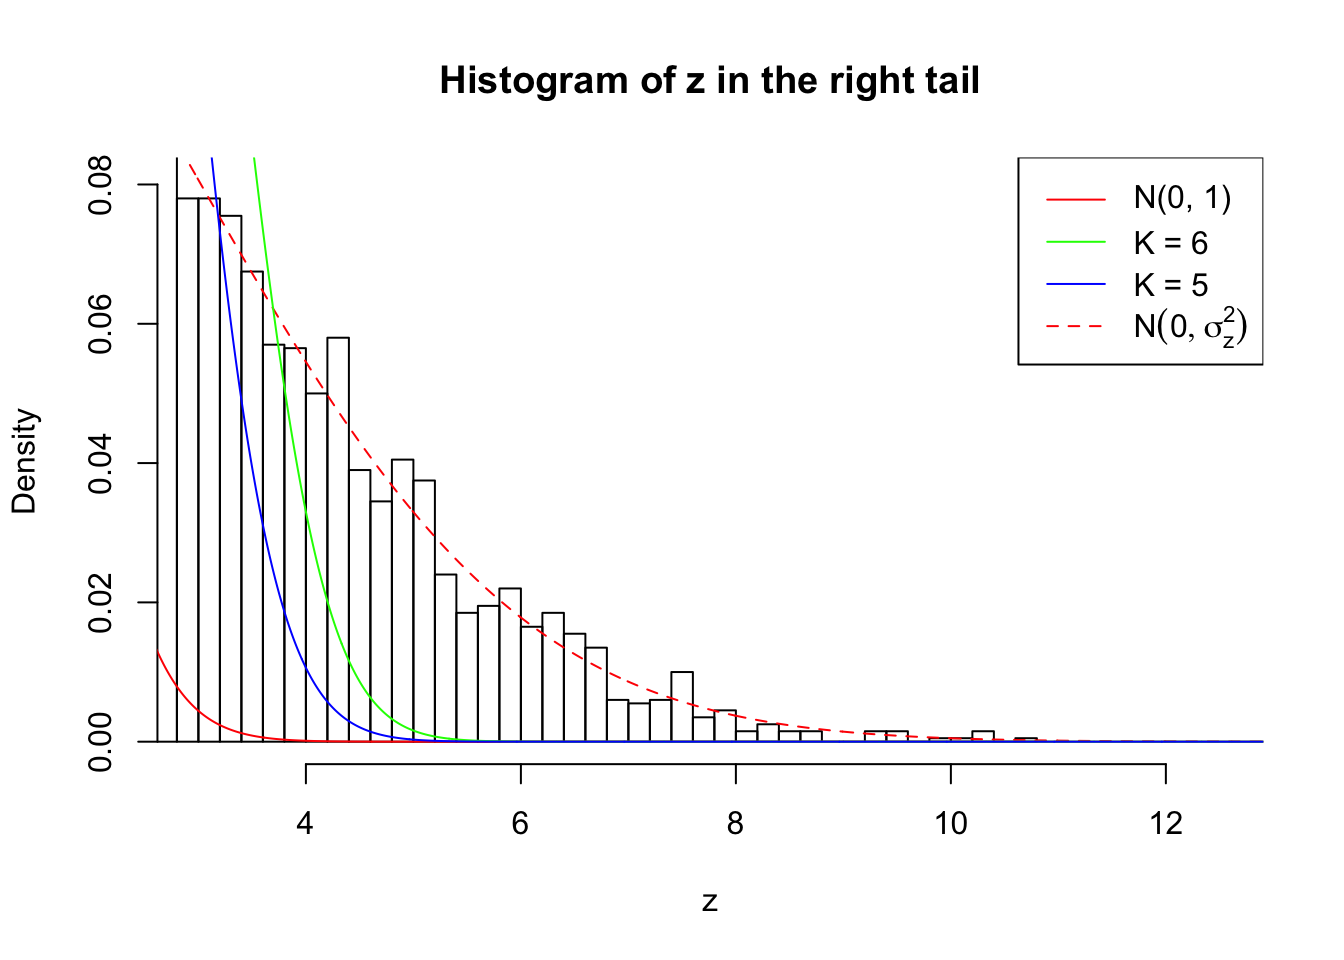
Example 2 :
SNR = 9 ;
True Distribution: N ( 0 , 8.943282 ) ;
Number of Discoveries: 4331 ;
pihat0 = 0.06865425 ;
Log-likelihood by True Distribution N ( 0, 8.943282 ) : -25049.88 ;
Log-likelihood by Gaussian Derivatives with K = 6 : -32879.85 ;
Log-likelihood Ratio between True Distribution N ( 0, 8.943282 ) and Fitted Gaussian Derivatives with K = 6 : 7829.973 ;
Normalized Weights of Gaussian Derivatives with K = 6 :
1 : -0.0118481448044448 ; 2 : 2.7796986362372 ; 3 : 0.0147953186401661 ; 4 : 4.24114709990809 ; 5 : 0.0157825845679687 ; 6 : 2.50268448455396 ;
Log-likelihood by Gaussian Derivatives with K = 5 : -36530.56 ;
Log-likelihood Ratio between True Distribution N ( 0, 8.943282 ) and Fitted Gaussian Derivatives with K = 5 : 11480.68 ;
Normalized Weights of Gaussian Derivatives with K = 5 :
1 : -0.0396370307801417 ; 2 : 2.09691444712674 ; 3 : -0.0244298920072881 ; 4 : 1.66843078627915 ; 5 : 0.0167443134840248 ; 

Zoom in to the left tail: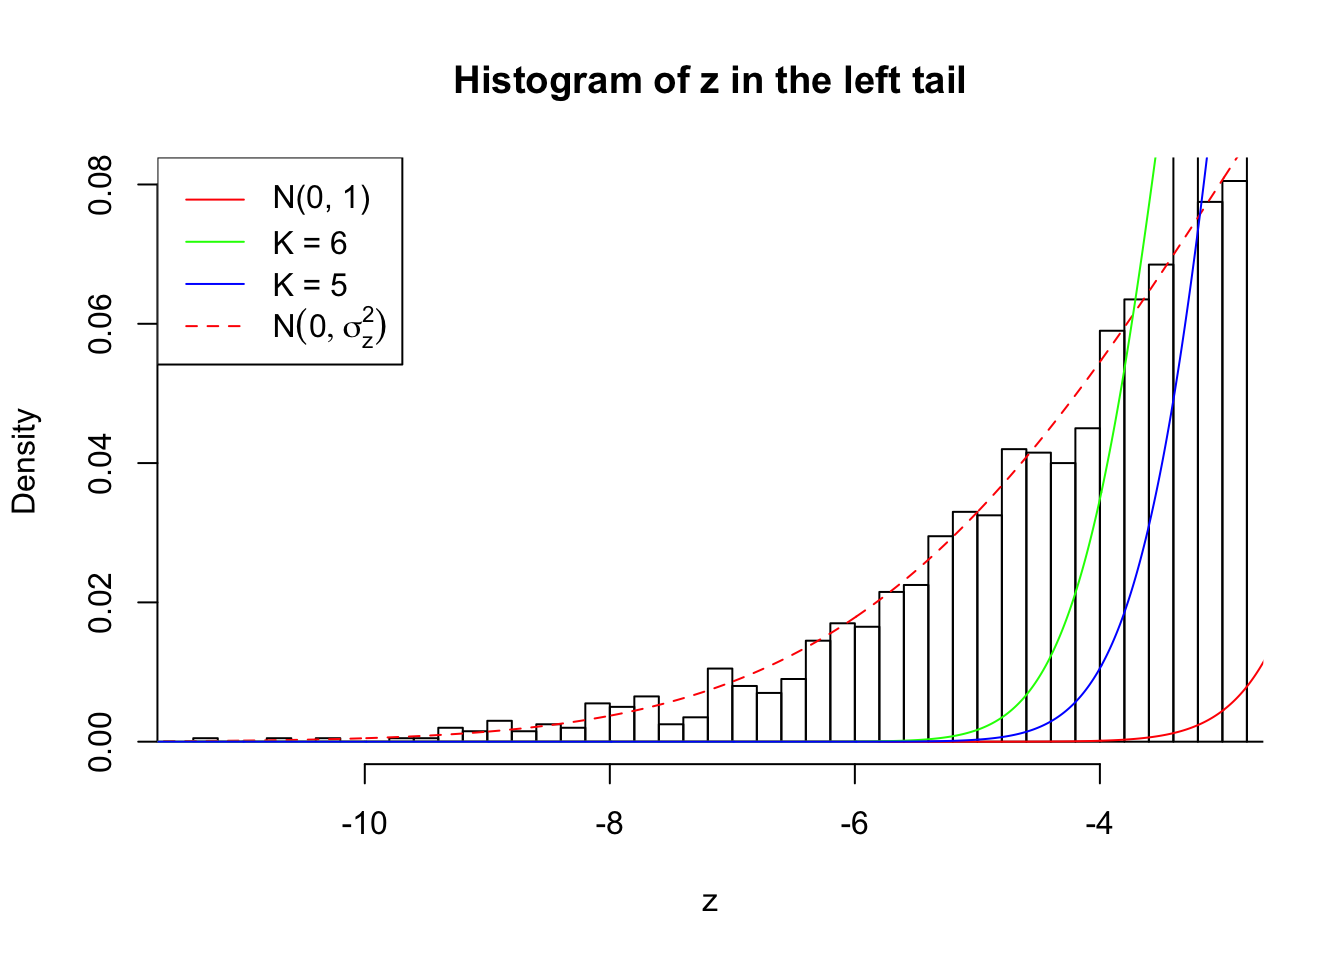
Zoom in to the right tail: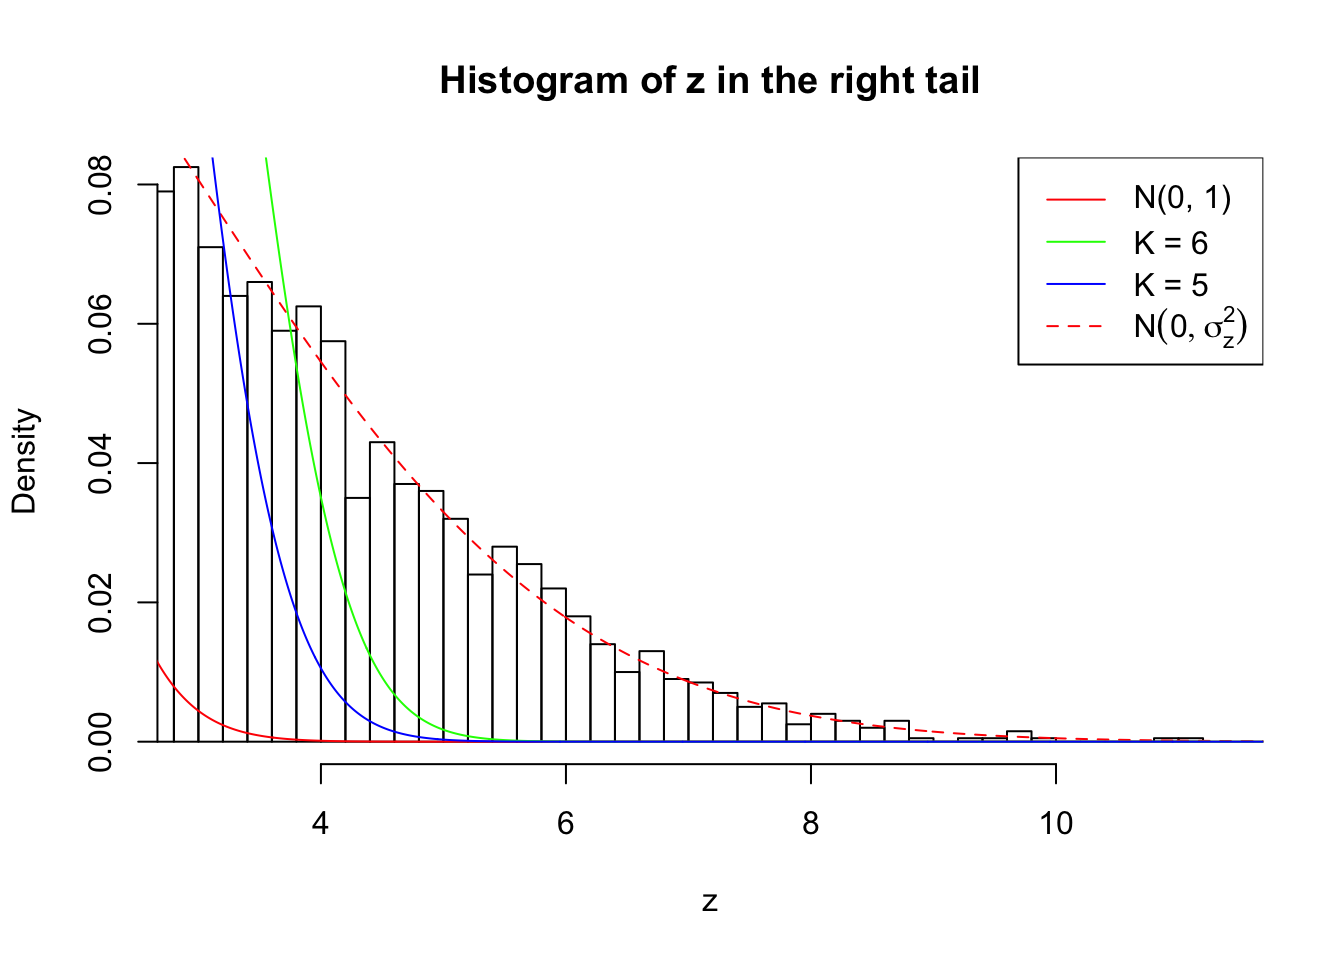
Example 3 :
SNR = 9 ;
True Distribution: N ( 0 , 8.943282 ) ;
Number of Discoveries: 4546 ;
pihat0 = 0.08109916 ;
Log-likelihood by True Distribution N ( 0, 8.943282 ) : -25164.49 ;
Log-likelihood by Gaussian Derivatives with K = 6 : -32855.24 ;
Log-likelihood Ratio between True Distribution N ( 0, 8.943282 ) and Fitted Gaussian Derivatives with K = 6 : 7690.759 ;
Normalized Weights of Gaussian Derivatives with K = 6 :
1 : -0.0370511982981982 ; 2 : 2.72329041198641 ; 3 : -0.127103598366047 ; 4 : 4.0766935735135 ; 5 : -0.0976827927260967 ; 6 : 2.35066412909989 ;
Log-likelihood by Gaussian Derivatives with K = 5 : -36872.49 ;
Log-likelihood Ratio between True Distribution N ( 0, 8.943282 ) and Fitted Gaussian Derivatives with K = 5 : 11708.01 ;
Normalized Weights of Gaussian Derivatives with K = 5 :
1 : -0.0140648455733178 ; 2 : 2.1339367625933 ; 3 : -0.0494389492890455 ; 4 : 1.72841919139732 ; 5 : -0.0335277614382204 ; 


Zoom in to the left tail: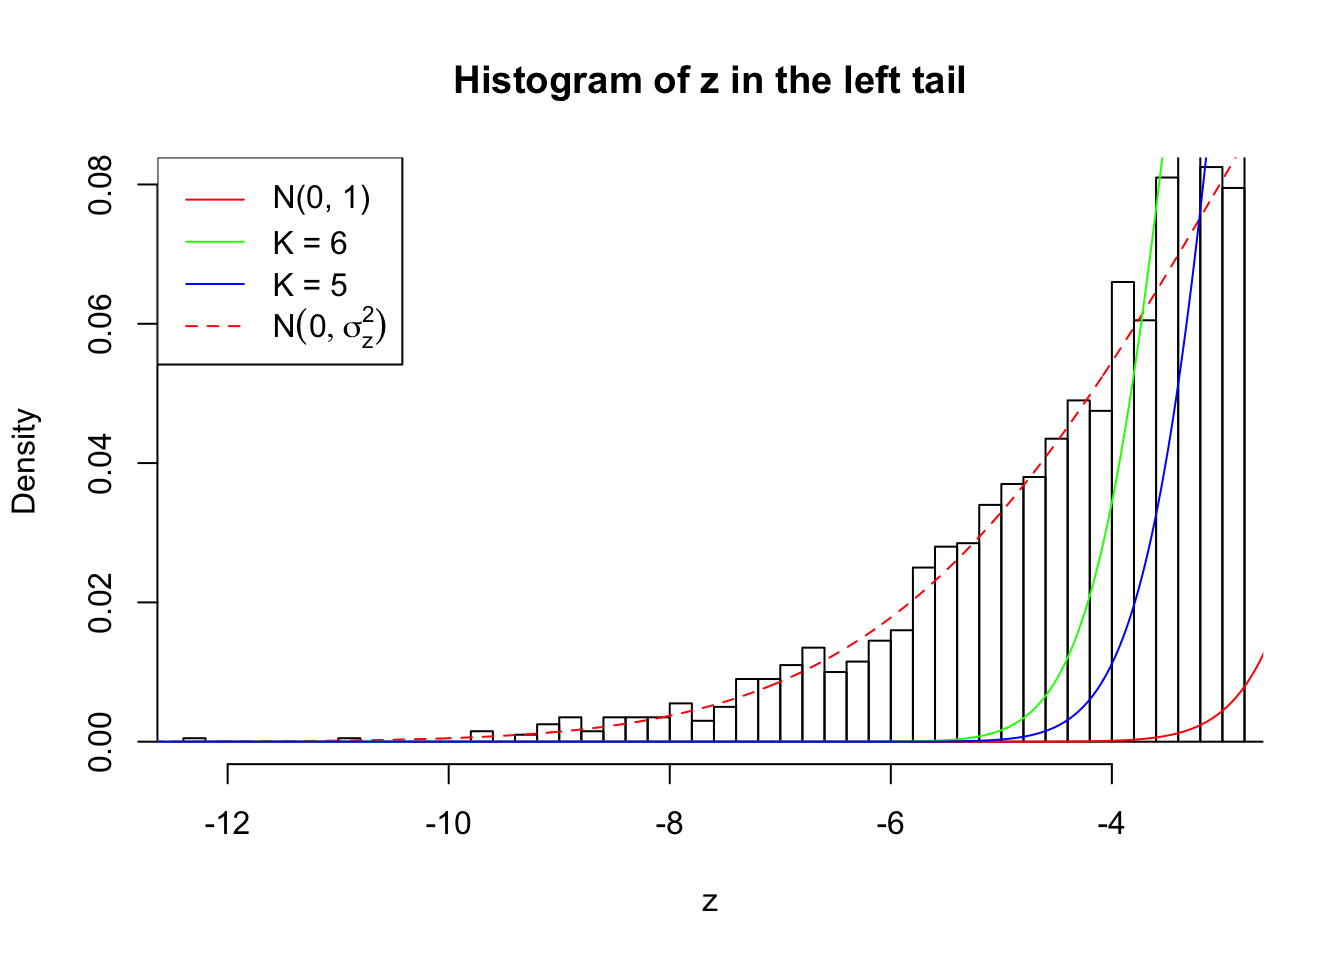
Zoom in to the right tail: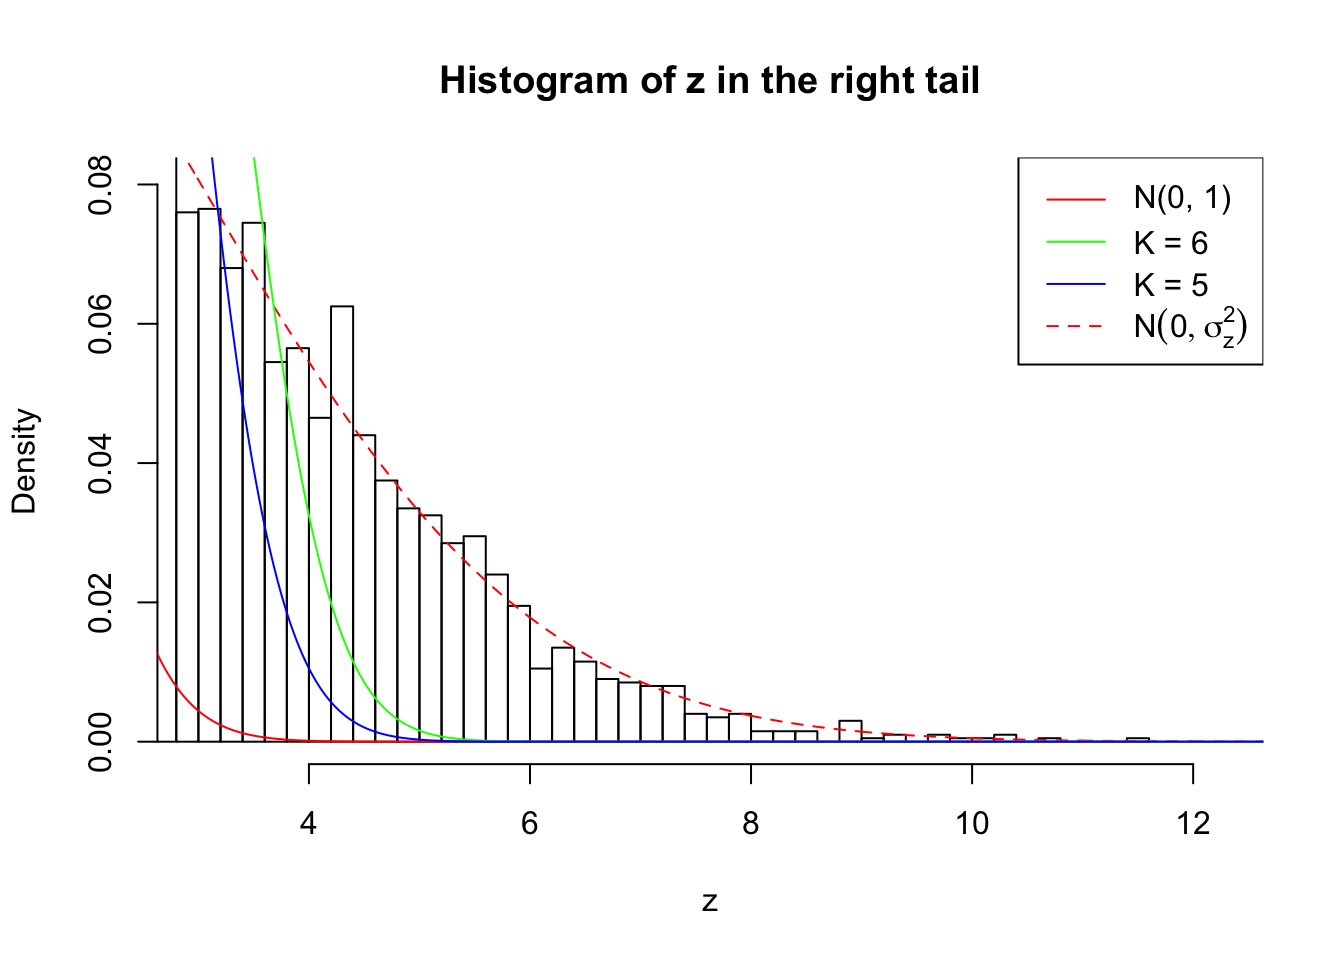
Example 4 :
SNR = 9 ;
True Distribution: N ( 0 , 8.943282 ) ;
Number of Discoveries: 4492 ;
pihat0 = 0.08146913 ;
Log-likelihood by True Distribution N ( 0, 8.943282 ) : -25203.14 ;
Log-likelihood by Gaussian Derivatives with K = 6 : -33373.18 ;
Log-likelihood Ratio between True Distribution N ( 0, 8.943282 ) and Fitted Gaussian Derivatives with K = 6 : 8170.031 ;
Normalized Weights of Gaussian Derivatives with K = 6 :
1 : 0.00501567898026982 ; 2 : 2.87465931120391 ; 3 : 0.00290829147950967 ; 4 : 4.44704795480167 ; 5 : 0.0132047958198434 ; 6 : 2.6190712213443 ;
Log-likelihood by Gaussian Derivatives with K = 5 : -37233.33 ;
Log-likelihood Ratio between True Distribution N ( 0, 8.943282 ) and Fitted Gaussian Derivatives with K = 5 : 12030.19 ;
Normalized Weights of Gaussian Derivatives with K = 5 :
1 : 0.00413829110193593 ; 2 : 2.11361129838446 ; 3 : -0.0107119022734637 ; 4 : 1.71057016325765 ; 5 : -0.00346874900298212 ; 


Zoom in to the left tail: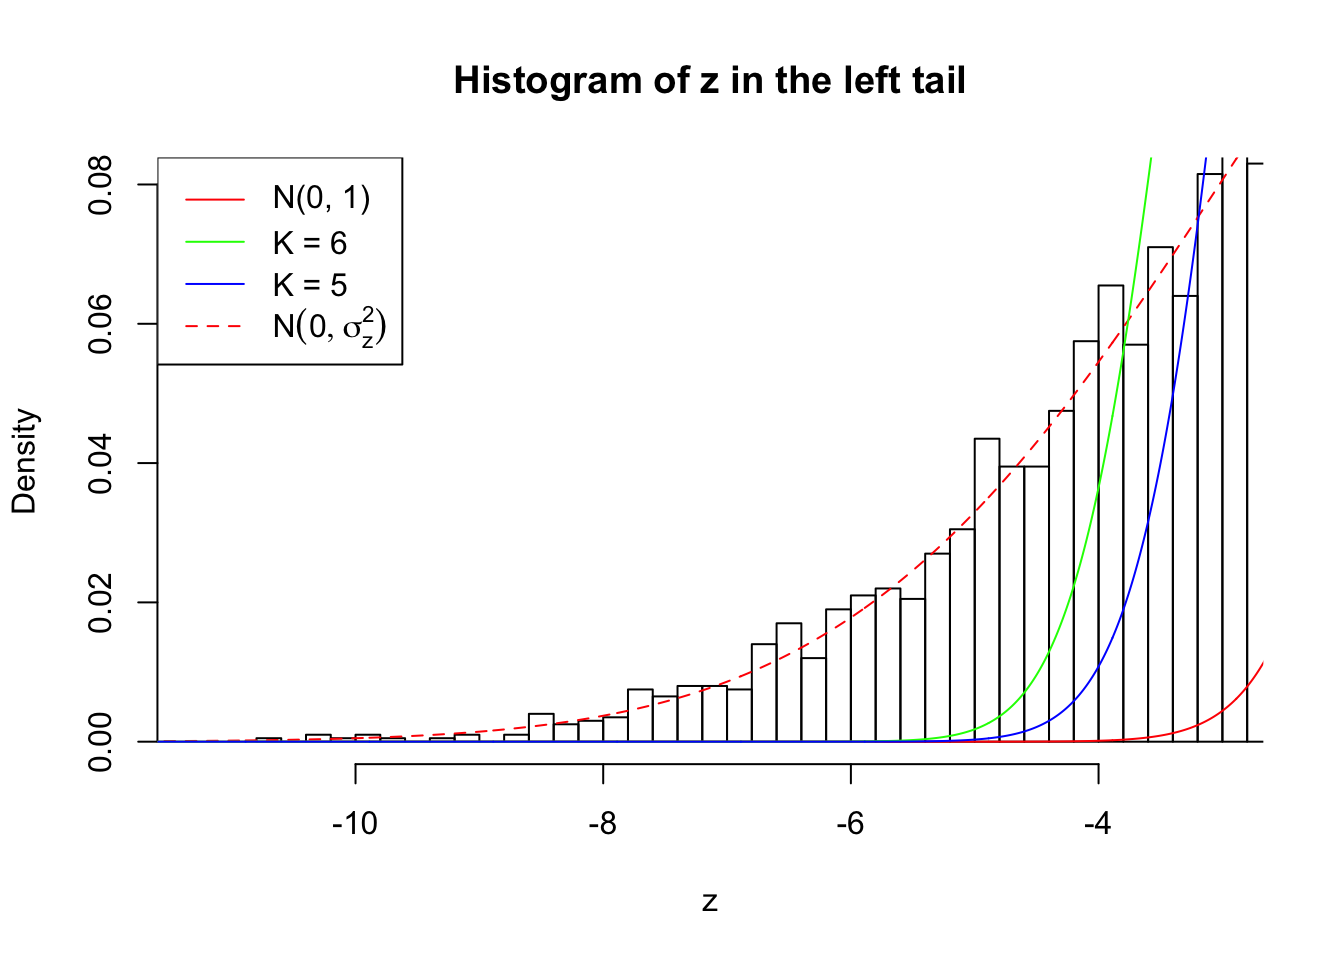
Zoom in to the right tail: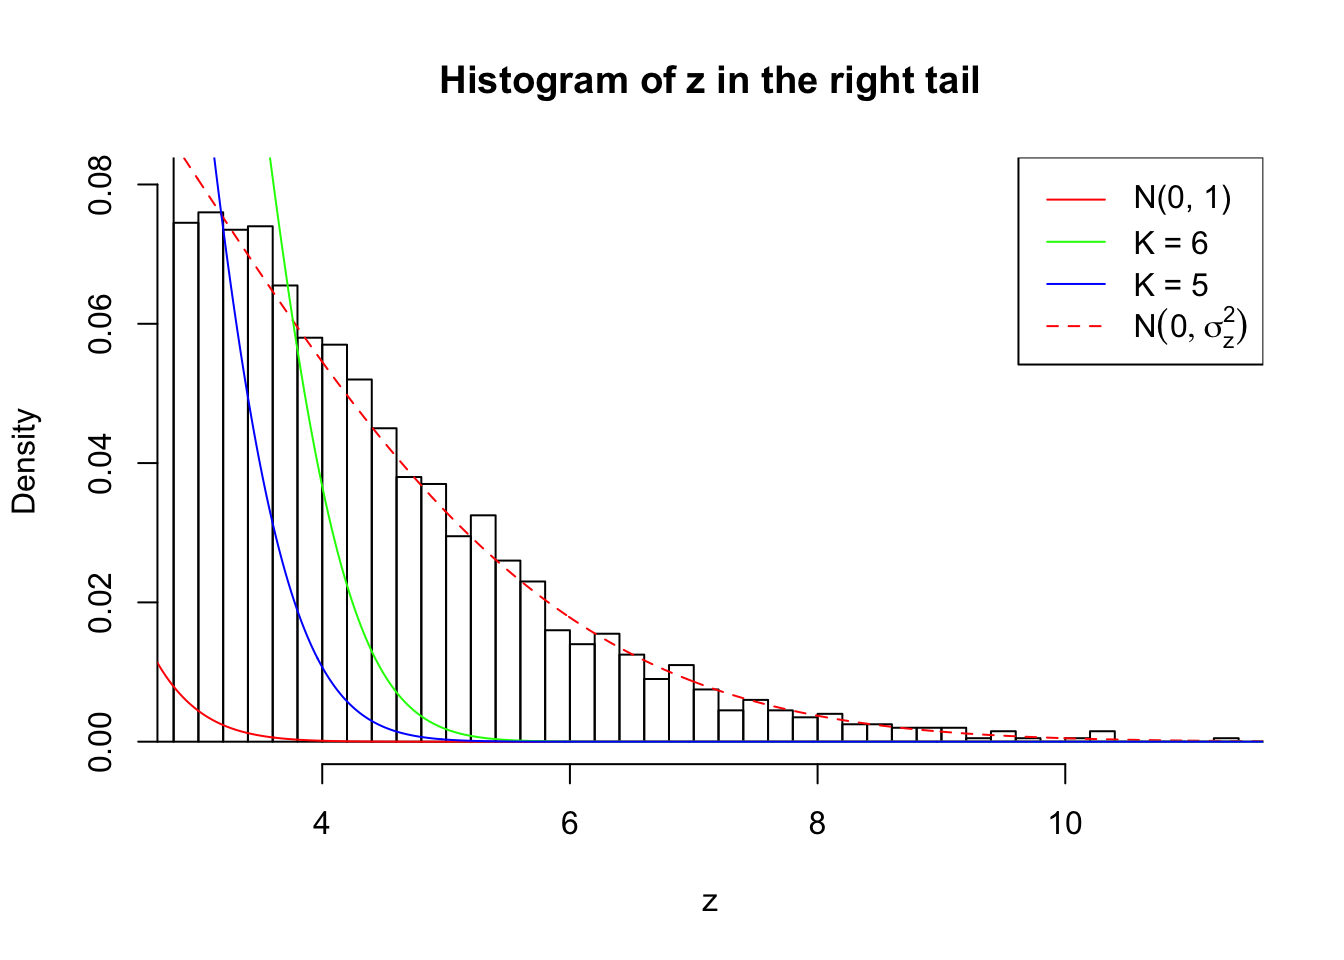
Example 5 :
SNR = 9 ;
True Distribution: N ( 0 , 8.943282 ) ;
Number of Discoveries: 4466 ;
pihat0 = 0.08603856 ;
Log-likelihood by True Distribution N ( 0, 8.943282 ) : -25165.91 ;
Log-likelihood by Gaussian Derivatives with K = 6 : -33165.64 ;
Log-likelihood Ratio between True Distribution N ( 0, 8.943282 ) and Fitted Gaussian Derivatives with K = 6 : 7999.728 ;
Normalized Weights of Gaussian Derivatives with K = 6 :
1 : 0.00596118834903648 ; 2 : 2.76422782520799 ; 3 : -0.013950817489483 ; 4 : 4.20491448828645 ; 5 : -0.0290508365341806 ; 6 : 2.4568157323229 ;
Log-likelihood by Gaussian Derivatives with K = 5 : -37088.68 ;
Log-likelihood Ratio between True Distribution N ( 0, 8.943282 ) and Fitted Gaussian Derivatives with K = 5 : 11922.77 ;
Normalized Weights of Gaussian Derivatives with K = 5 :
1 : 0.0132826541910612 ; 2 : 2.10603816814406 ; 3 : -0.000943359578635805 ; 4 : 1.70381670500689 ; 5 : -0.0249672044643002 ; 


Zoom in to the left tail: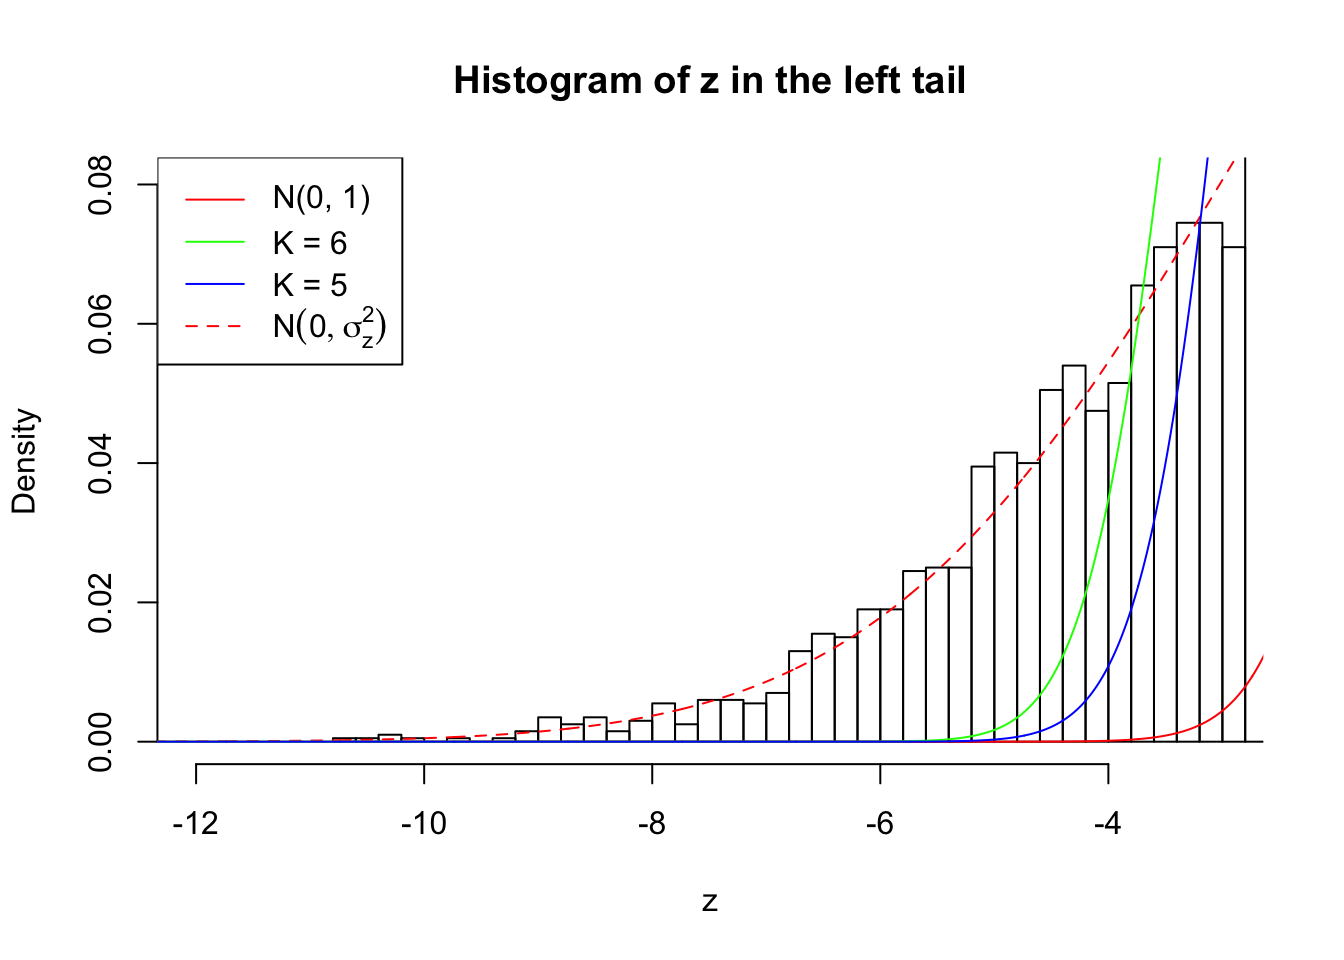
Zoom in to the right tail: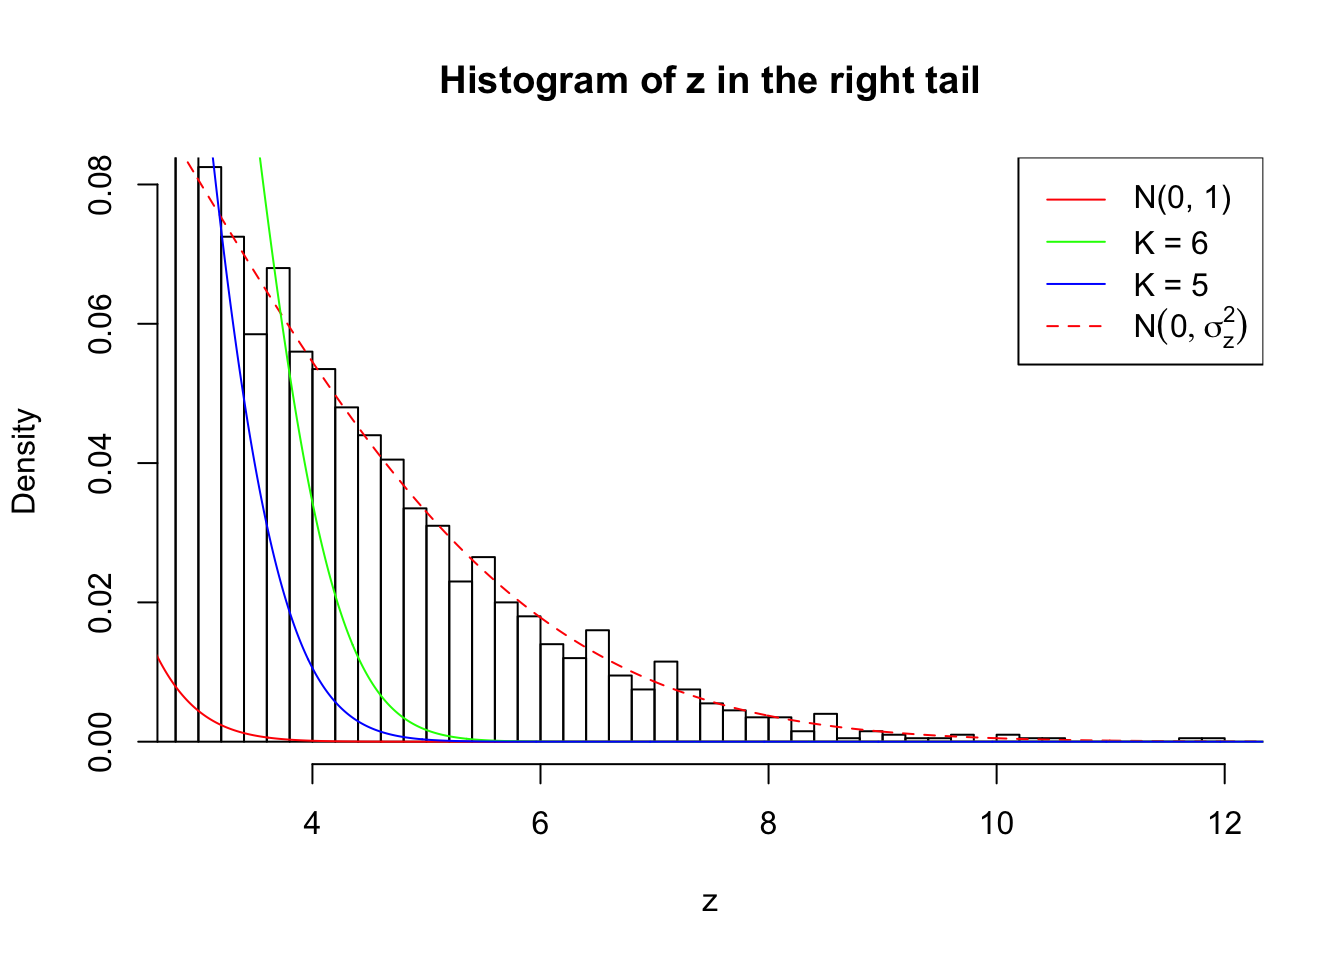
## SNR = 10 ; sigma_z = 3.316625 ; True Distribution: N ( 0 , 11 ) .
Example 1 :
SNR = 10 ;
True Distribution: N ( 0 , 11 ) ;
Number of Discoveries: 5011 ;
pihat0 = 0.07150713 ;
Log-likelihood by True Distribution N ( 0, 11 ) : -26181.19 ;
Log-likelihood by Gaussian Derivatives with K = 6 : -38850.85 ;
Log-likelihood Ratio between True Distribution N ( 0, 11 ) and Fitted Gaussian Derivatives with K = 6 : 12669.66 ;
Normalized Weights of Gaussian Derivatives with K = 6 :
1 : -0.0274236929352572 ; 2 : 2.89711168724025 ; 3 : -0.0223603095778489 ; 4 : 4.45623541443822 ; 5 : 0.00101775045562966 ; 6 : 2.62862143174931 ;
Log-likelihood by Gaussian Derivatives with K = 5 : -44143.81 ;
Log-likelihood Ratio between True Distribution N ( 0, 11 ) and Fitted Gaussian Derivatives with K = 5 : 17962.61 ;
Normalized Weights of Gaussian Derivatives with K = 5 :
1 : -0.0385032350077447 ; 2 : 2.2210137346095 ; 3 : -0.0447036615903929 ; 4 : 1.81344530778662 ; 5 : -0.00202440280451175 ; 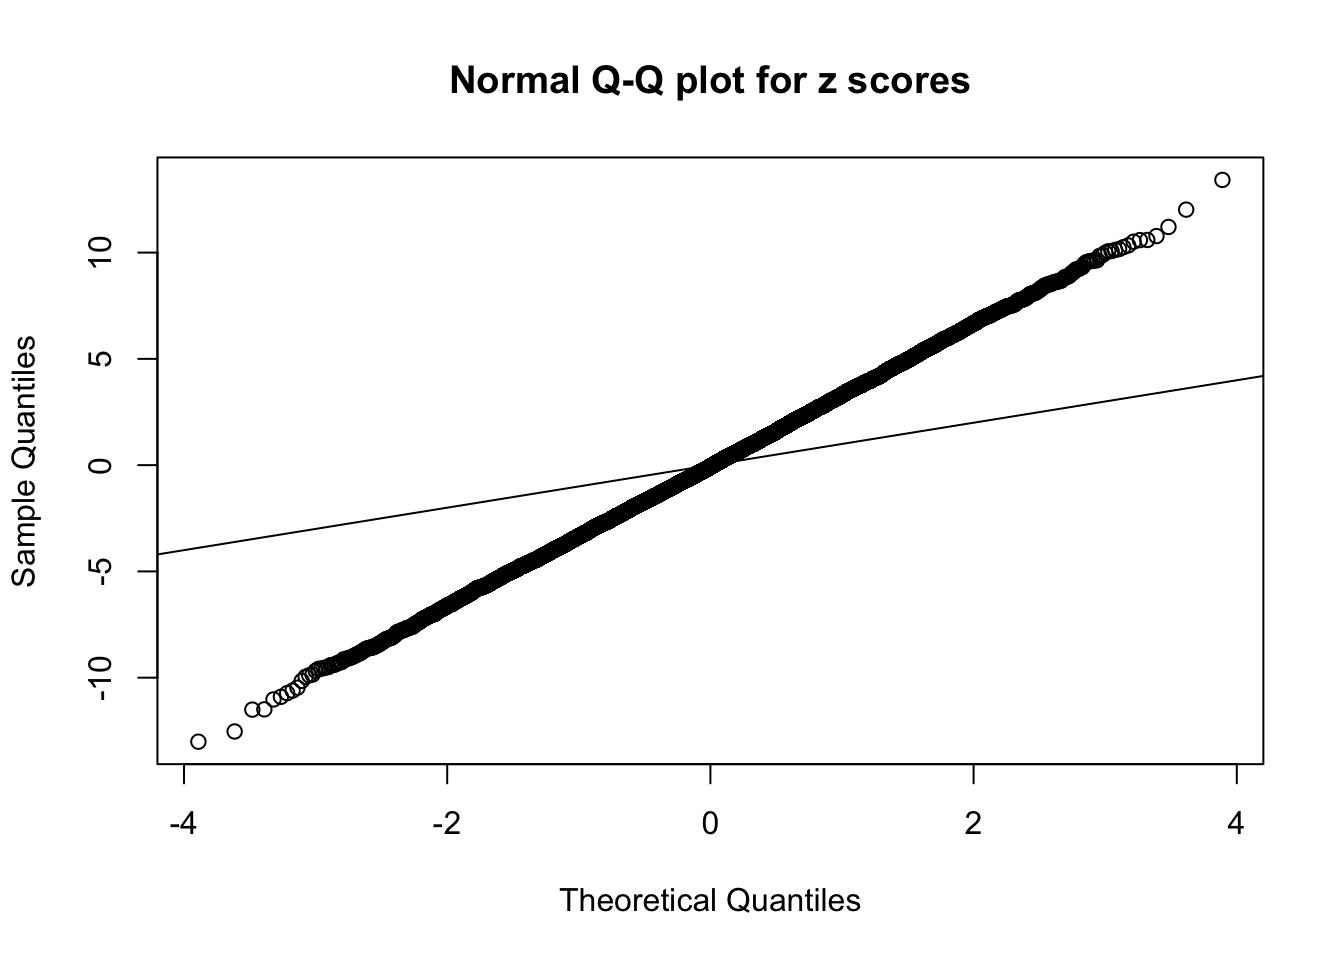


Zoom in to the left tail: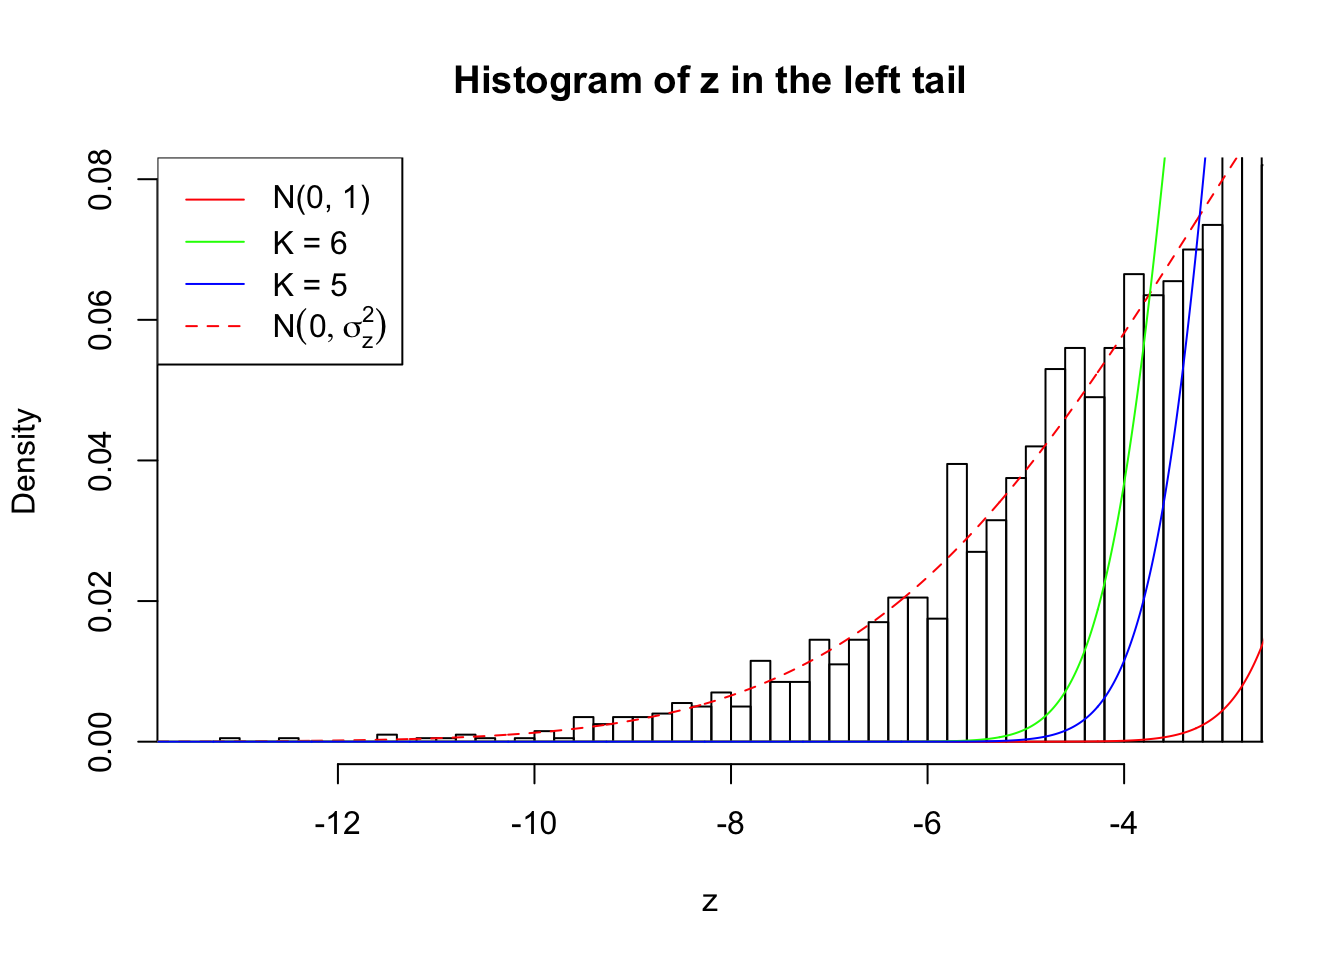
Zoom in to the right tail: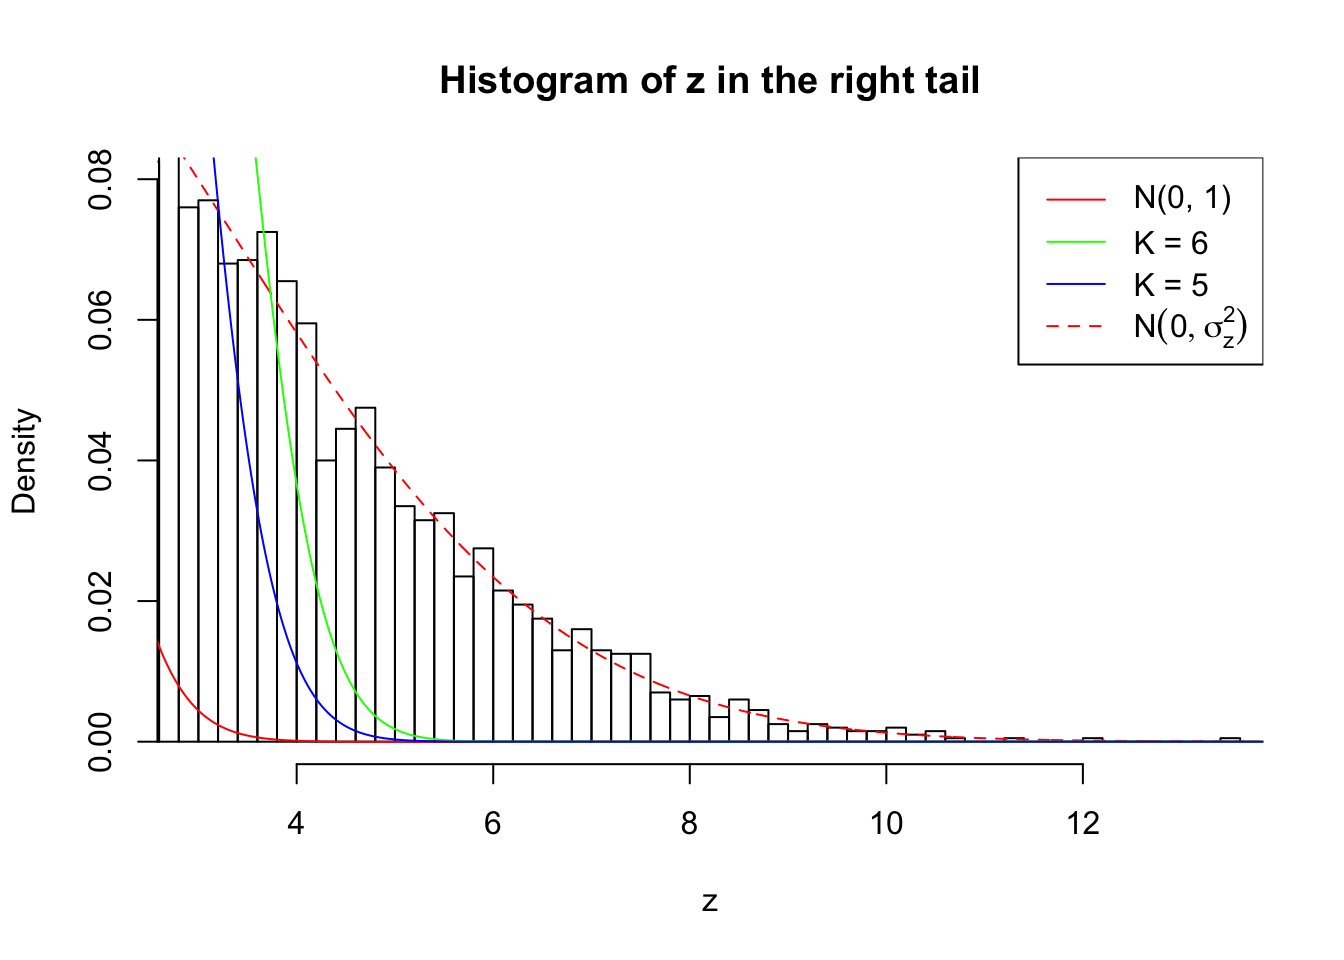
Example 2 :
SNR = 10 ;
True Distribution: N ( 0 , 11 ) ;
Number of Discoveries: 4990 ;
pihat0 = 0.07062845 ;
Log-likelihood by True Distribution N ( 0, 11 ) : -26216.58 ;
Log-likelihood by Gaussian Derivatives with K = 6 : -39023.06 ;
Log-likelihood Ratio between True Distribution N ( 0, 11 ) and Fitted Gaussian Derivatives with K = 6 : 12806.48 ;
Normalized Weights of Gaussian Derivatives with K = 6 :
1 : 0.00188608241211791 ; 2 : 2.80497119845542 ; 3 : 0.012664085793072 ; 4 : 4.19662730932605 ; 5 : 0.00702606774451777 ; 6 : 2.39432486209987 ;
Log-likelihood by Gaussian Derivatives with K = 5 : -44506.92 ;
Log-likelihood Ratio between True Distribution N ( 0, 11 ) and Fitted Gaussian Derivatives with K = 5 : 18290.34 ;
Normalized Weights of Gaussian Derivatives with K = 5 :
1 : -0.0139504523290885 ; 2 : 2.22195423539989 ; 3 : -0.0107302268163738 ; 4 : 1.82807934181925 ; 5 : 0.00109459089469162 ; 


Zoom in to the left tail: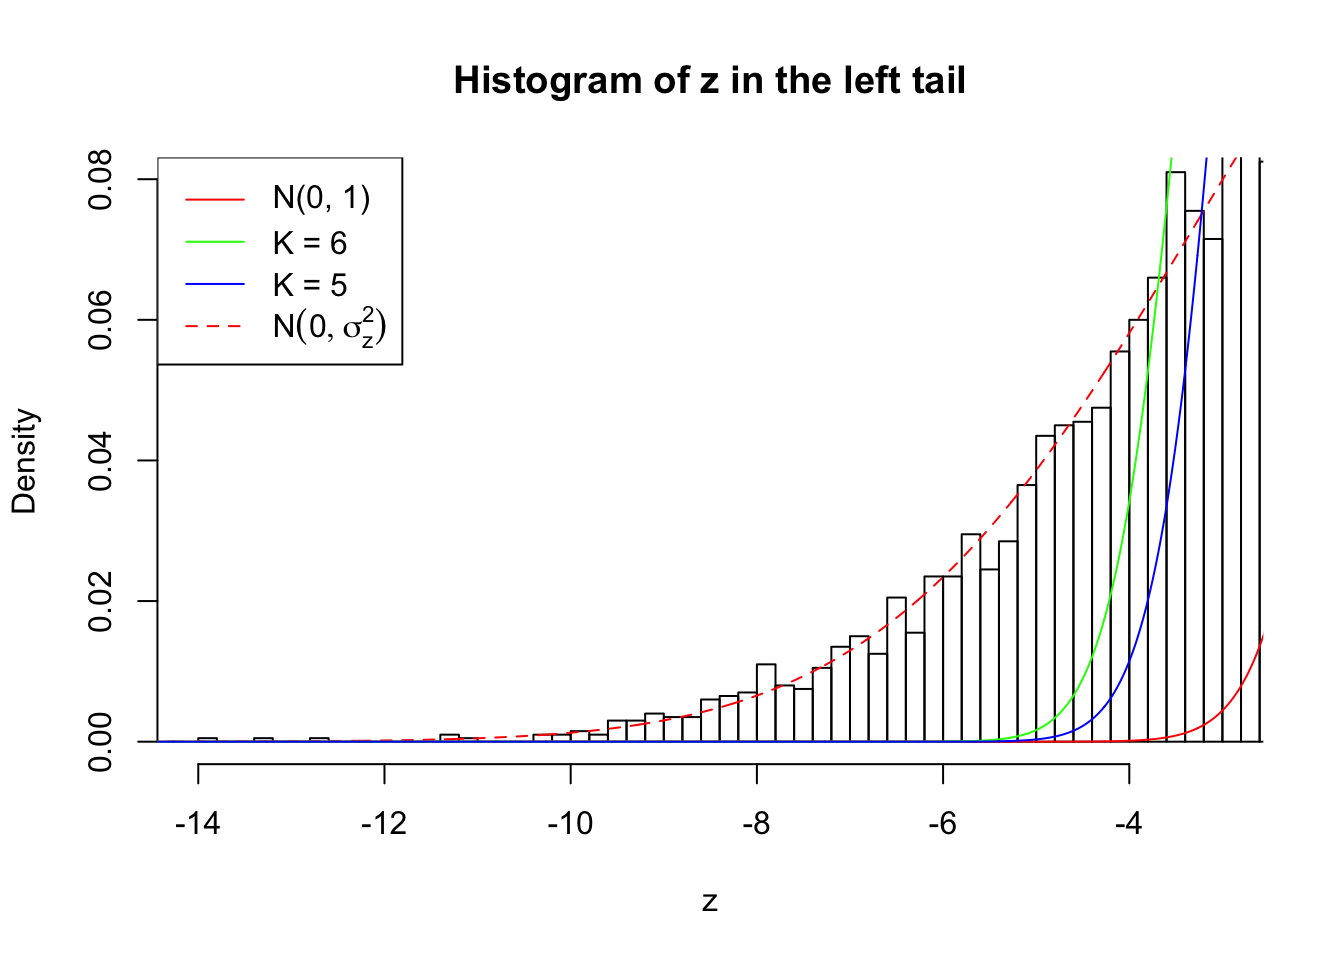
Zoom in to the right tail: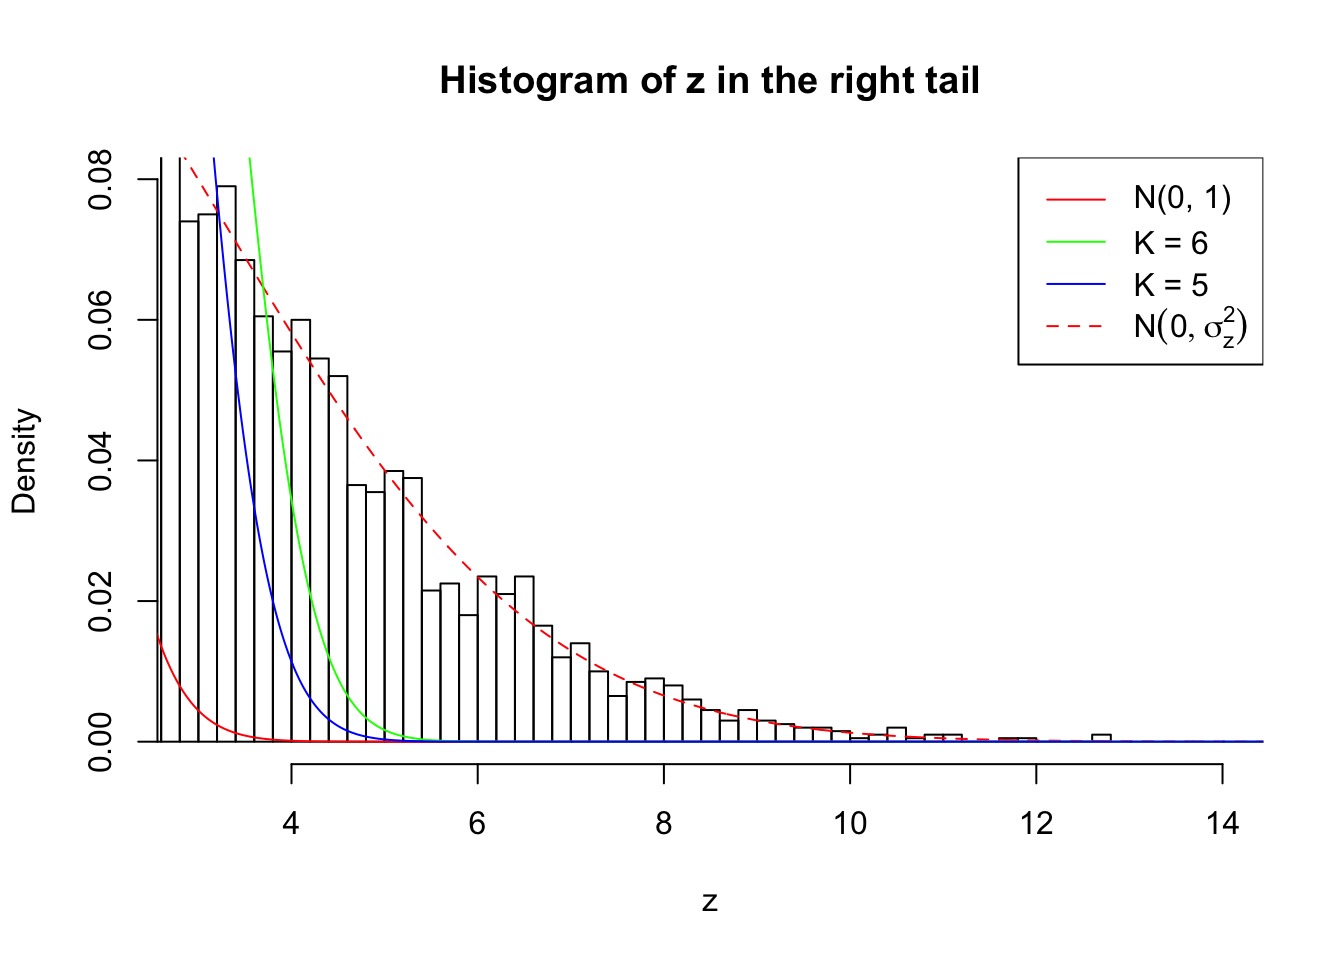
Example 3 :
SNR = 10 ;
True Distribution: N ( 0 , 11 ) ;
Number of Discoveries: 5017 ;
pihat0 = 0.07467248 ;
Log-likelihood by True Distribution N ( 0, 11 ) : -26207.72 ;
Log-likelihood by Gaussian Derivatives with K = 5 : -44357.02 ;
Log-likelihood Ratio between True Distribution N ( 0, 11 ) and Fitted Gaussian Derivatives with K = 5 : 18149.3 ;
Normalized Weights of Gaussian Derivatives with K = 5 :
1 : -0.000959029668663561 ; 2 : 2.22010699044865 ; 3 : -0.0135059729501484 ; 4 : 1.82792253239188 ; 5 : -0.0192050739456098 ;
Log-likelihood by Gaussian Derivatives with K = 4 : -44357.86 ;
Log-likelihood Ratio between True Distribution N ( 0, 11 ) and Fitted Gaussian Derivatives with K = 4 : 18150.14 ;
Normalized Weights of Gaussian Derivatives with K = 4 :
1 : 0.00215492288428279 ; 2 : 2.22008711070275 ; 3 : 0.00282896641163462 ; 4 : 1.82788088385223 ; 


Zoom in to the left tail: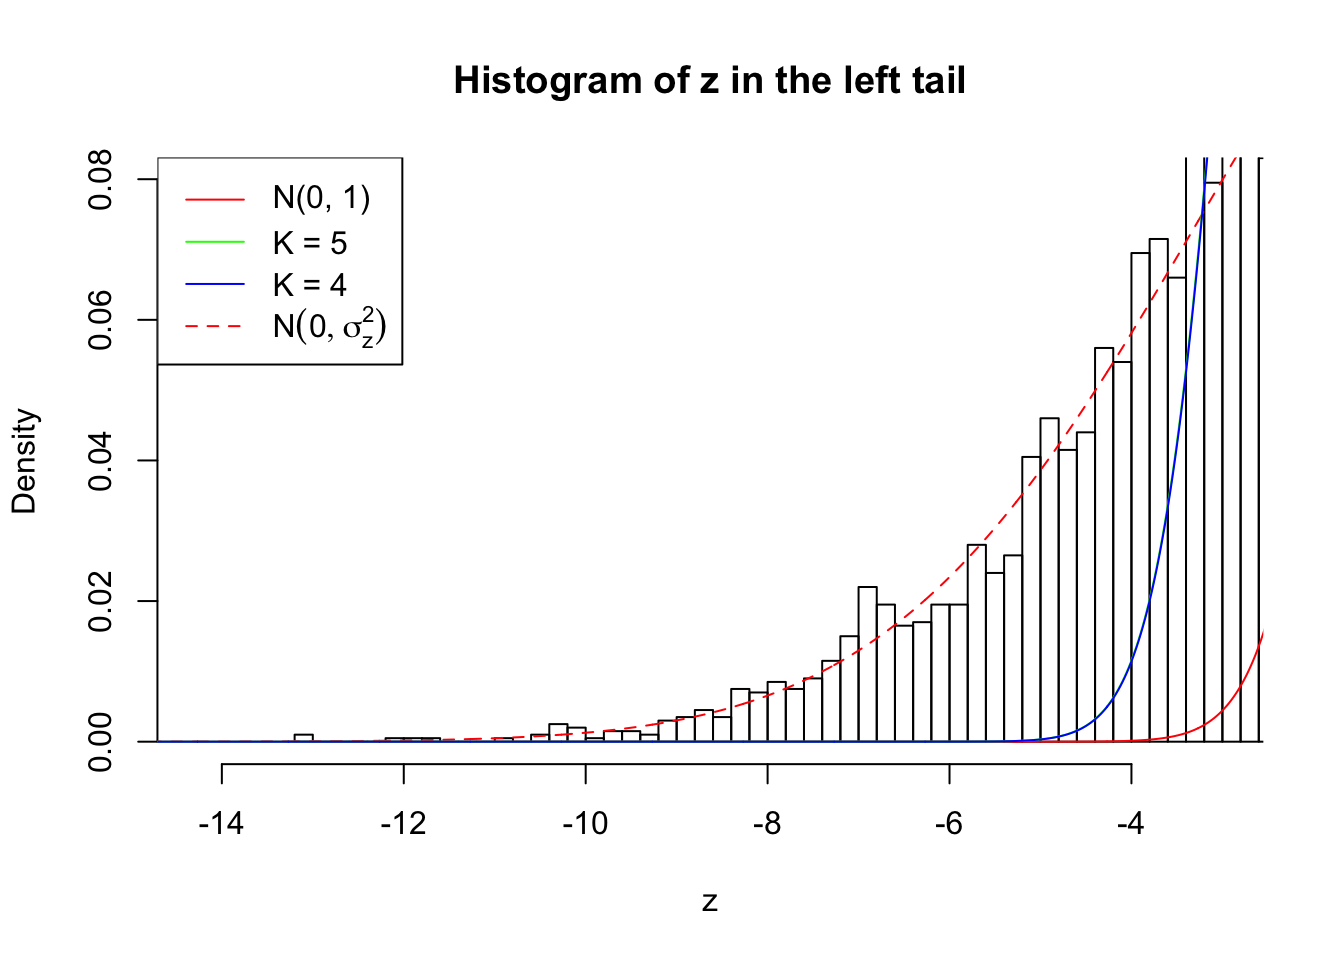
Zoom in to the right tail: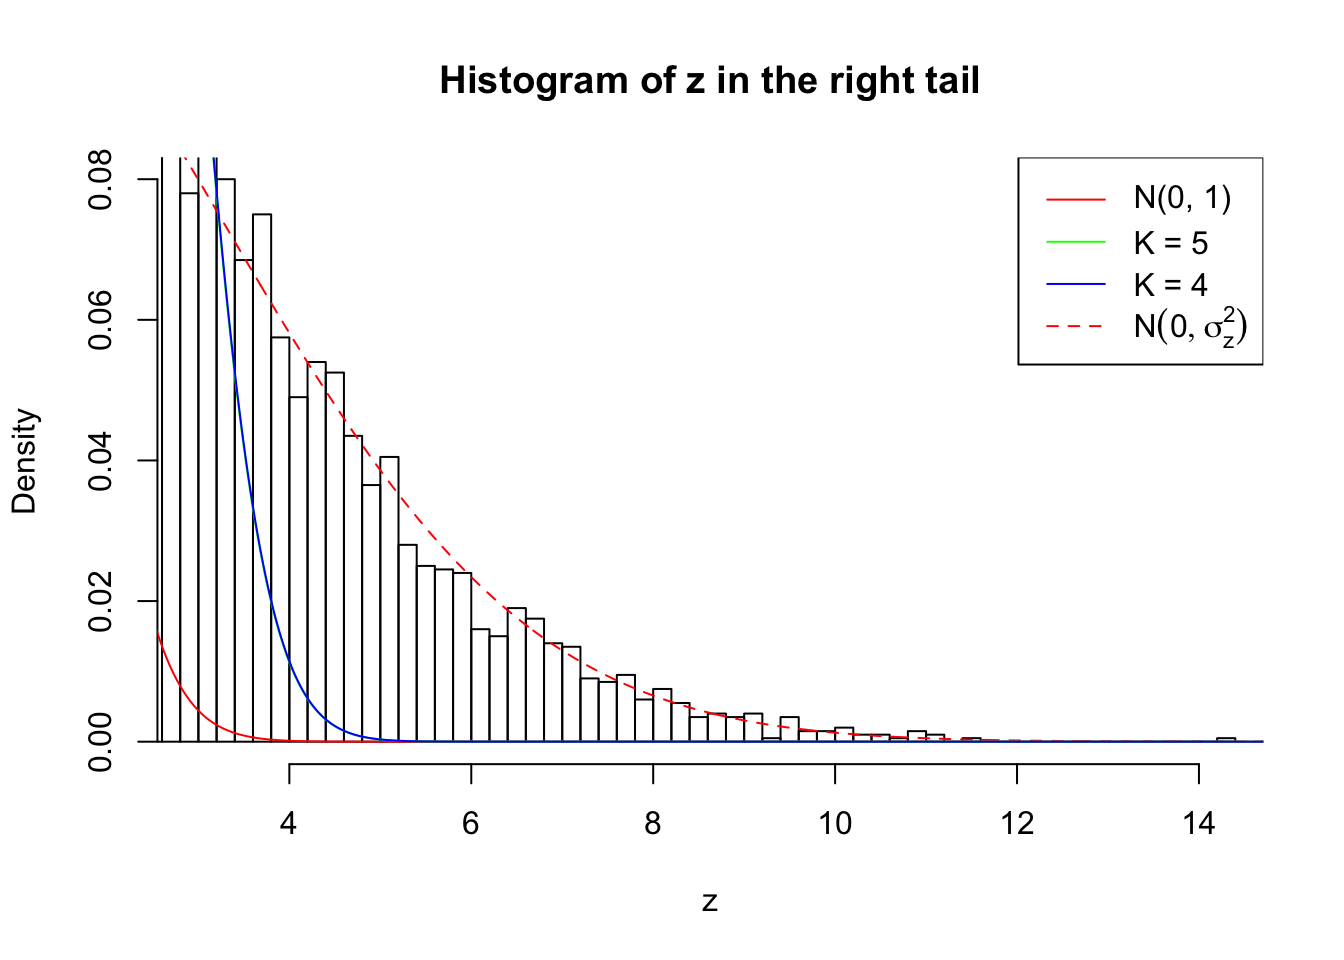
Example 4 :
SNR = 10 ;
True Distribution: N ( 0 , 11 ) ;
Number of Discoveries: 5066 ;
pihat0 = 0.0705596 ;
Log-likelihood by True Distribution N ( 0, 11 ) : -26197.01 ;
Log-likelihood by Gaussian Derivatives with K = 6 : -39090.32 ;
Log-likelihood Ratio between True Distribution N ( 0, 11 ) and Fitted Gaussian Derivatives with K = 6 : 12893.31 ;
Normalized Weights of Gaussian Derivatives with K = 6 :
1 : -0.00369120704032752 ; 2 : 3.12154933079295 ; 3 : -0.00365745072147679 ; 4 : 4.9296943766698 ; 5 : 0.00379751707834492 ; 6 : 2.90730030596267 ;
Log-likelihood by Gaussian Derivatives with K = 5 : -43985.54 ;
Log-likelihood Ratio between True Distribution N ( 0, 11 ) and Fitted Gaussian Derivatives with K = 5 : 17788.53 ;
Normalized Weights of Gaussian Derivatives with K = 5 :
1 : -0.00978192326482823 ; 2 : 2.25189648665813 ; 3 : -0.00479443179567208 ; 4 : 1.84445913631995 ; 5 : 0.0167719092761371 ; 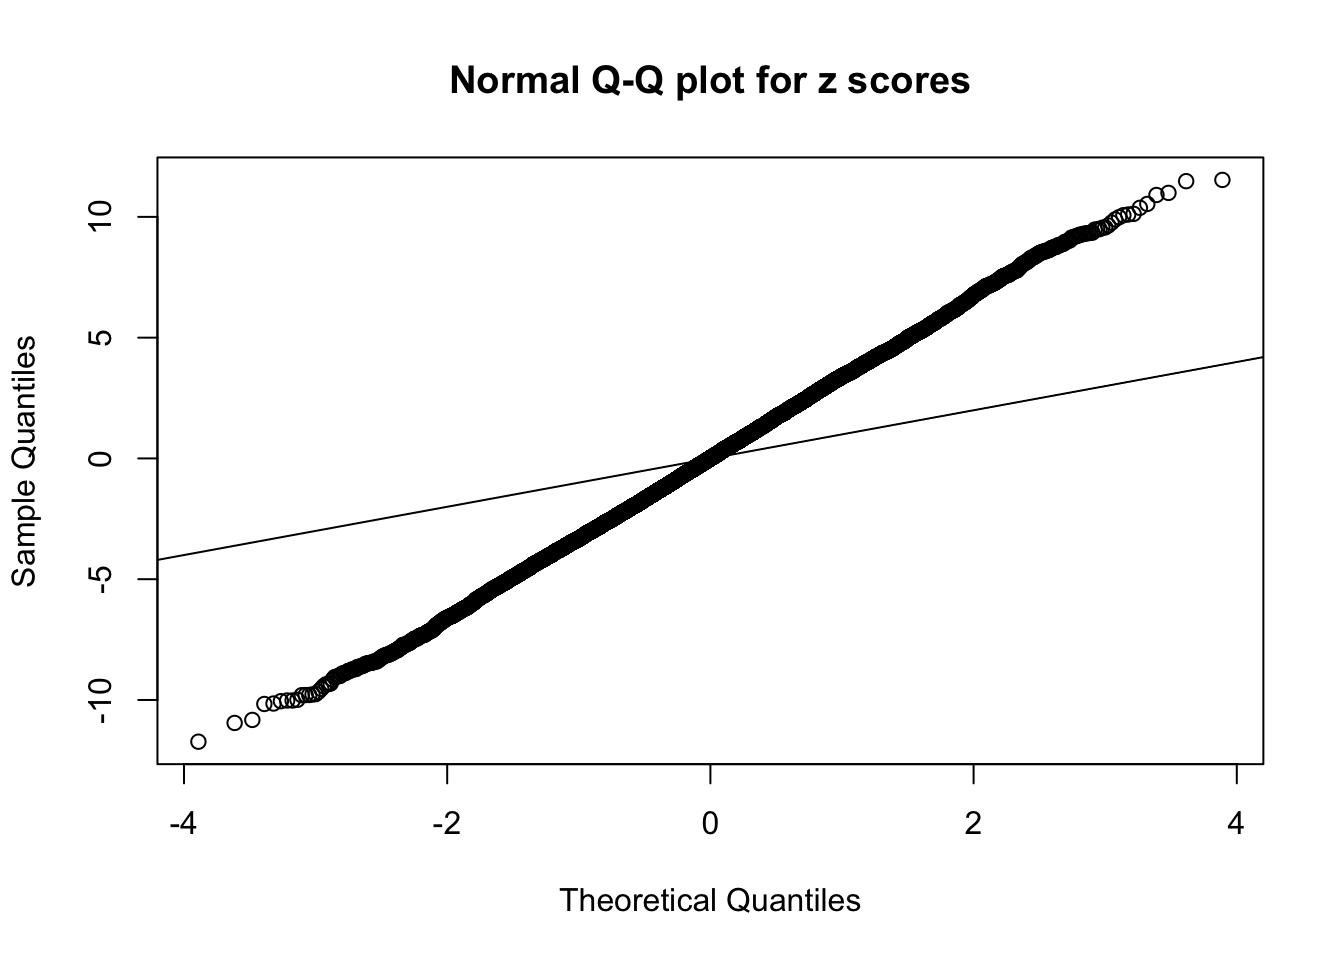


Zoom in to the left tail: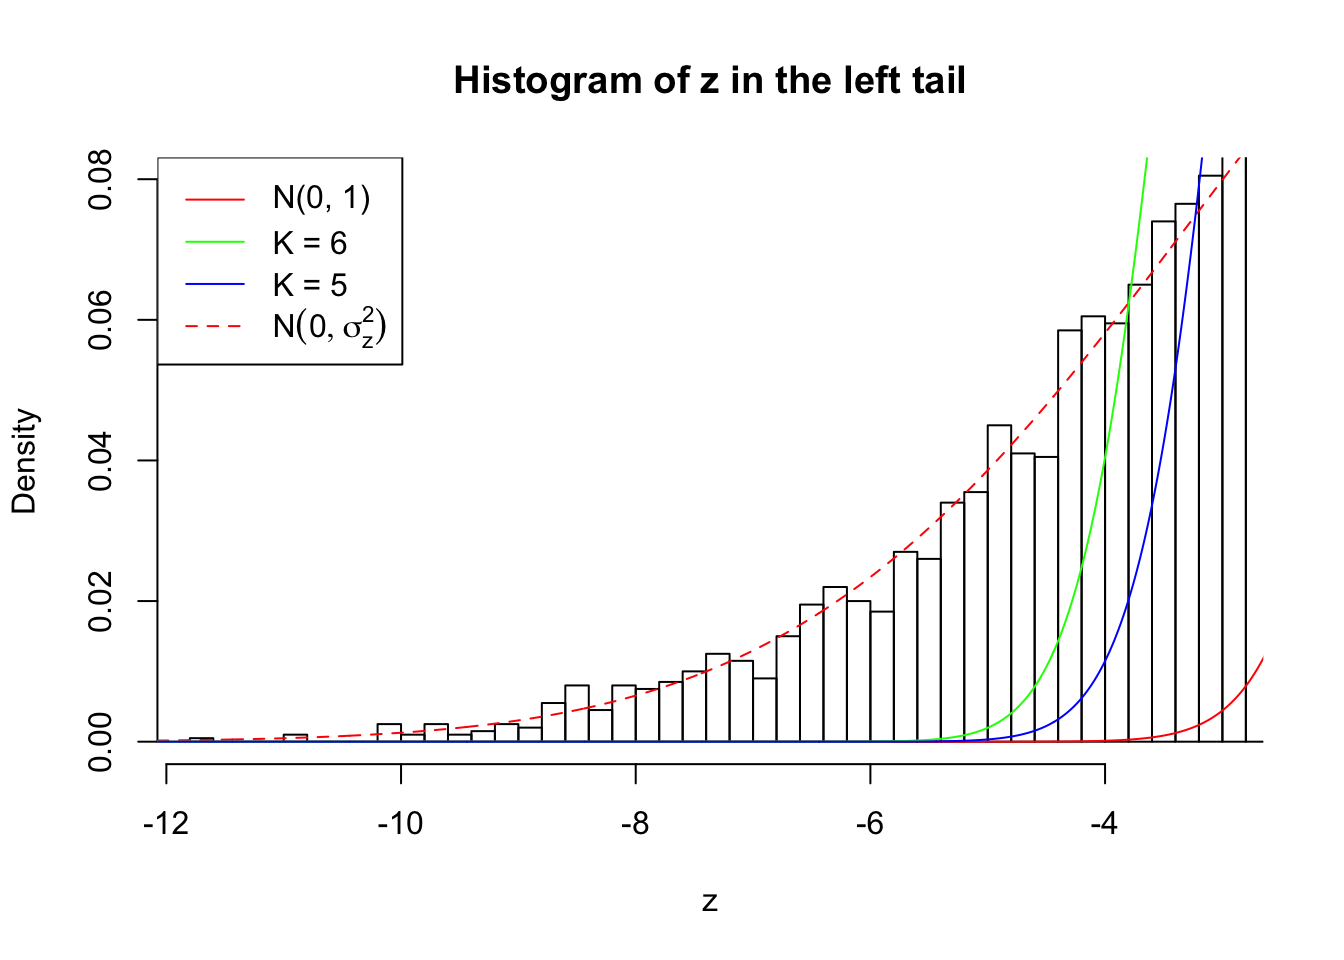
Zoom in to the right tail: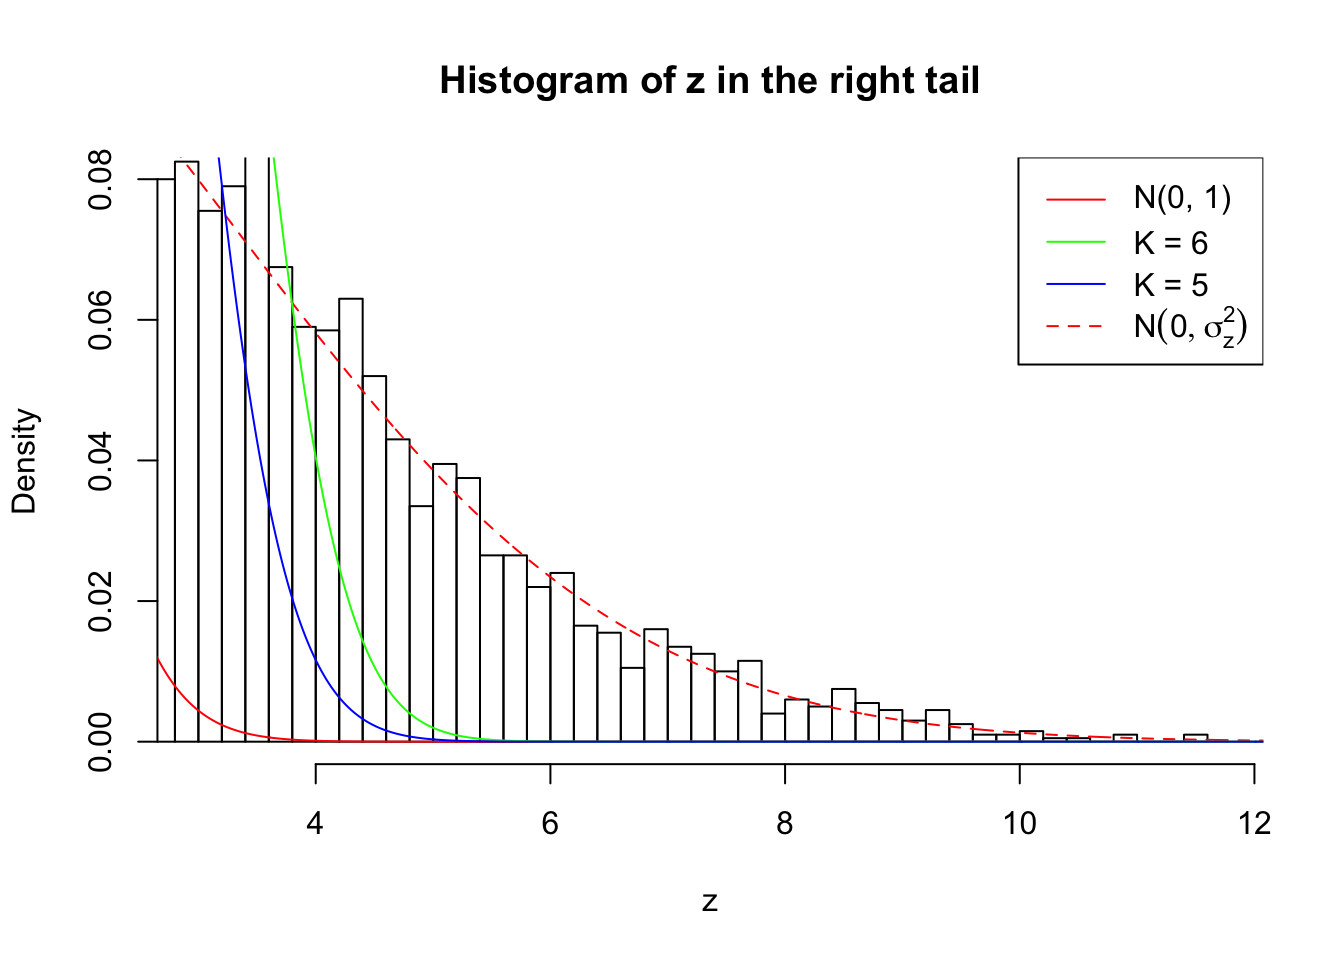
Example 5 :
SNR = 10 ;
True Distribution: N ( 0 , 11 ) ;
Number of Discoveries: 4924 ;
pihat0 = 0.08210577 ;
Log-likelihood by True Distribution N ( 0, 11 ) : -26103.44 ;
Log-likelihood by Gaussian Derivatives with K = 5 : -43511.18 ;
Log-likelihood Ratio between True Distribution N ( 0, 11 ) and Fitted Gaussian Derivatives with K = 5 : 17407.74 ;
Normalized Weights of Gaussian Derivatives with K = 5 :
1 : -0.0169044216000957 ; 2 : 2.21803447163974 ; 3 : -0.0170247648783184 ; 4 : 1.82679005604263 ; 5 : -0.000477147476056258 ;
Log-likelihood by Gaussian Derivatives with K = 4 : -43511.18 ;
Log-likelihood Ratio between True Distribution N ( 0, 11 ) and Fitted Gaussian Derivatives with K = 4 : 17407.74 ;
Normalized Weights of Gaussian Derivatives with K = 4 :
1 : -0.0168231555661593 ; 2 : 2.21803546066004 ; 3 : -0.01661630451235 ; 4 : 1.82679077771681 ; 

Zoom in to the left tail: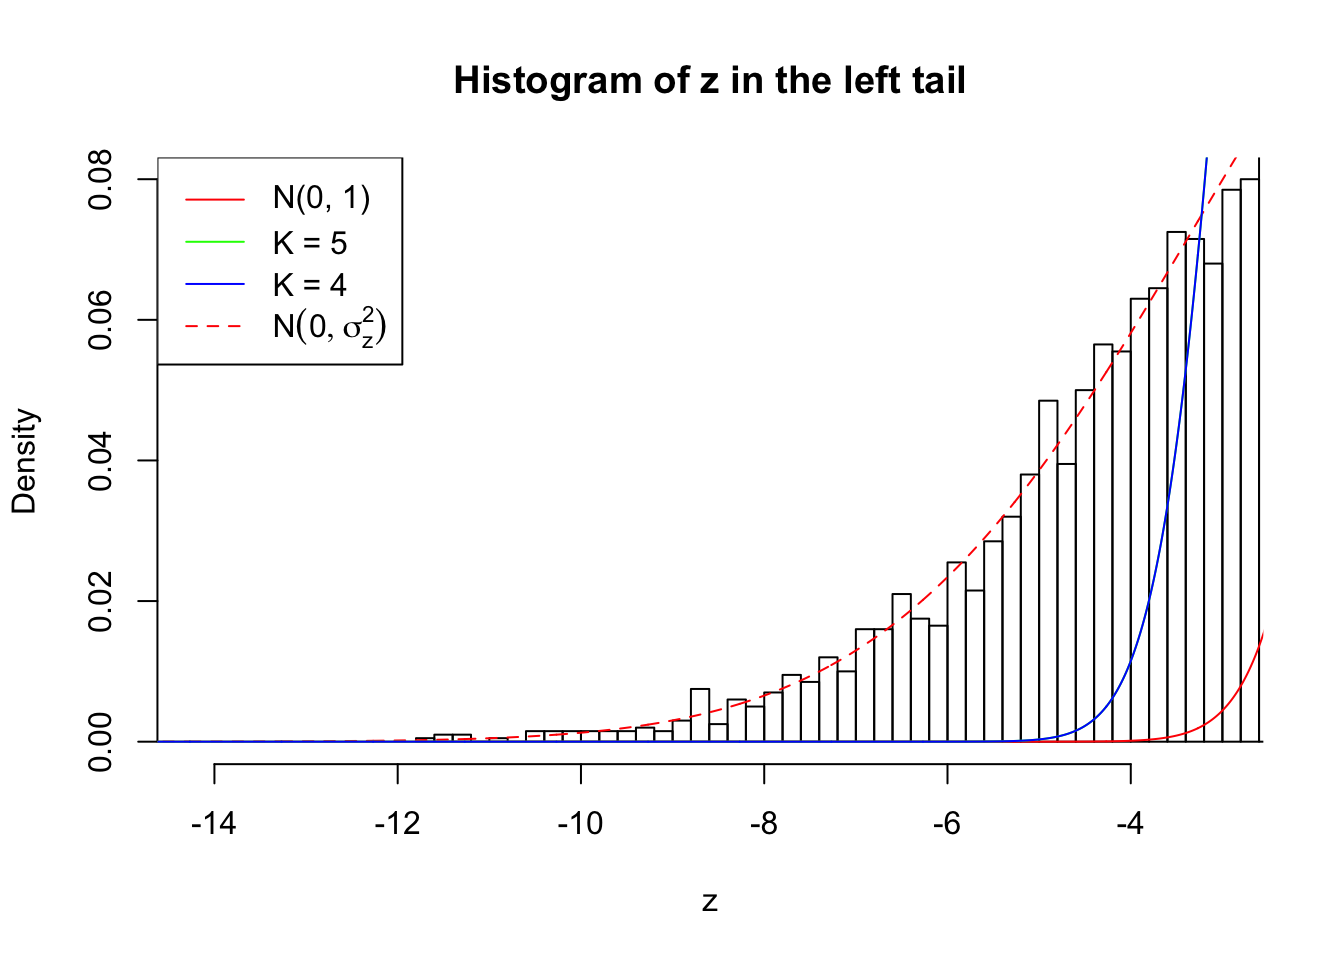
Zoom in to the right tail: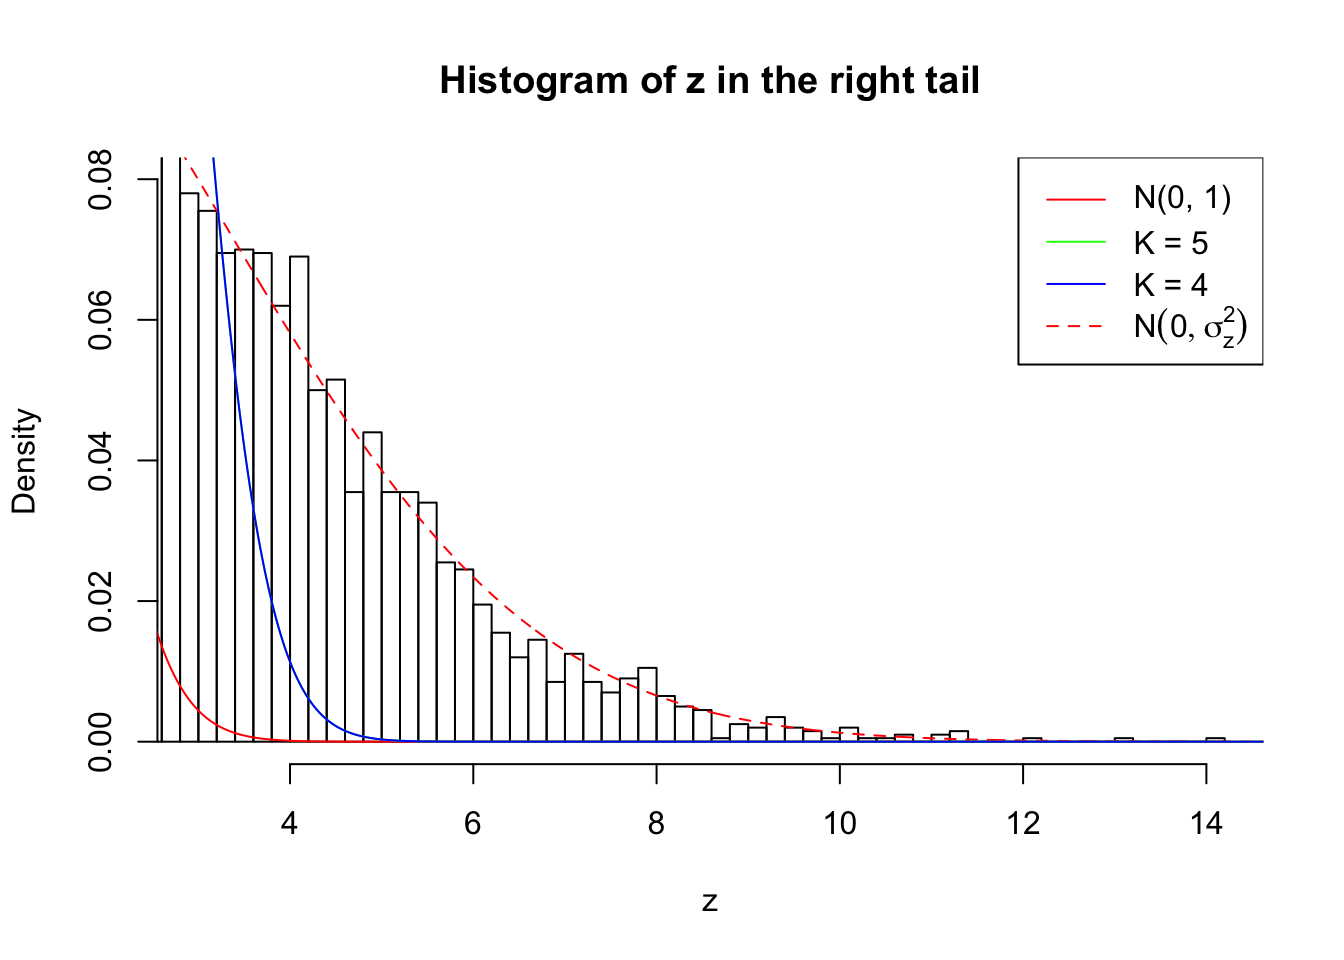
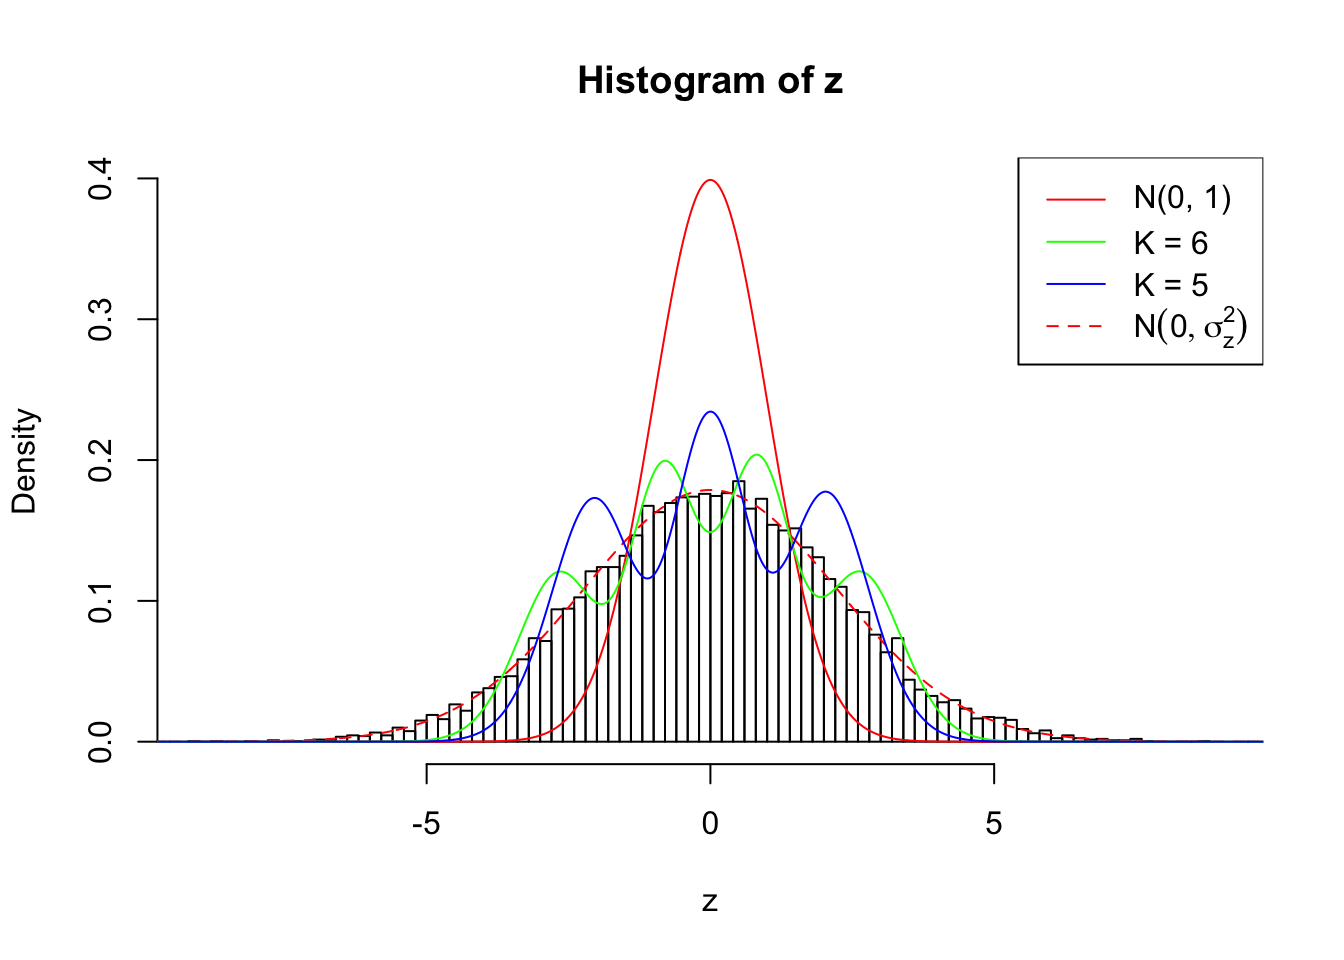
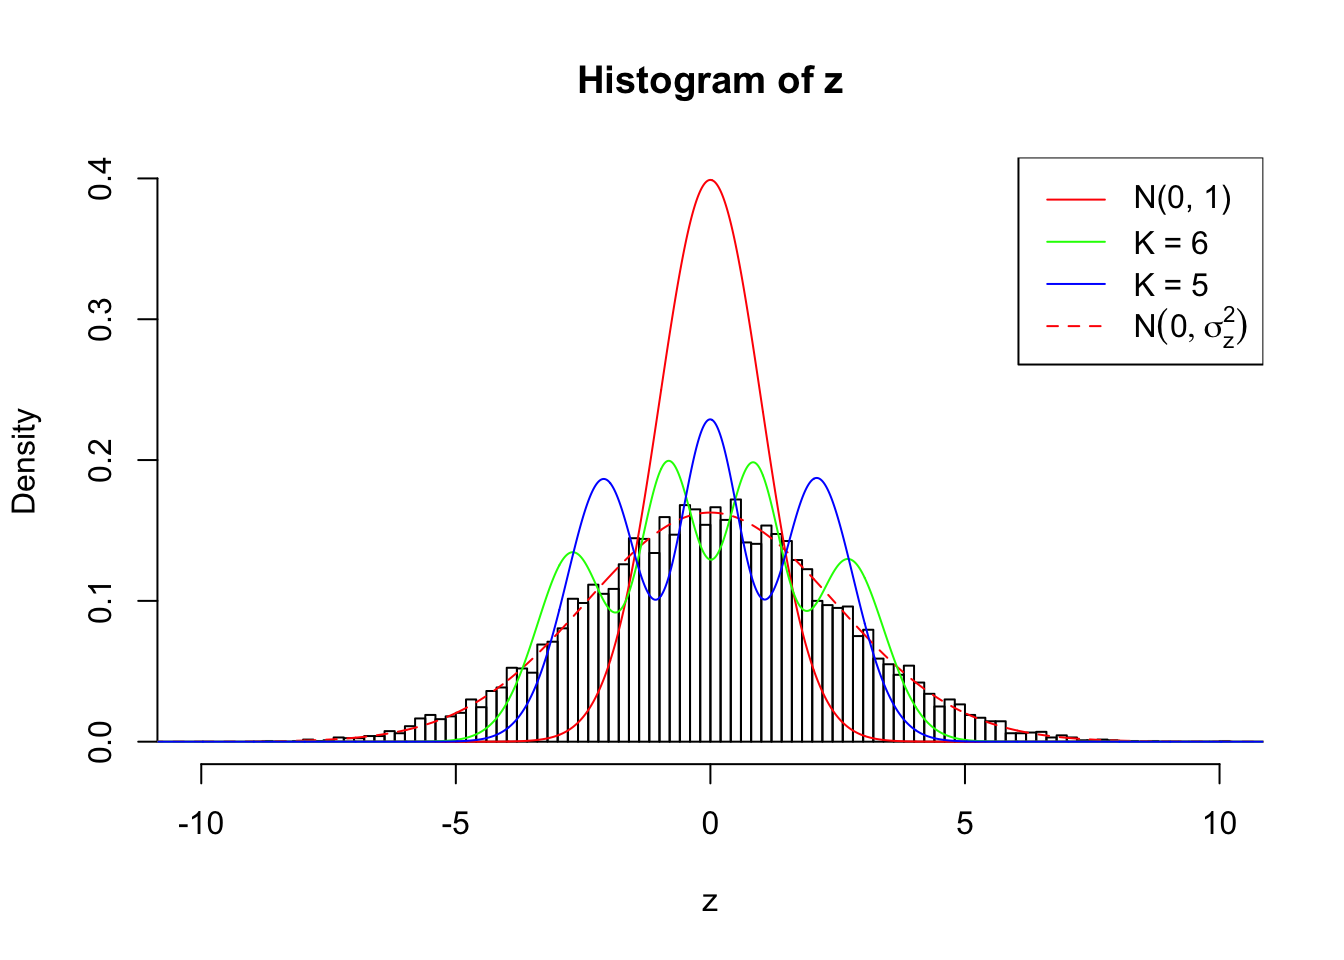
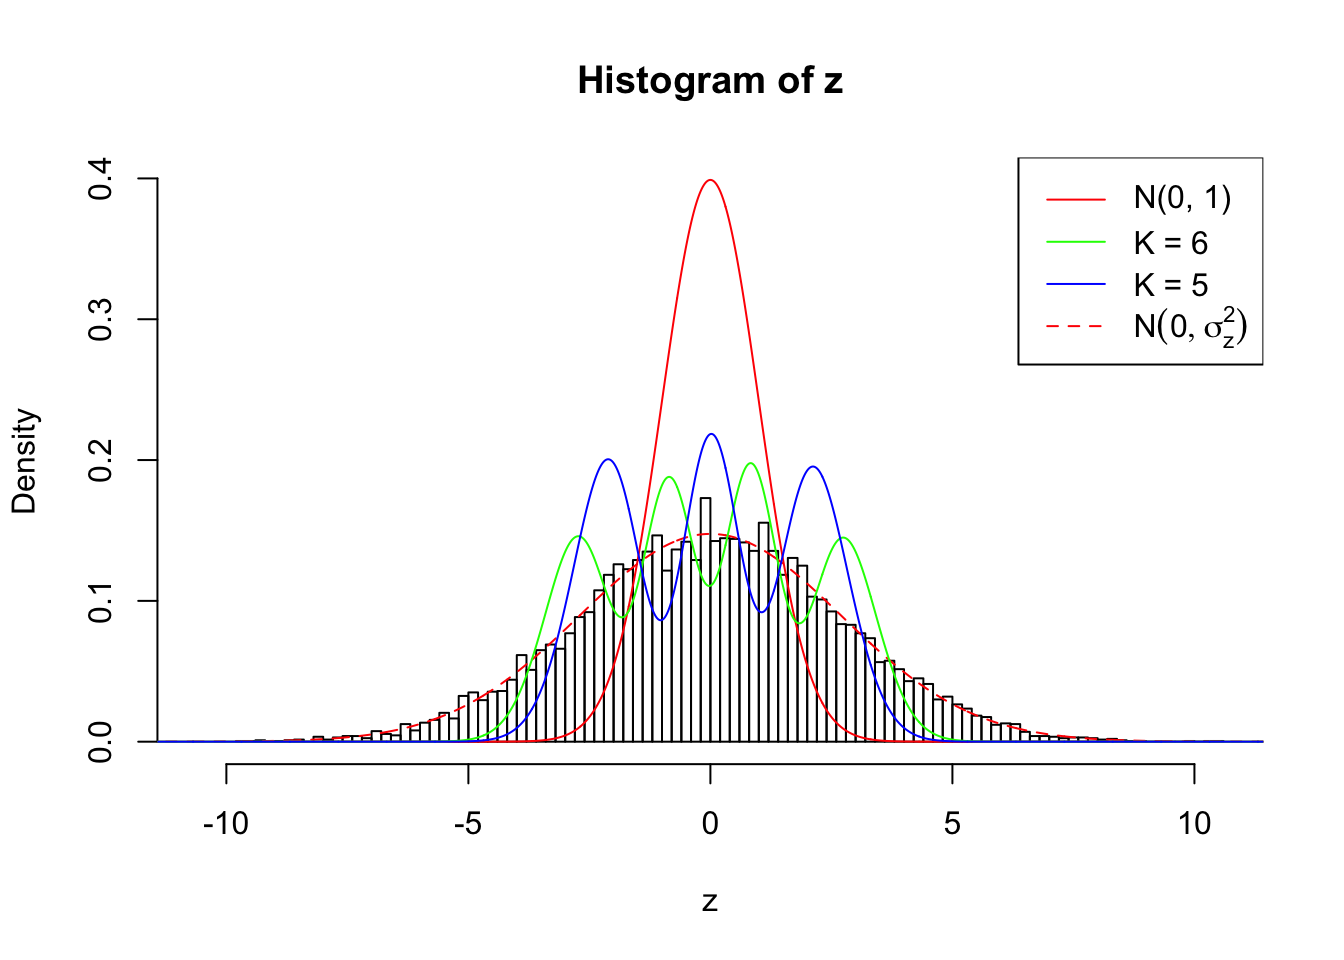
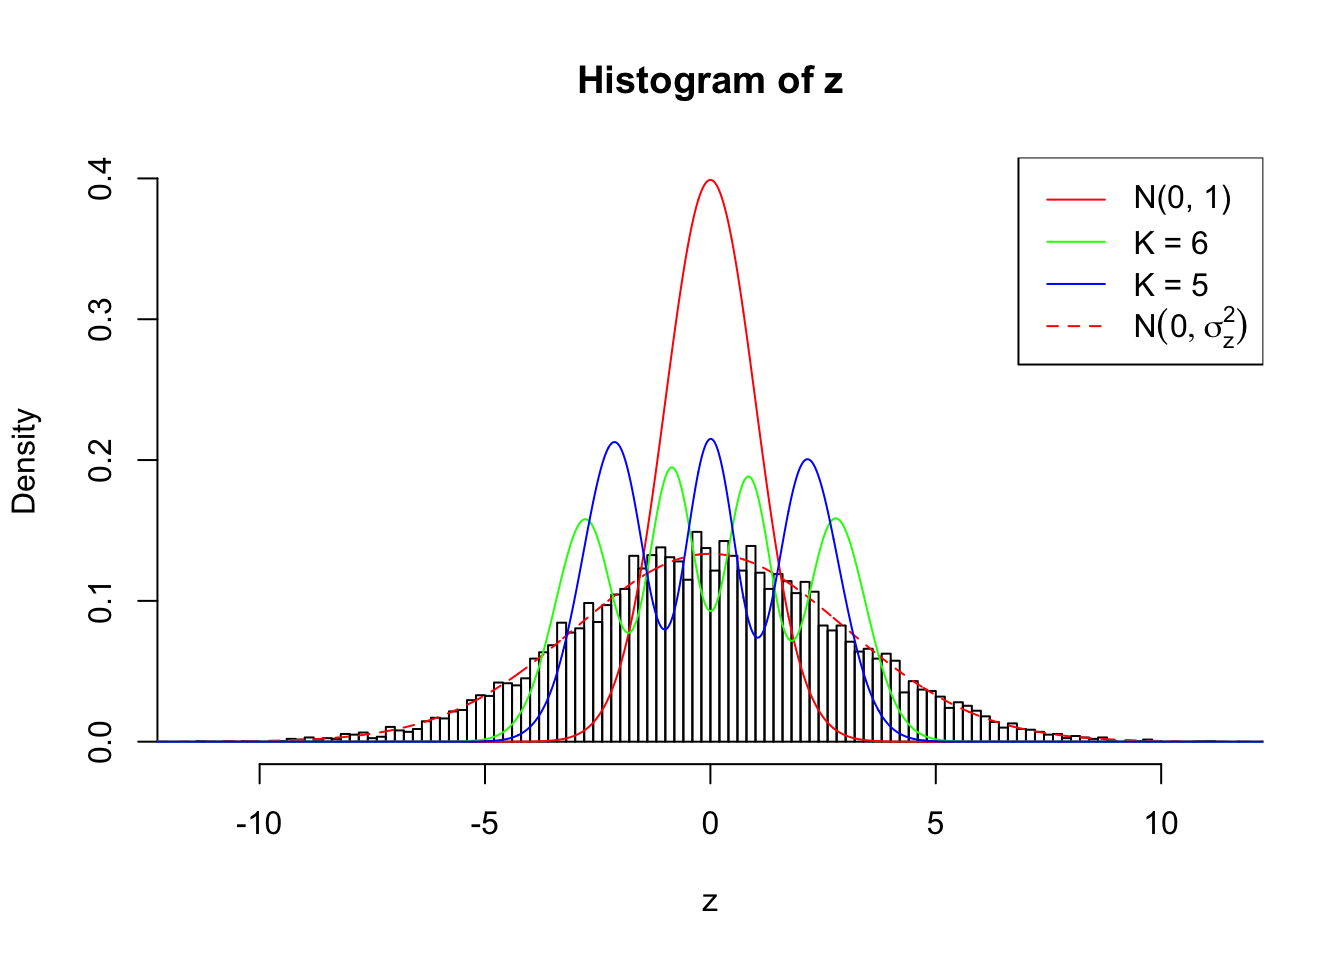
Conclusion
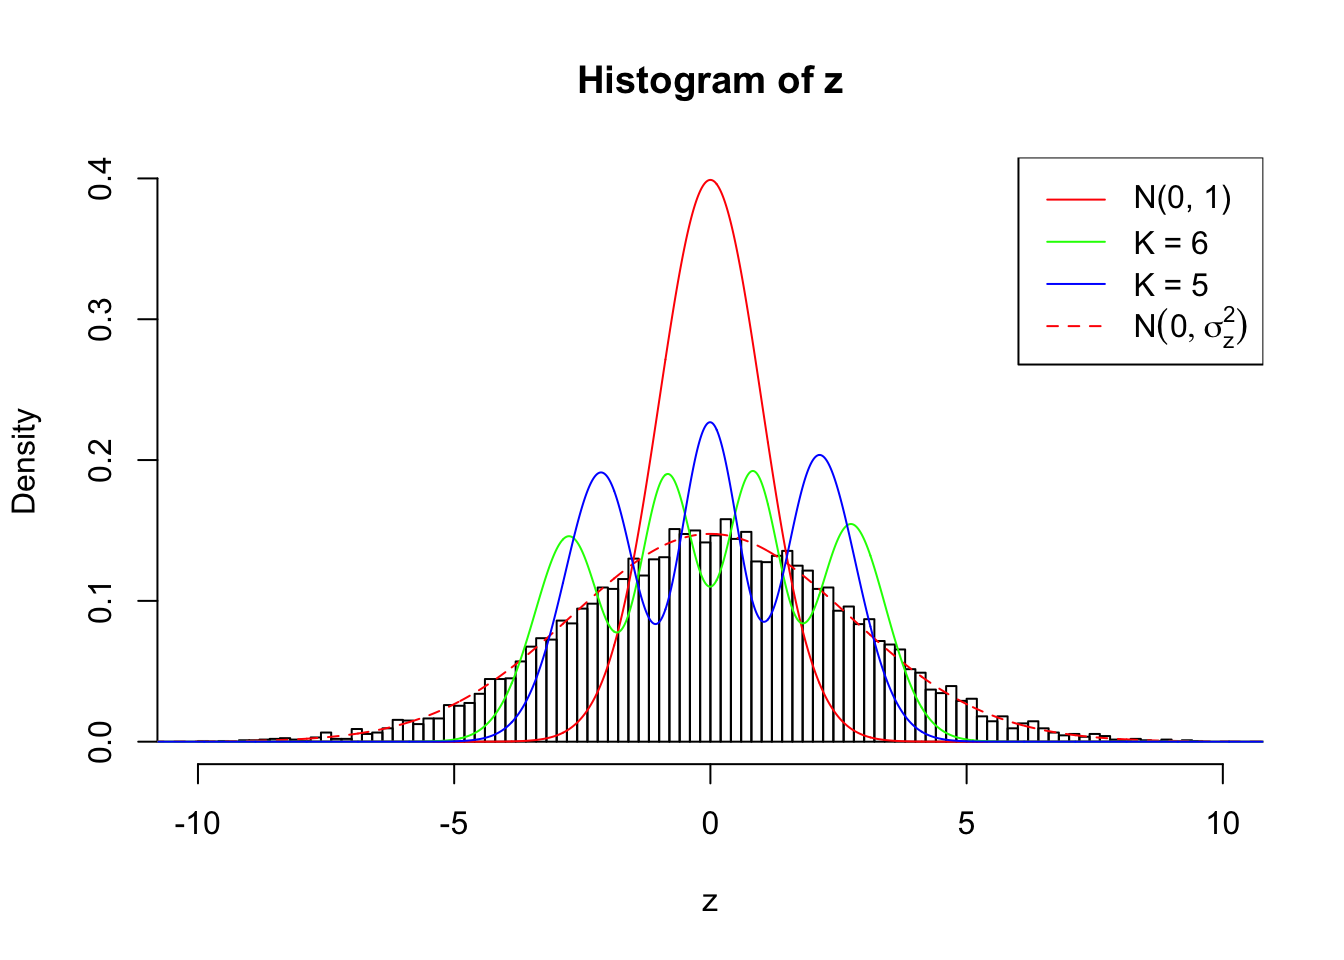
As soon as SNR is increasing, the Gaussian derivatives stop fitting well. The weights don’t look reasonable, and the fitting in tails is especially bad.
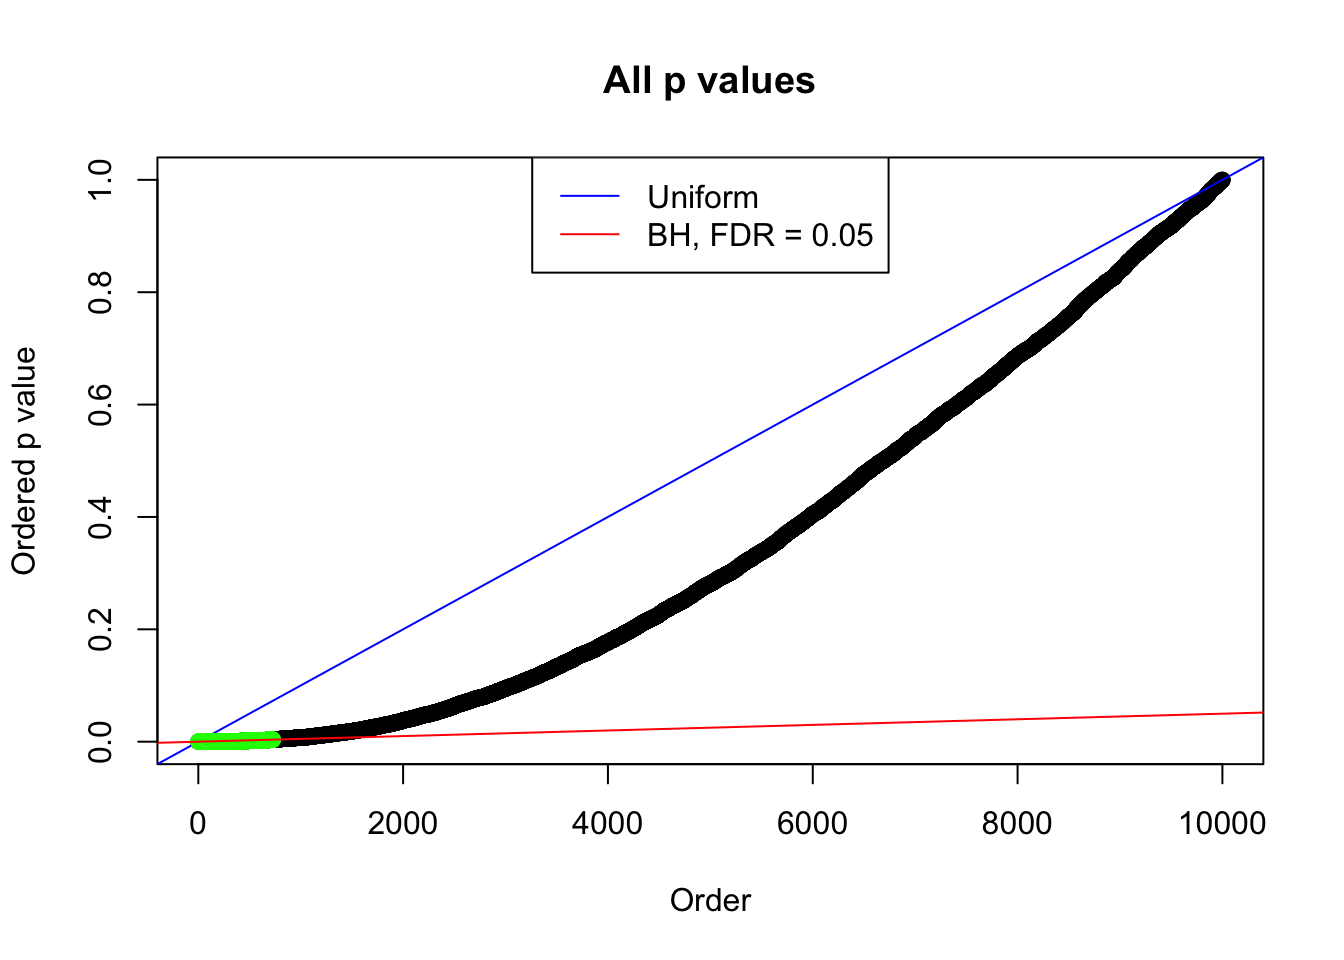
It indicates that this method can identify deviation of the empirical distribution from the standard normal caused by correlated null from that caused by true effects when the effects are large.
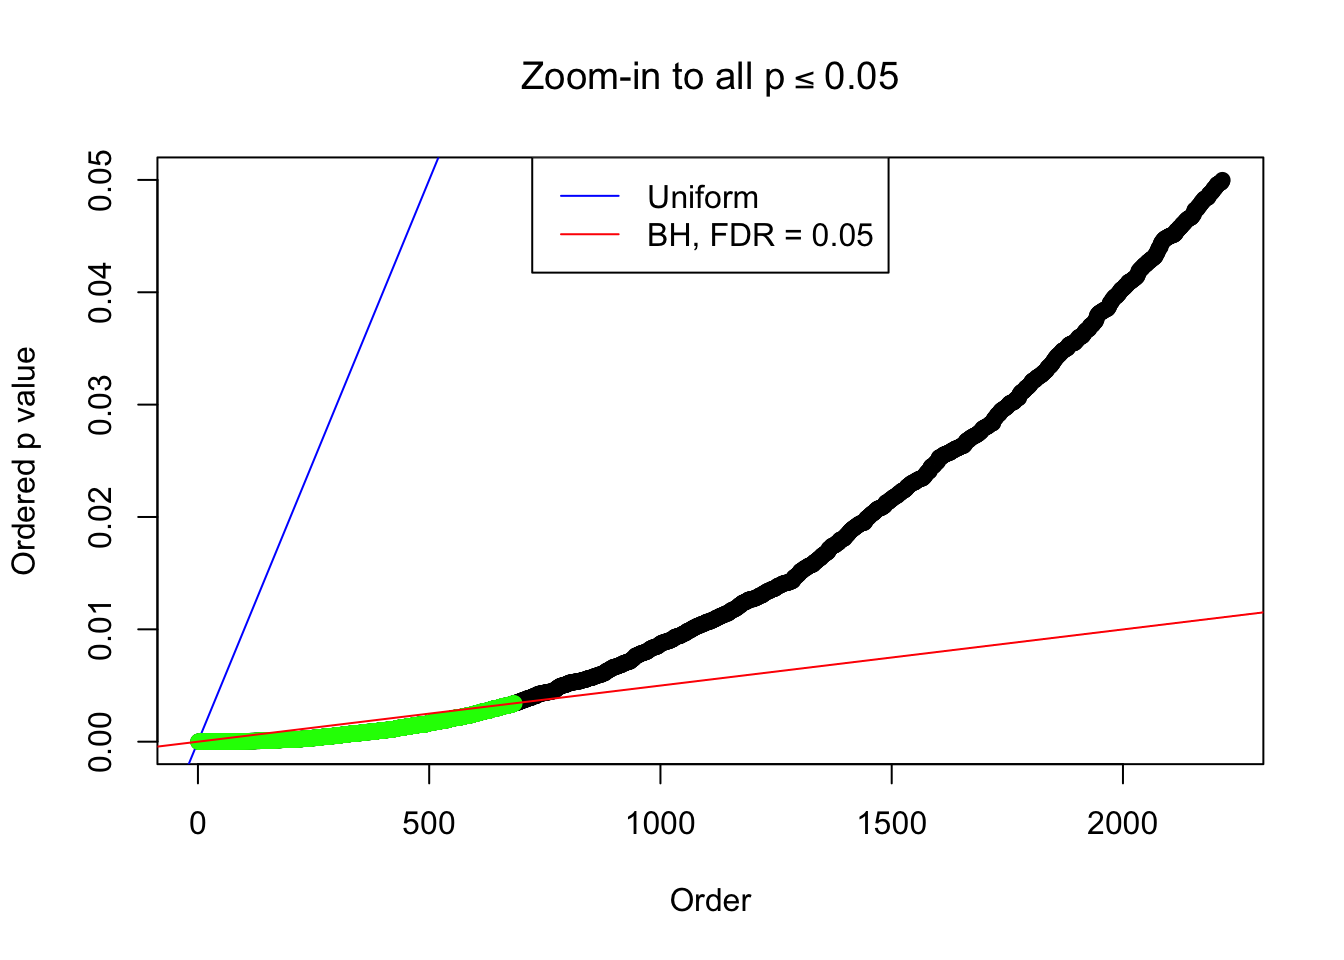
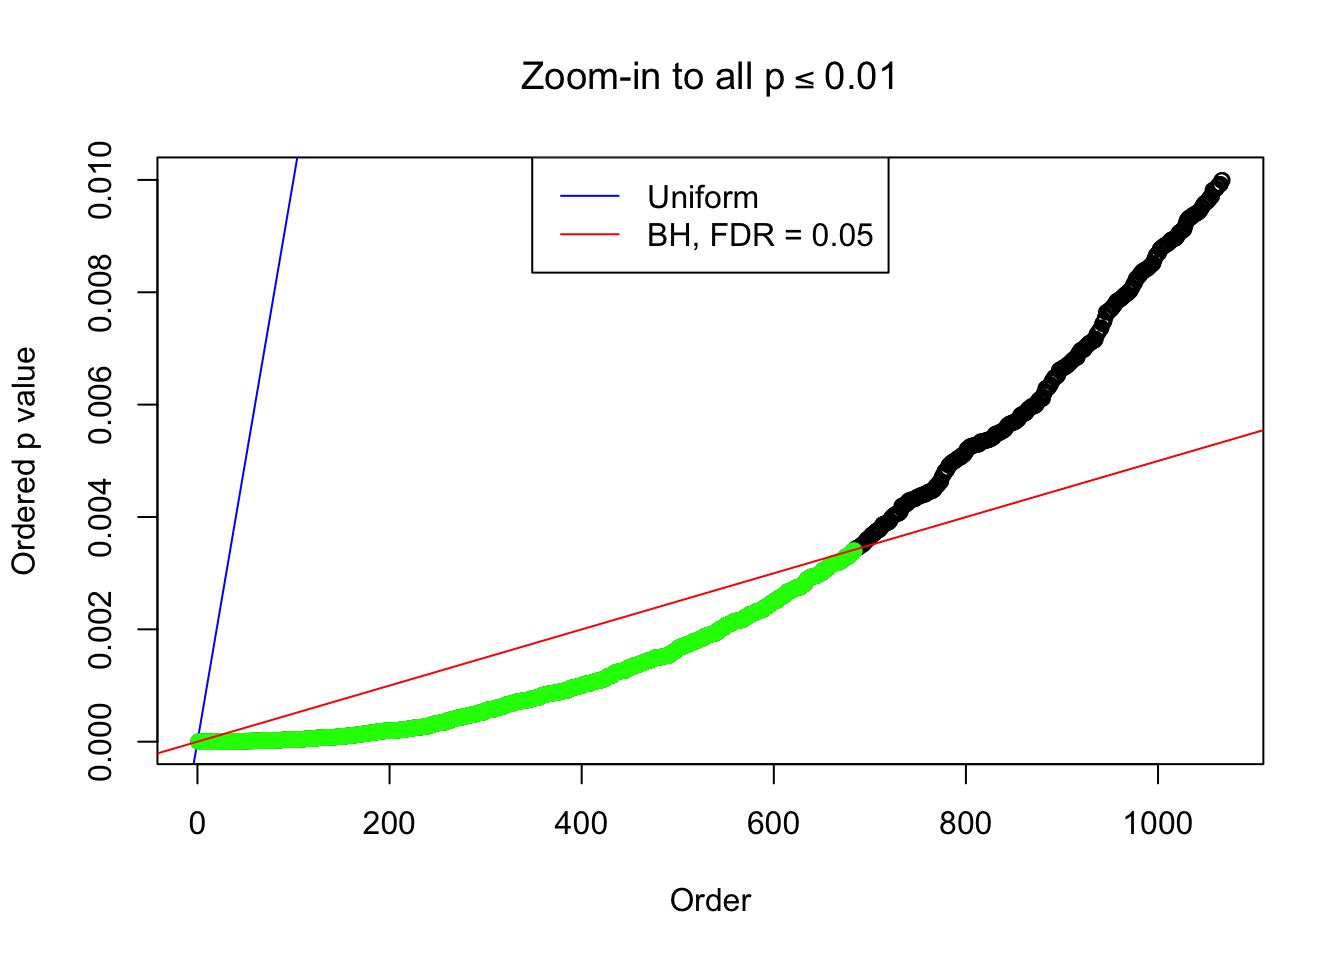
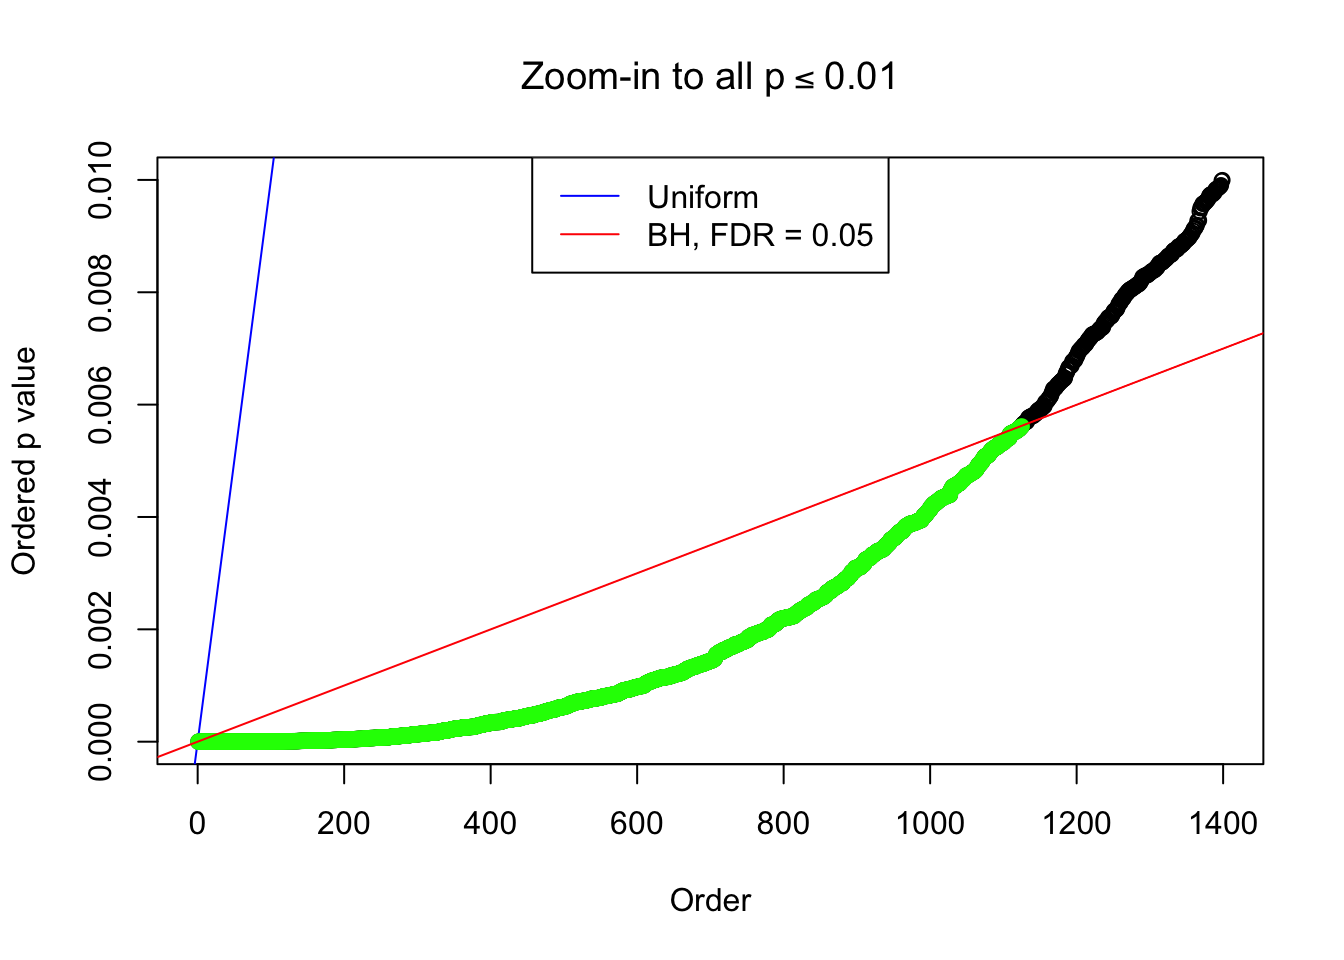
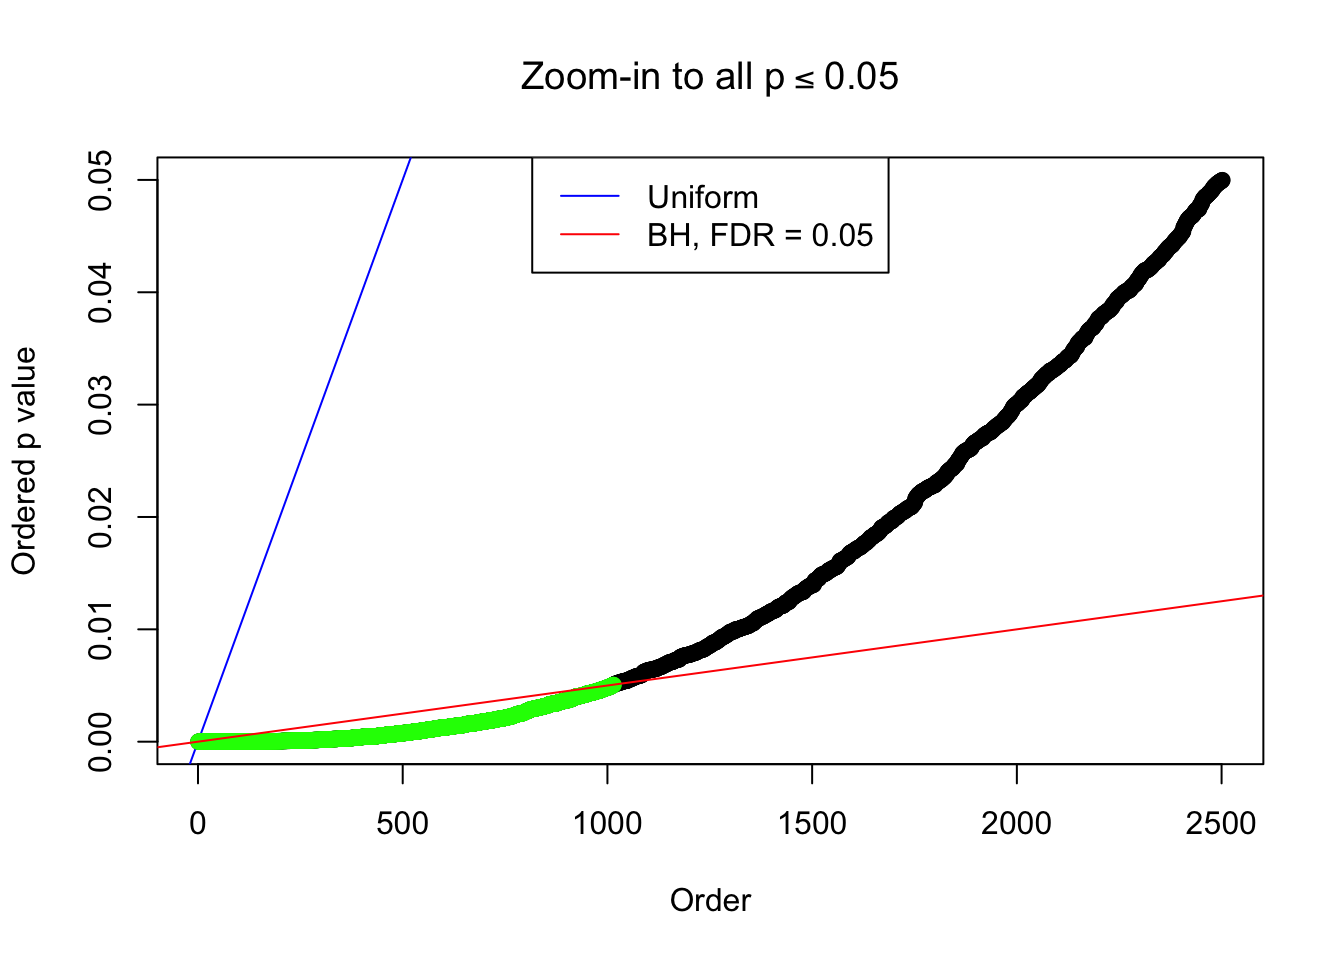
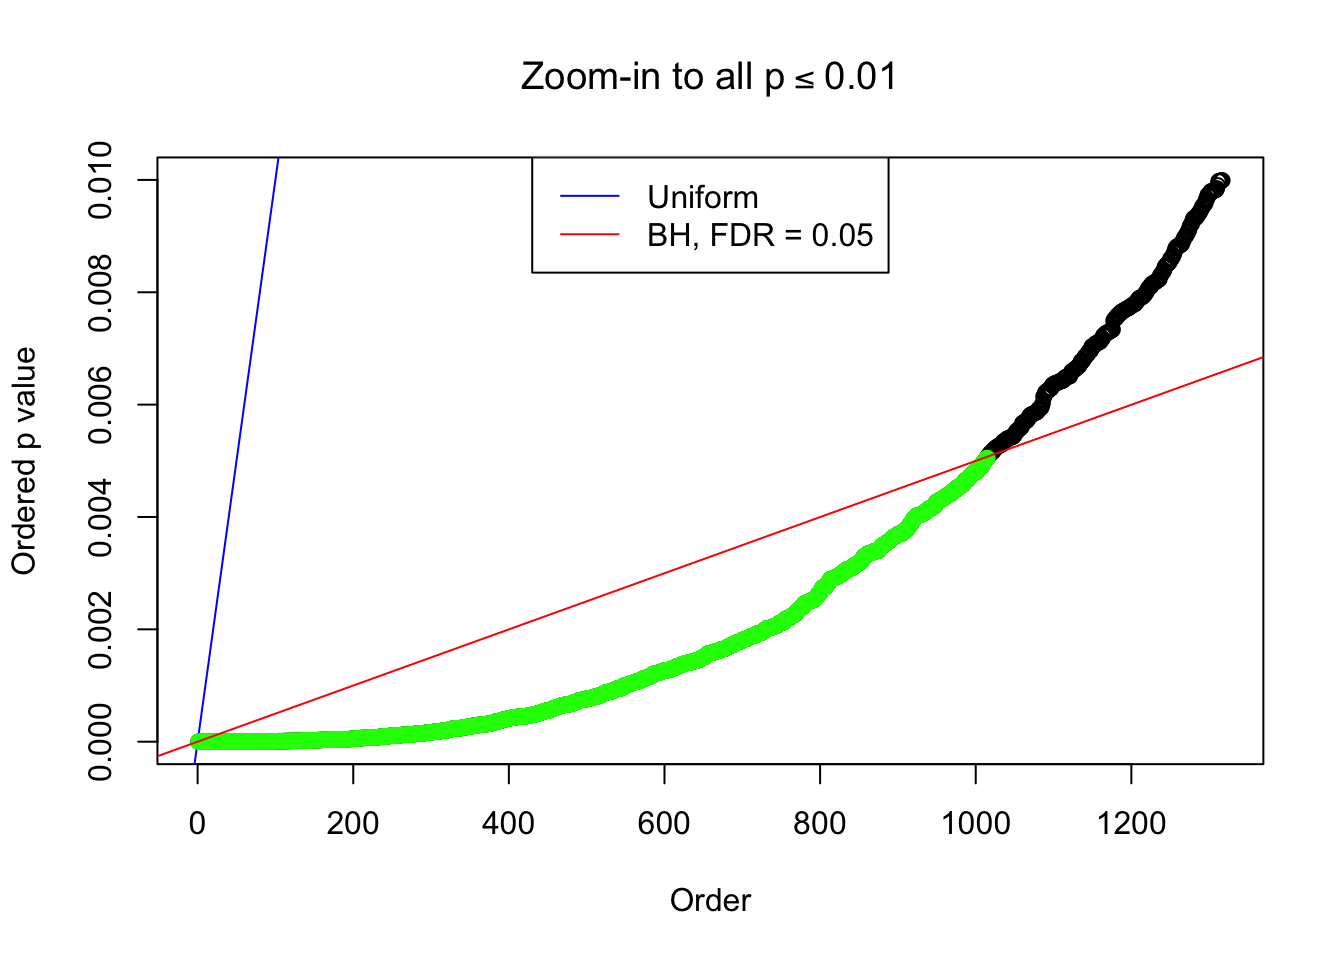
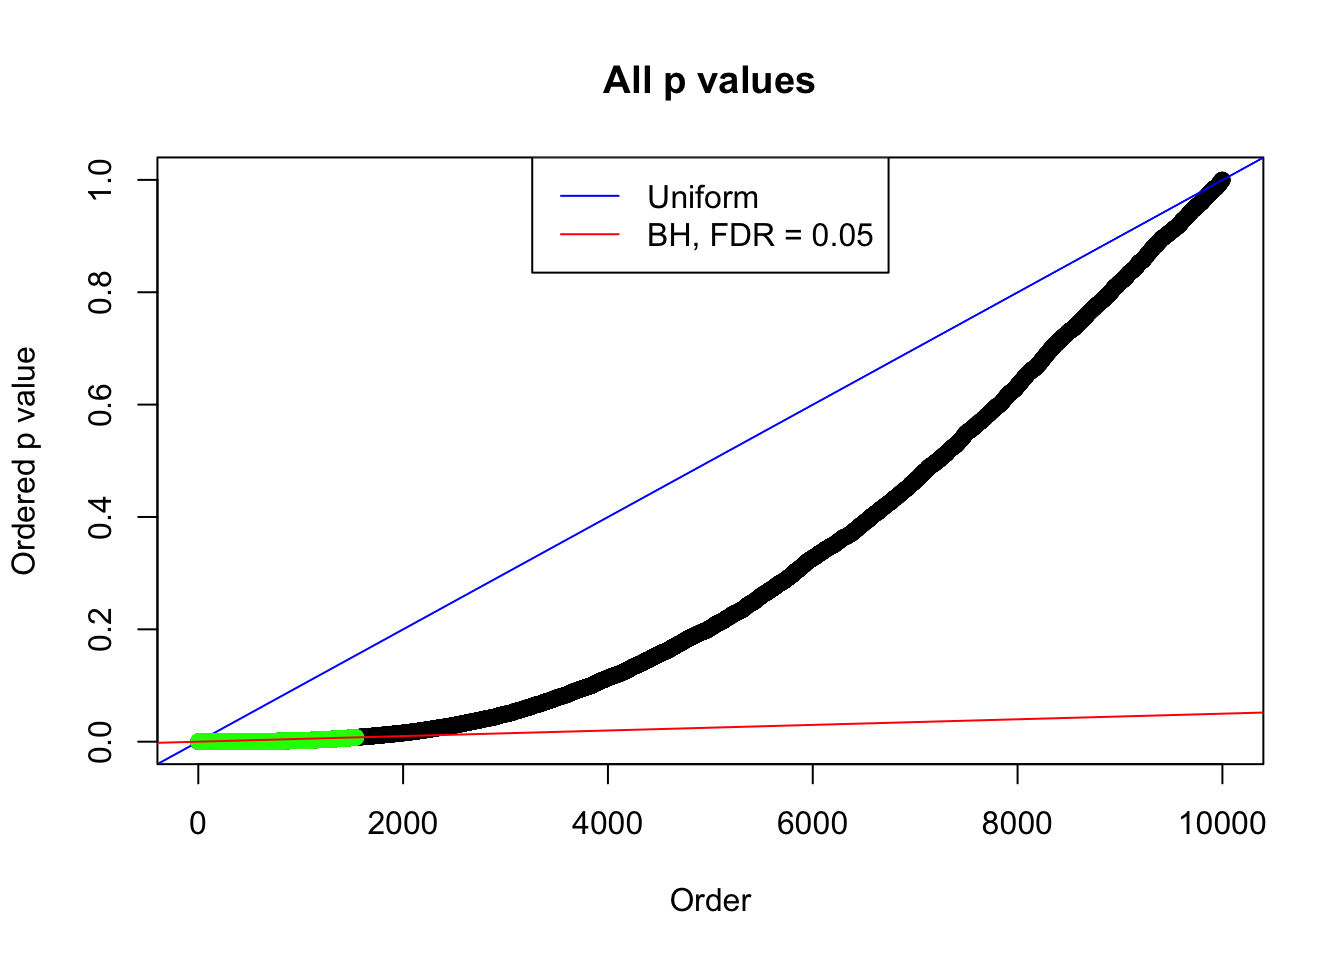
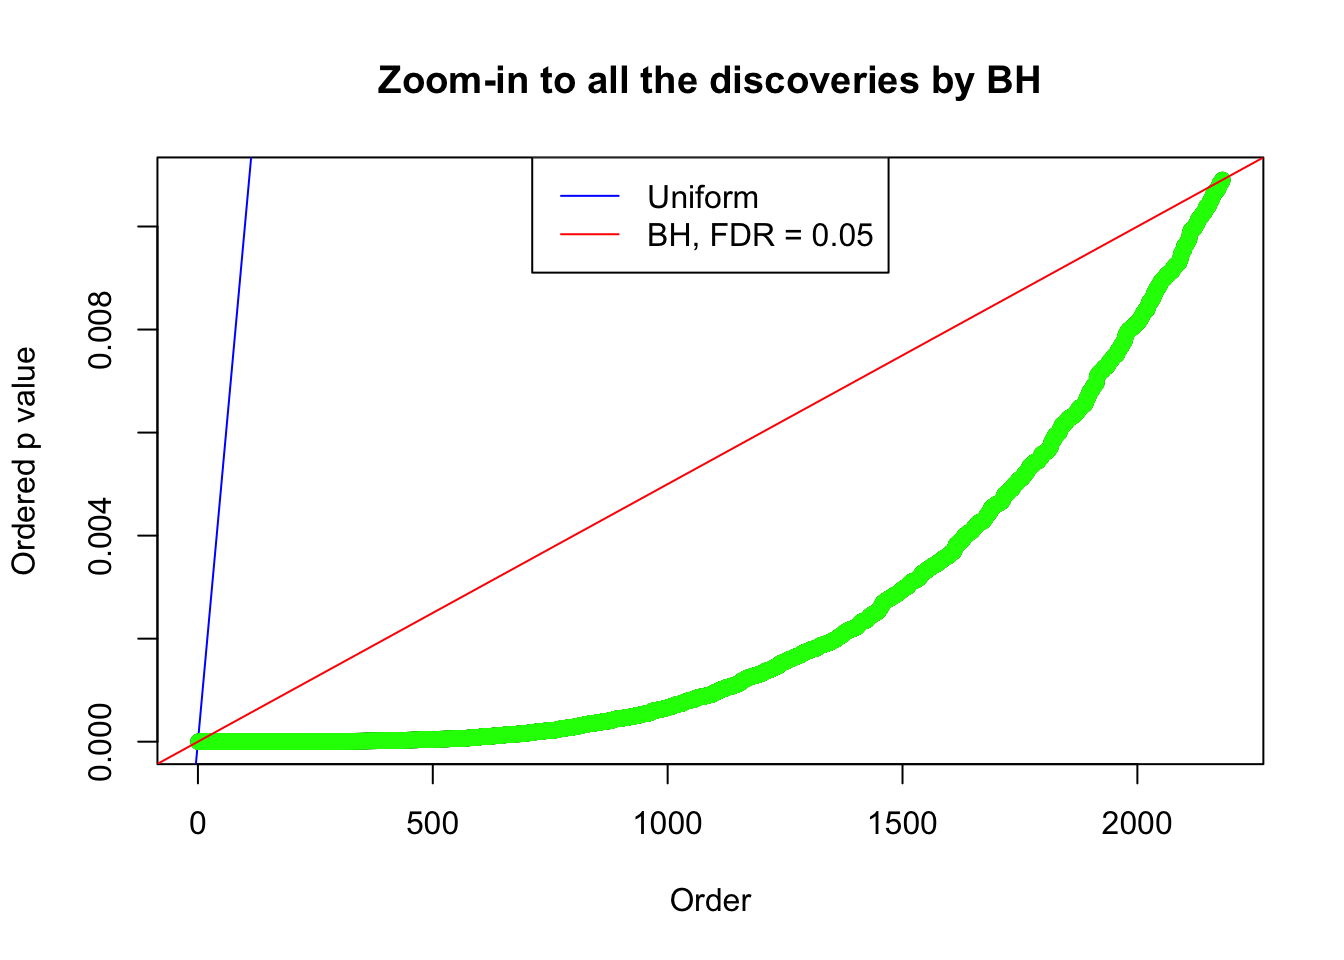
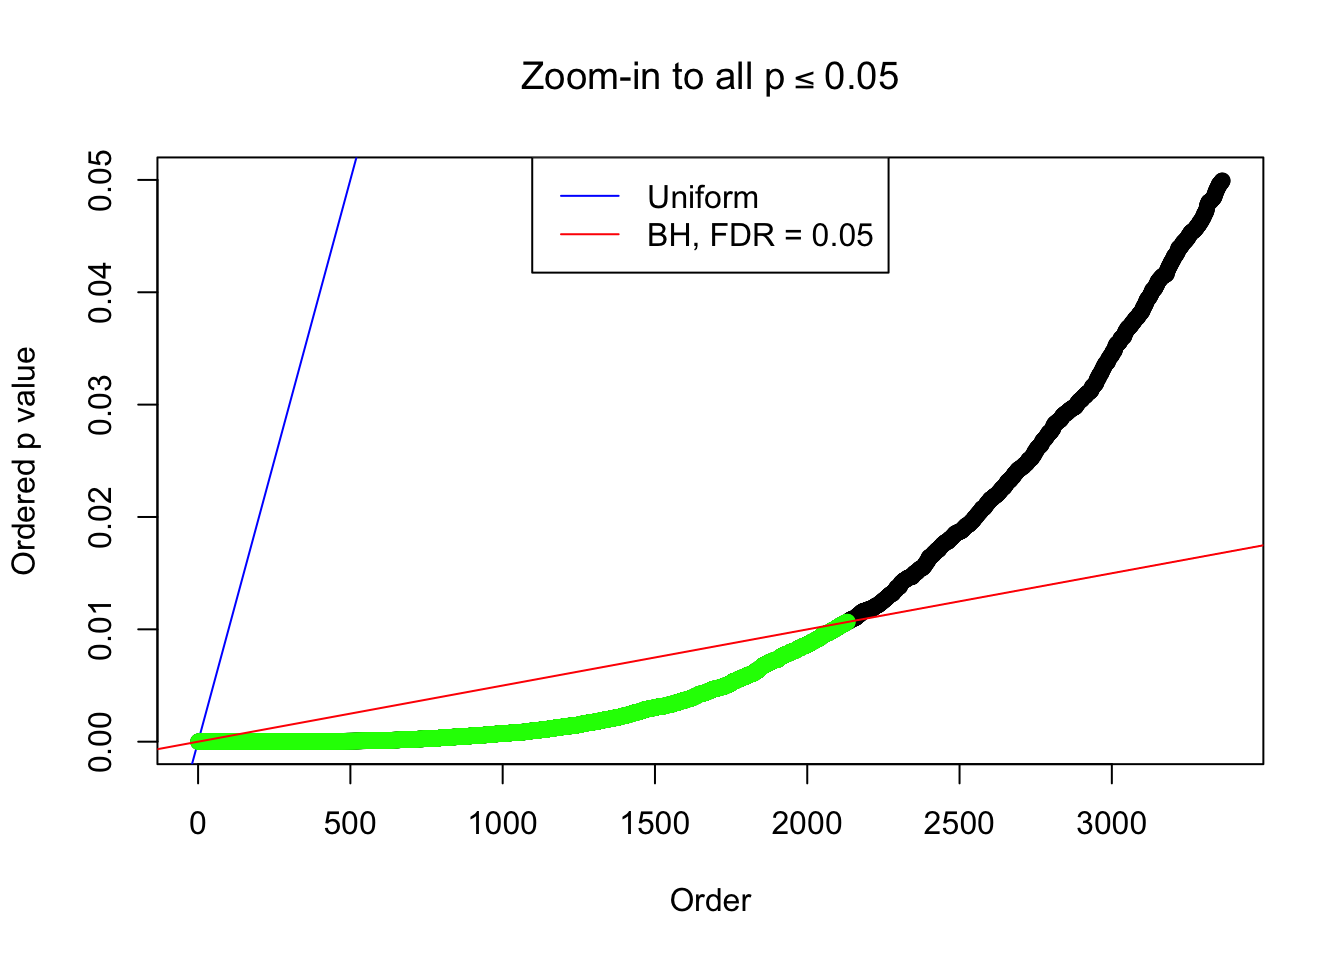
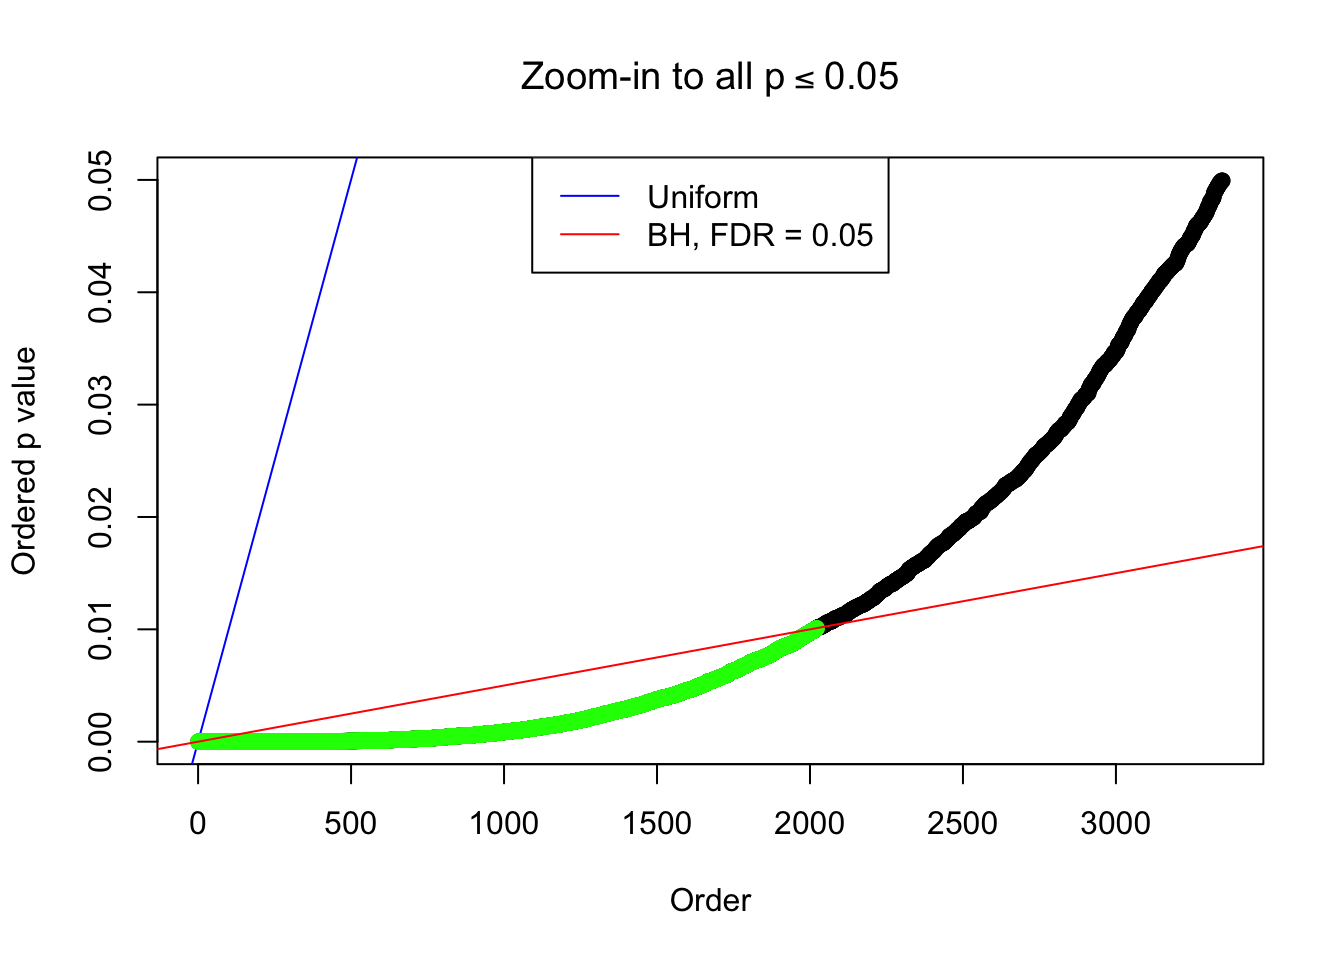
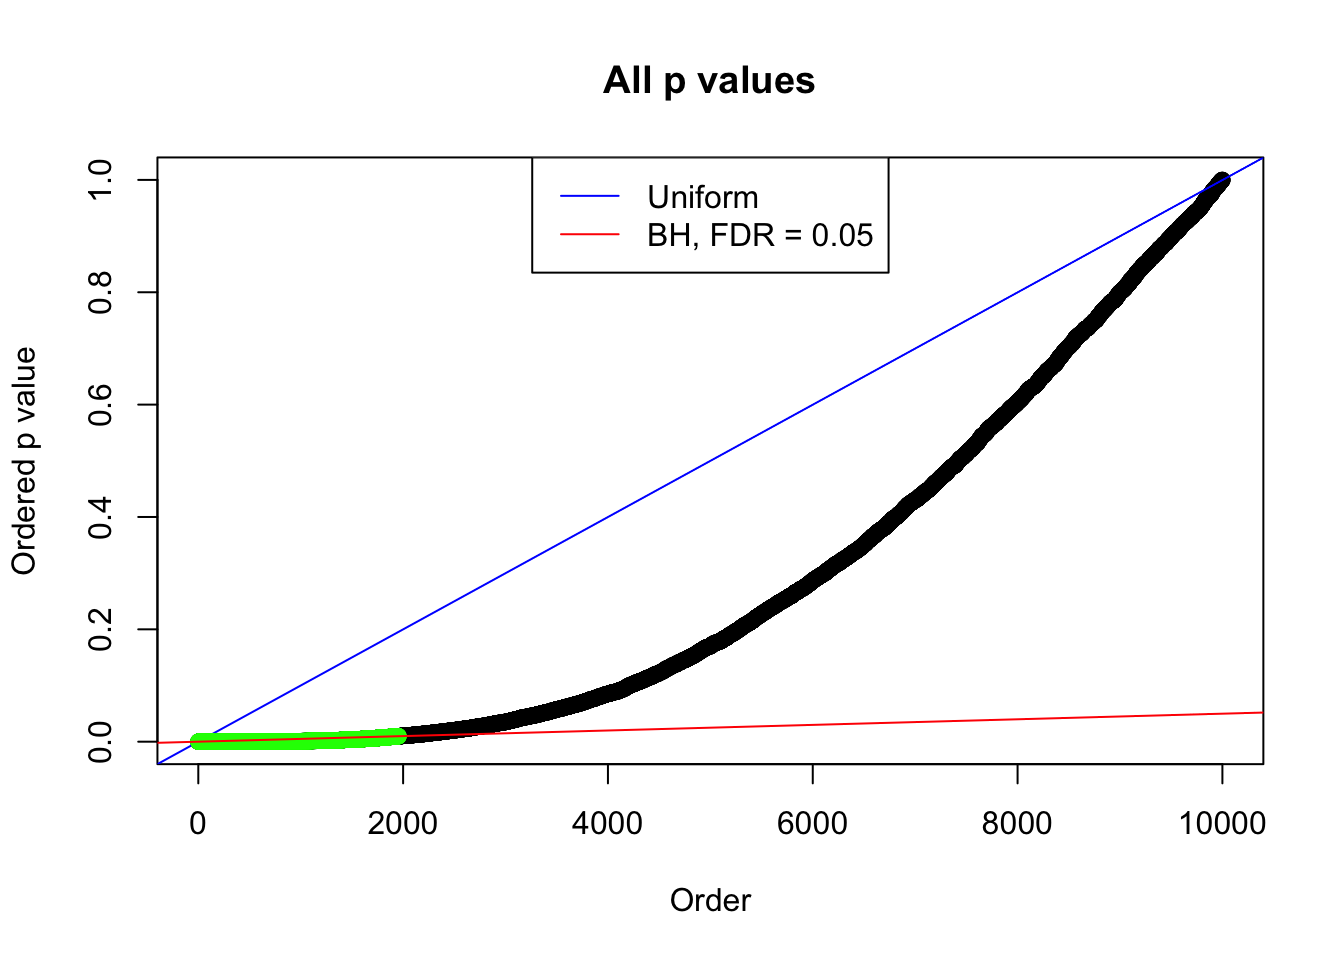
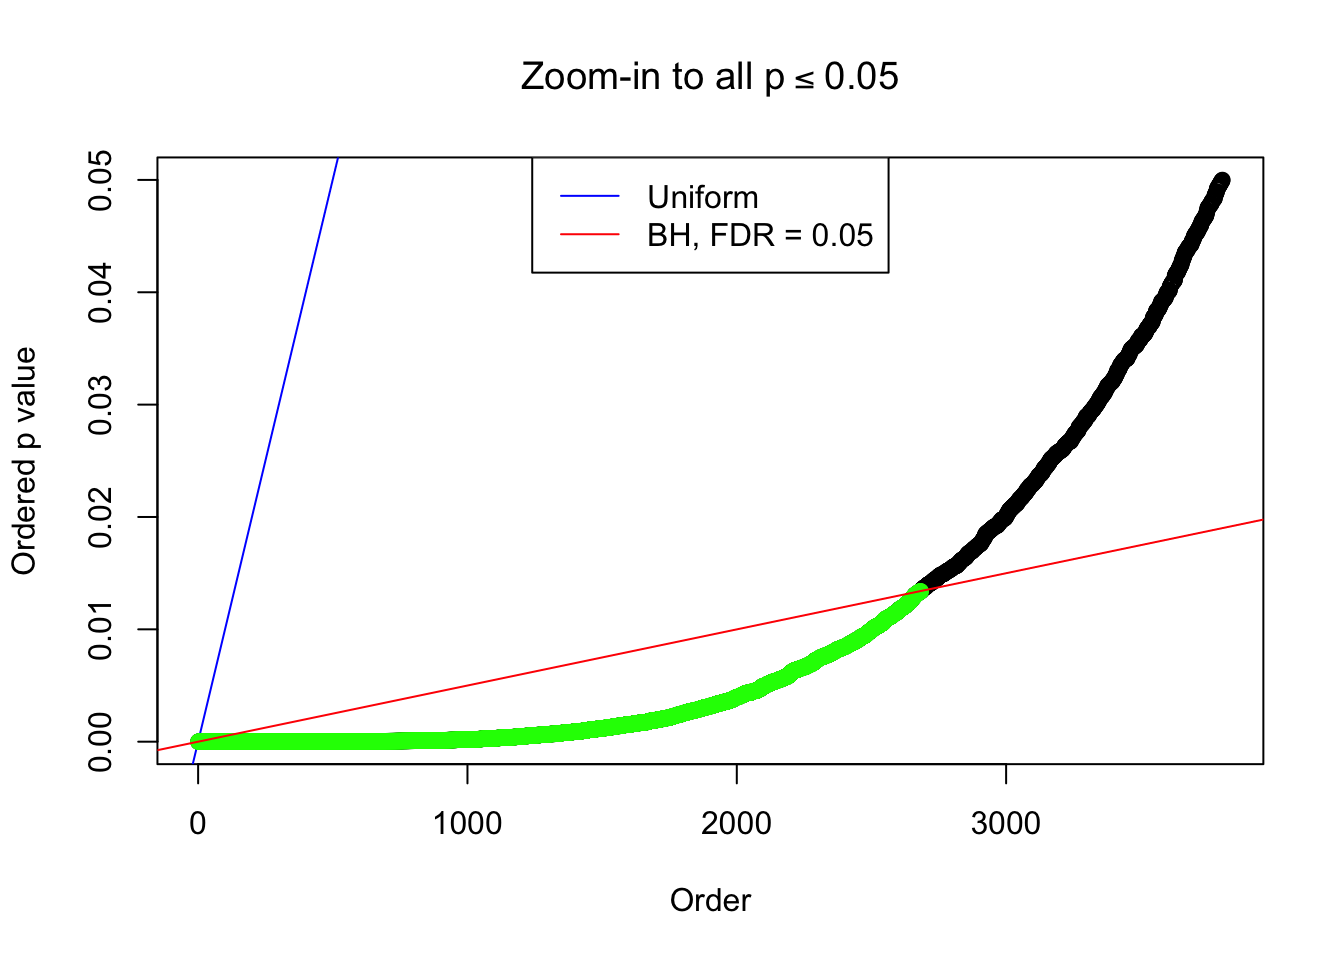
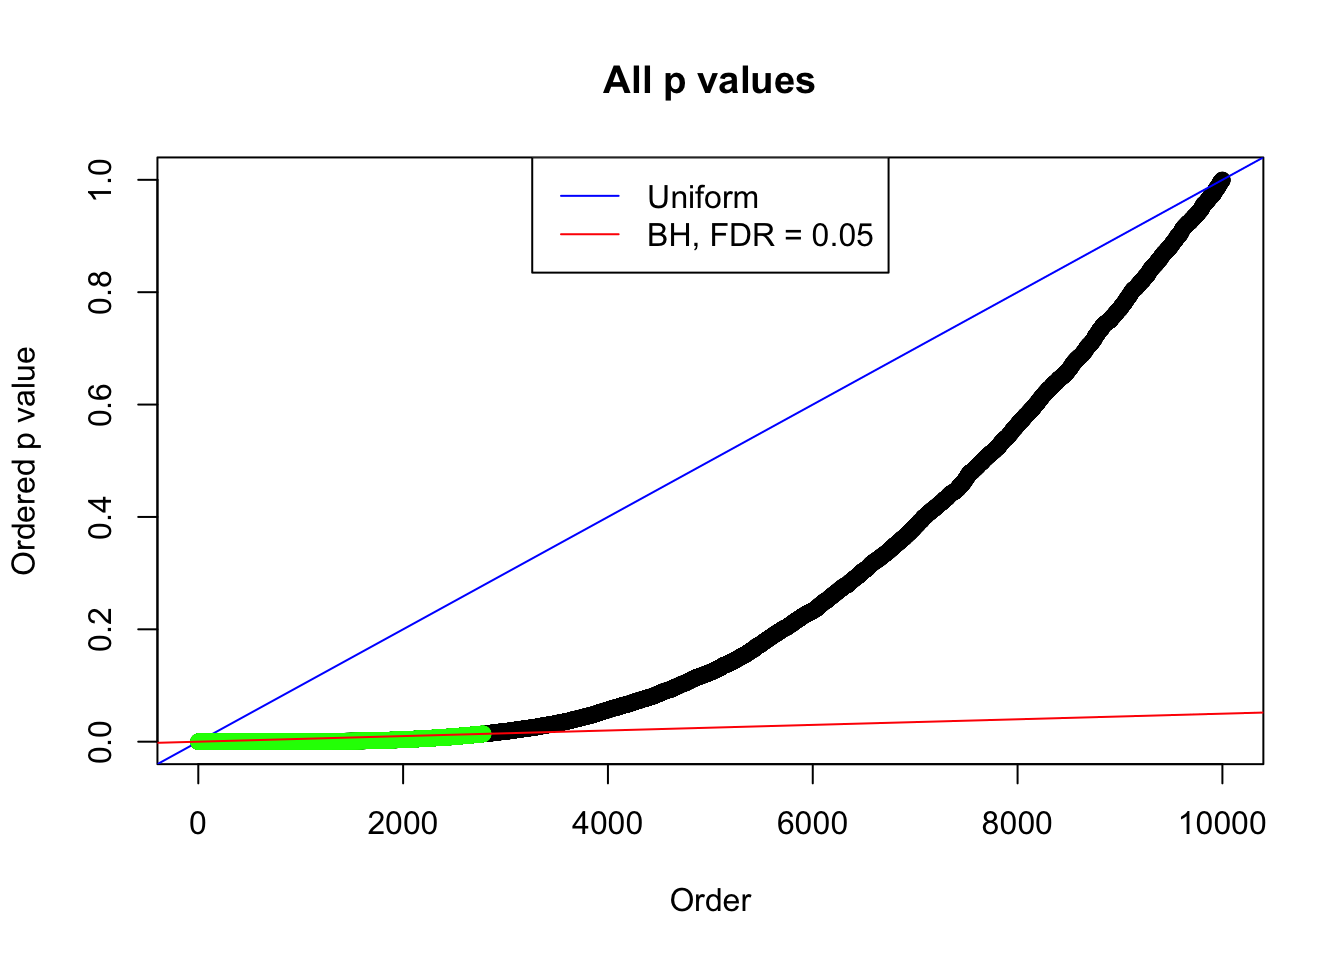
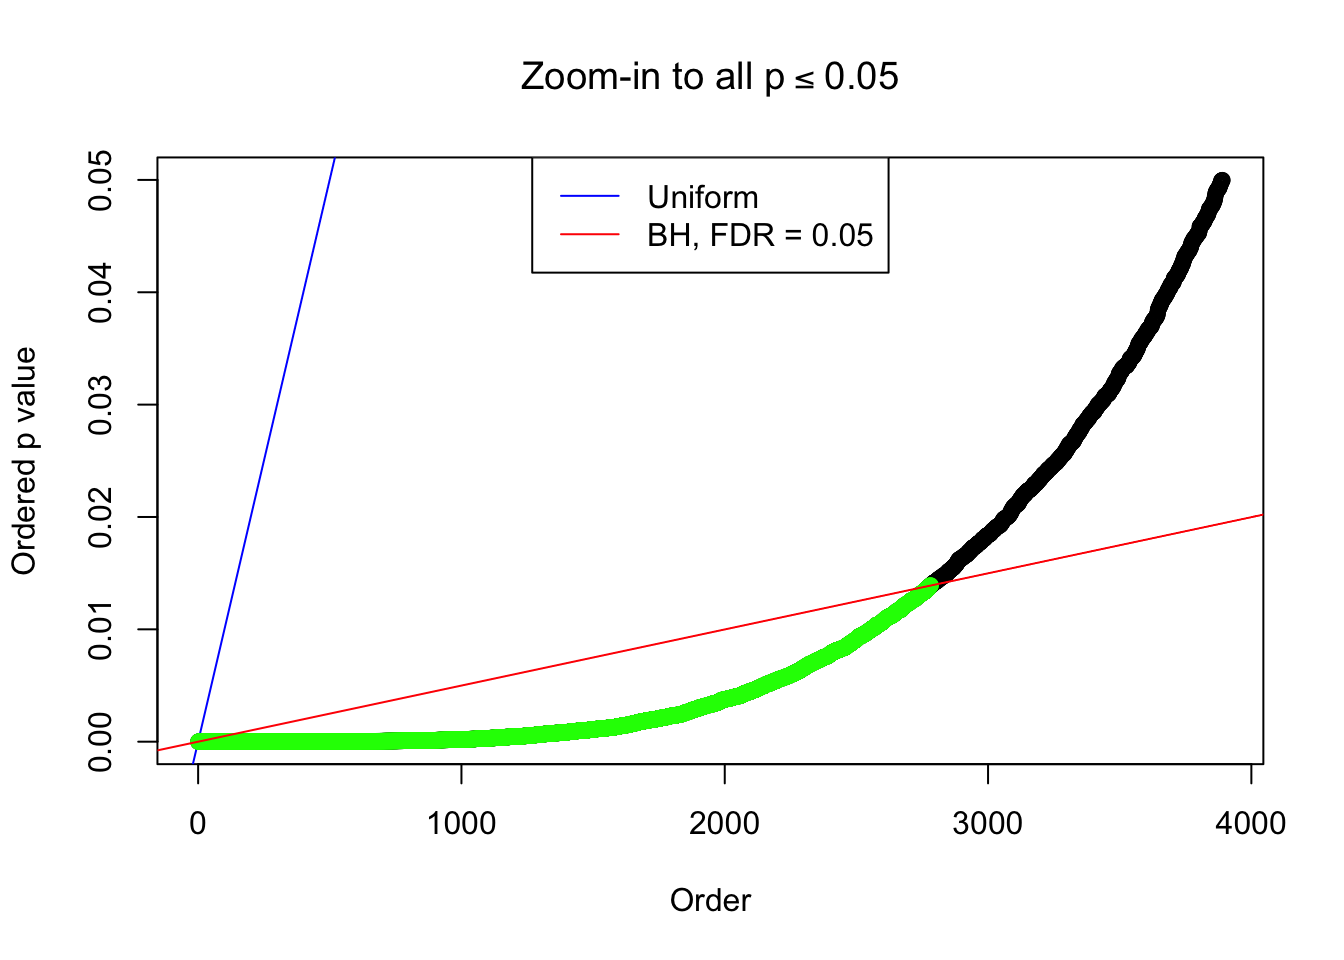
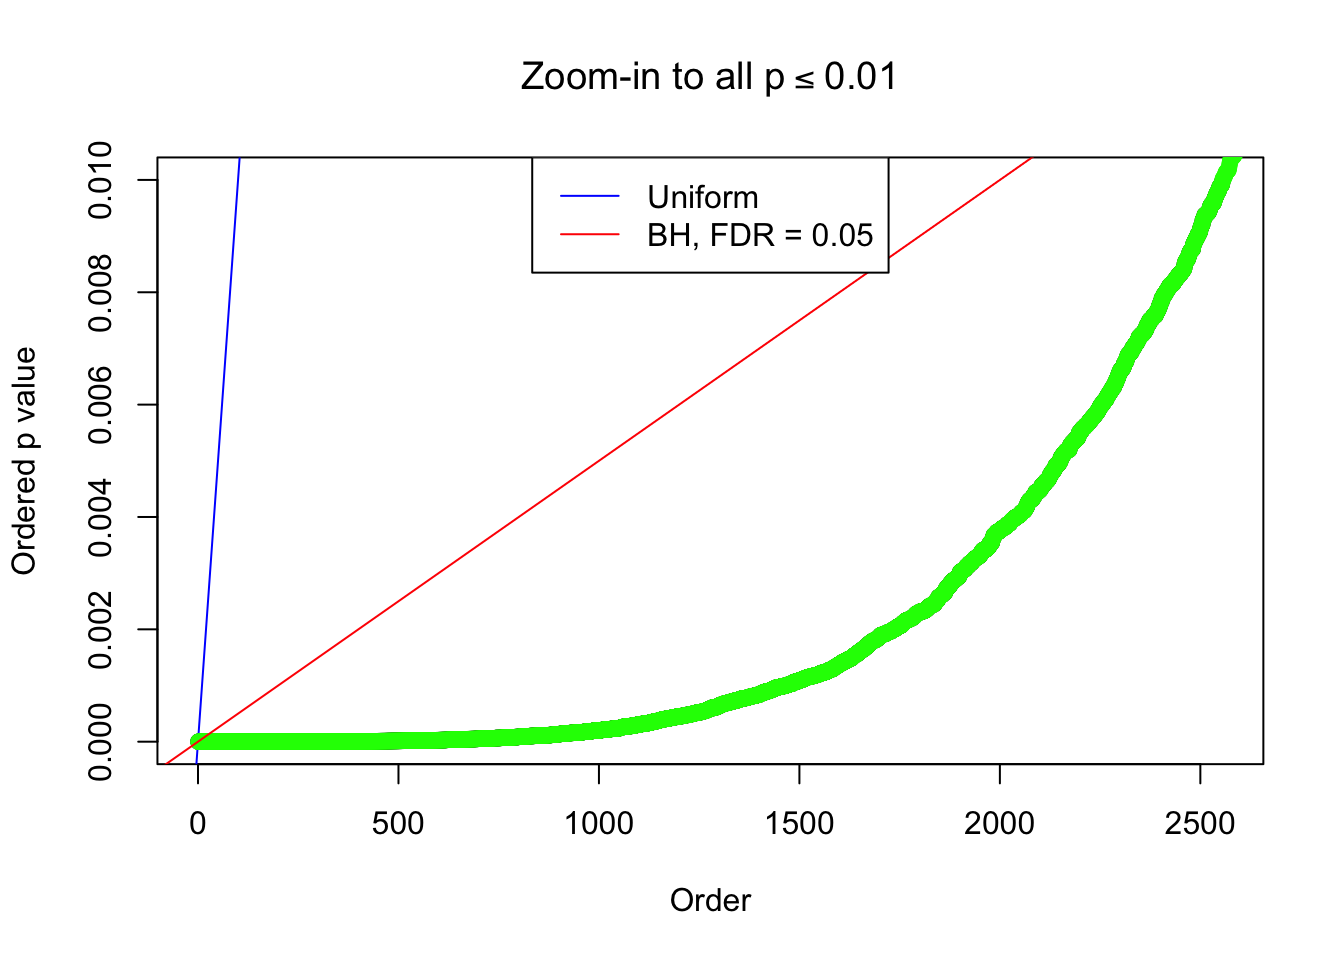
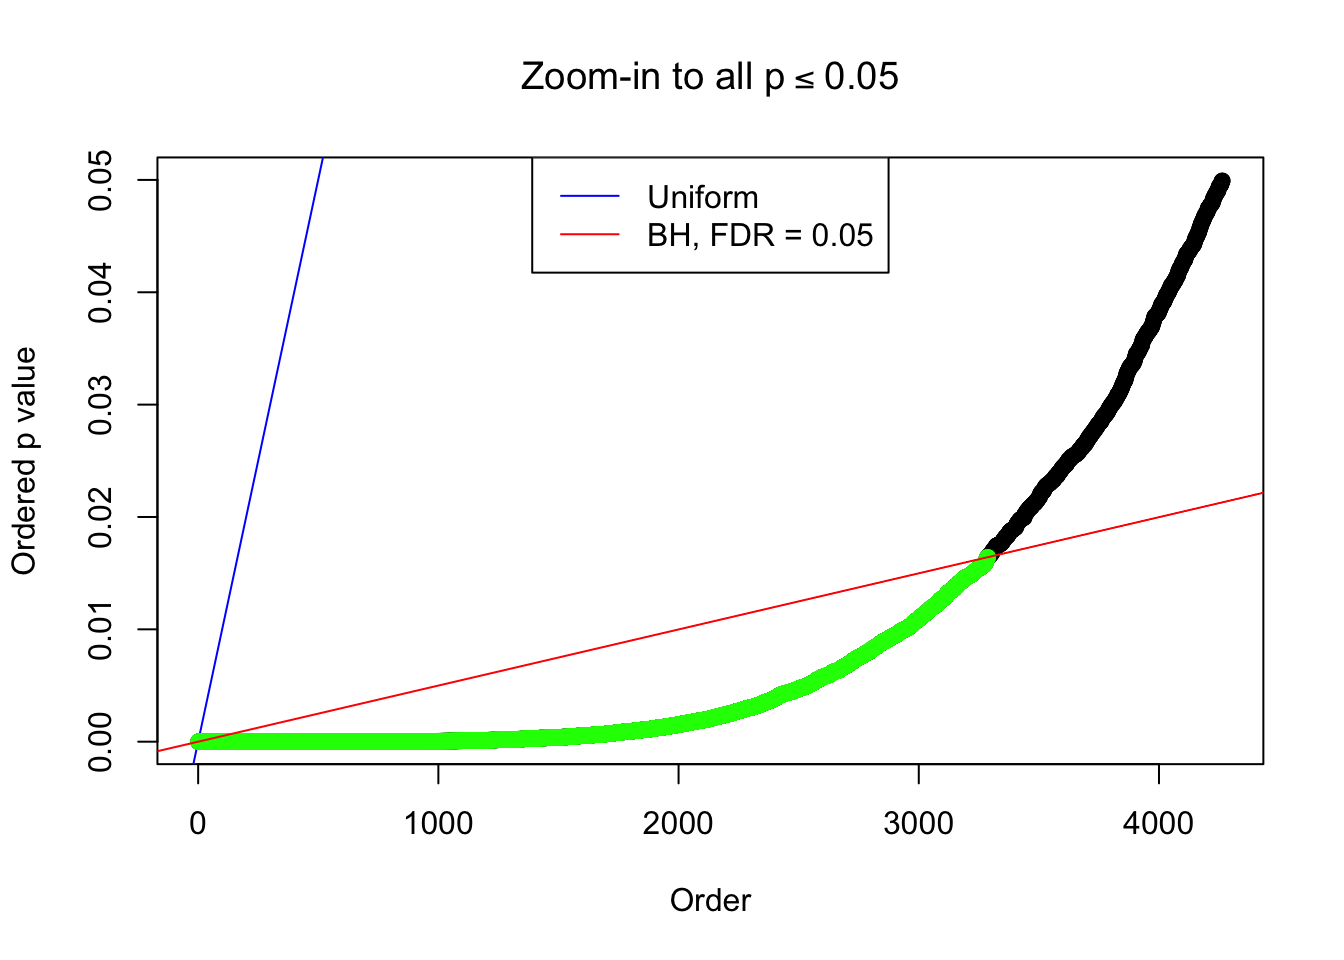
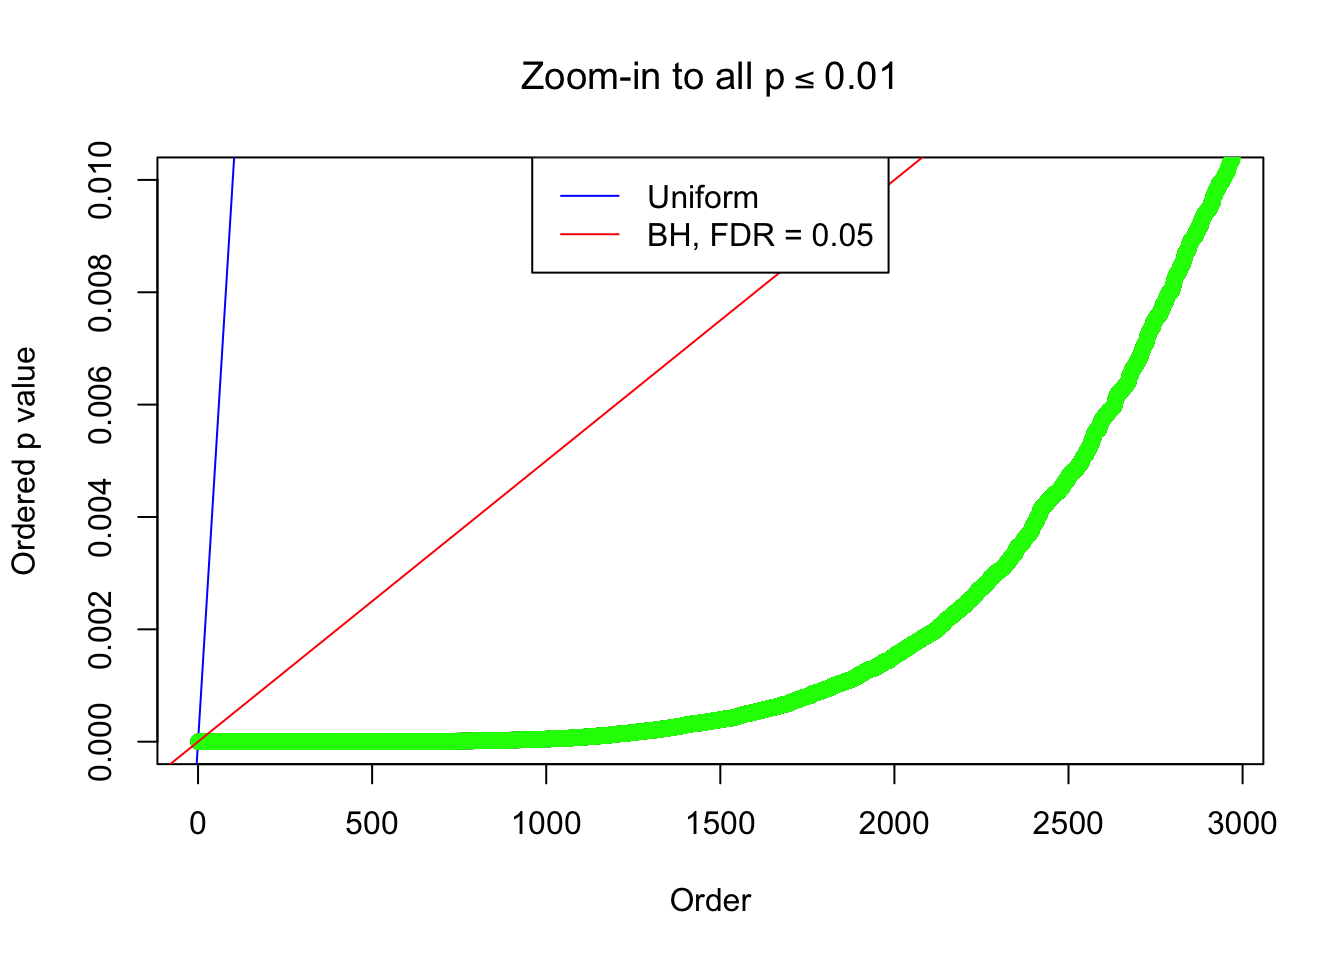
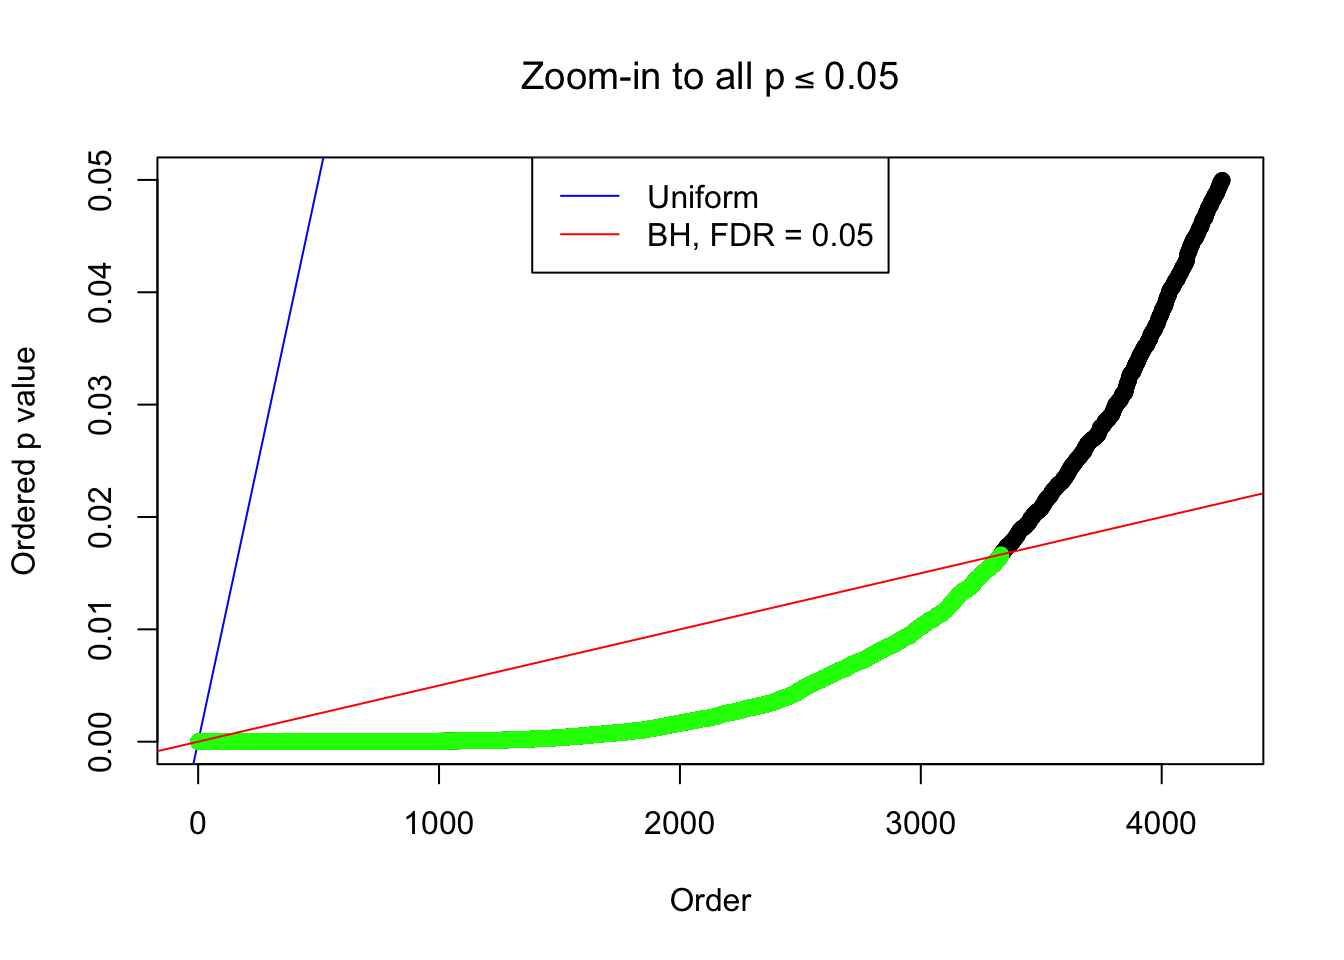
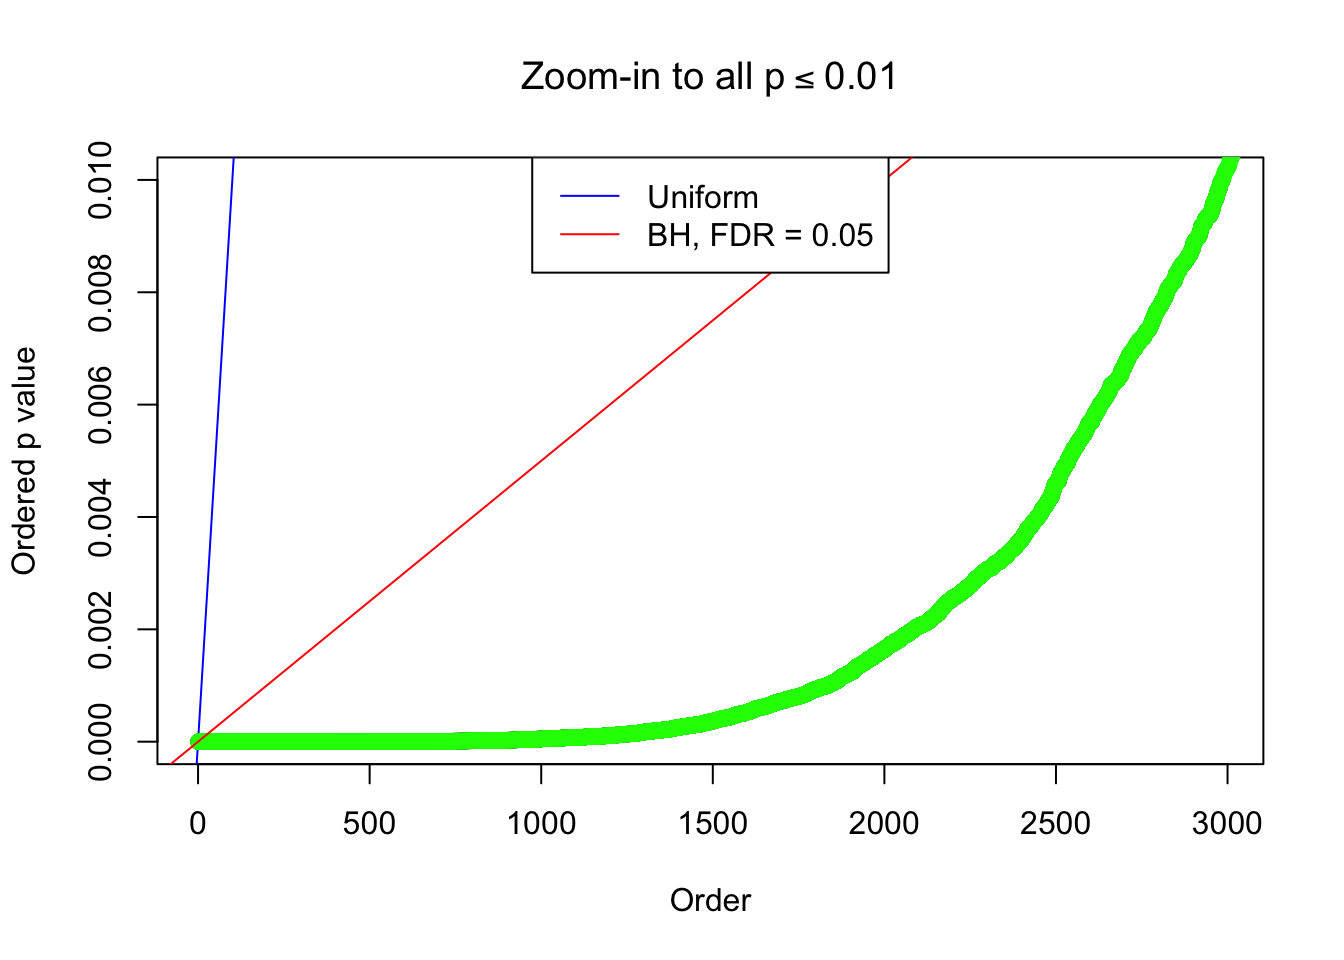
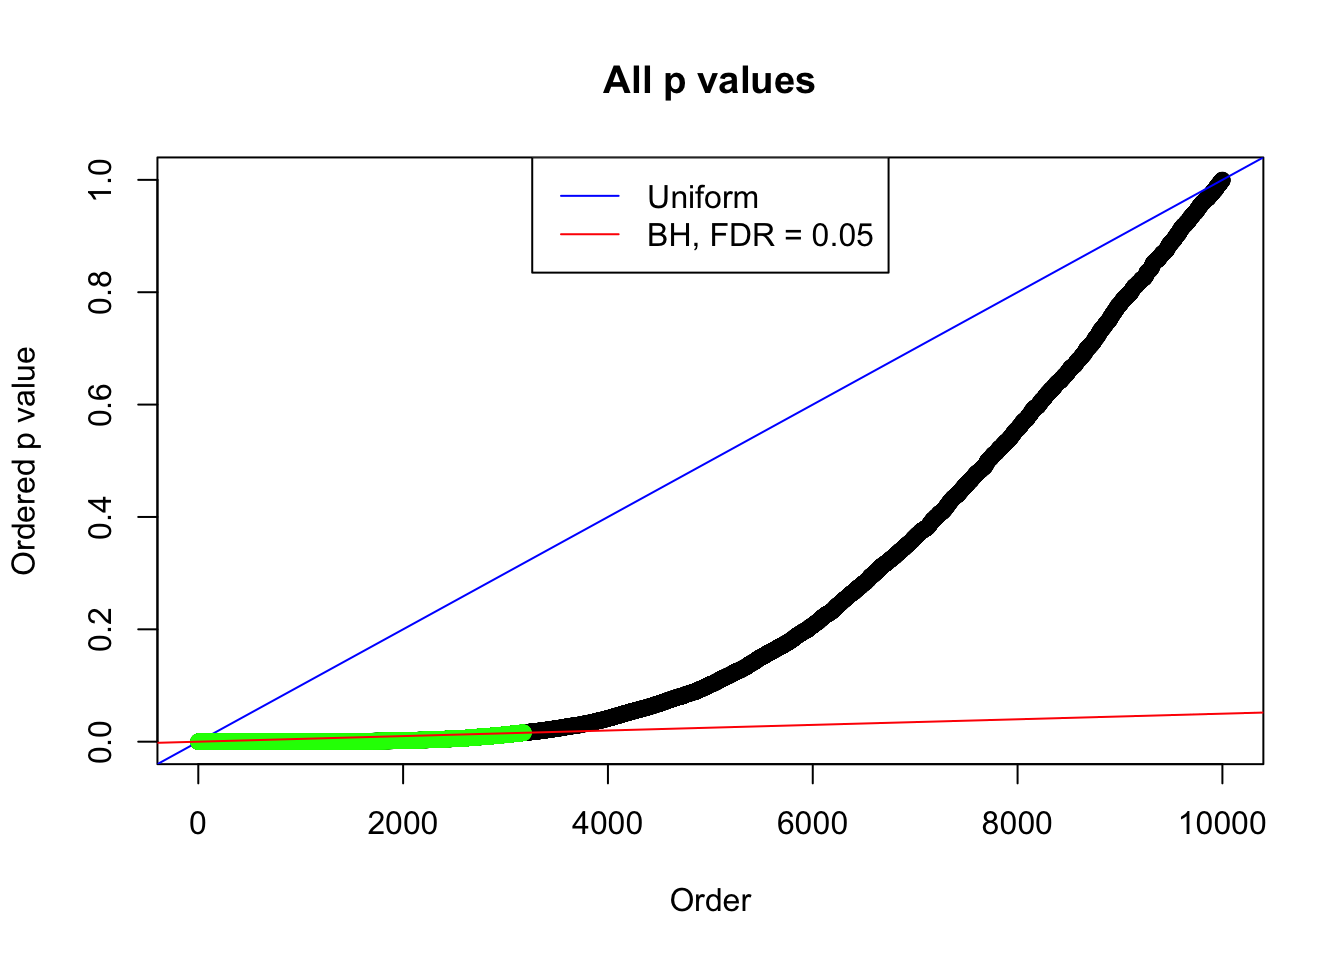
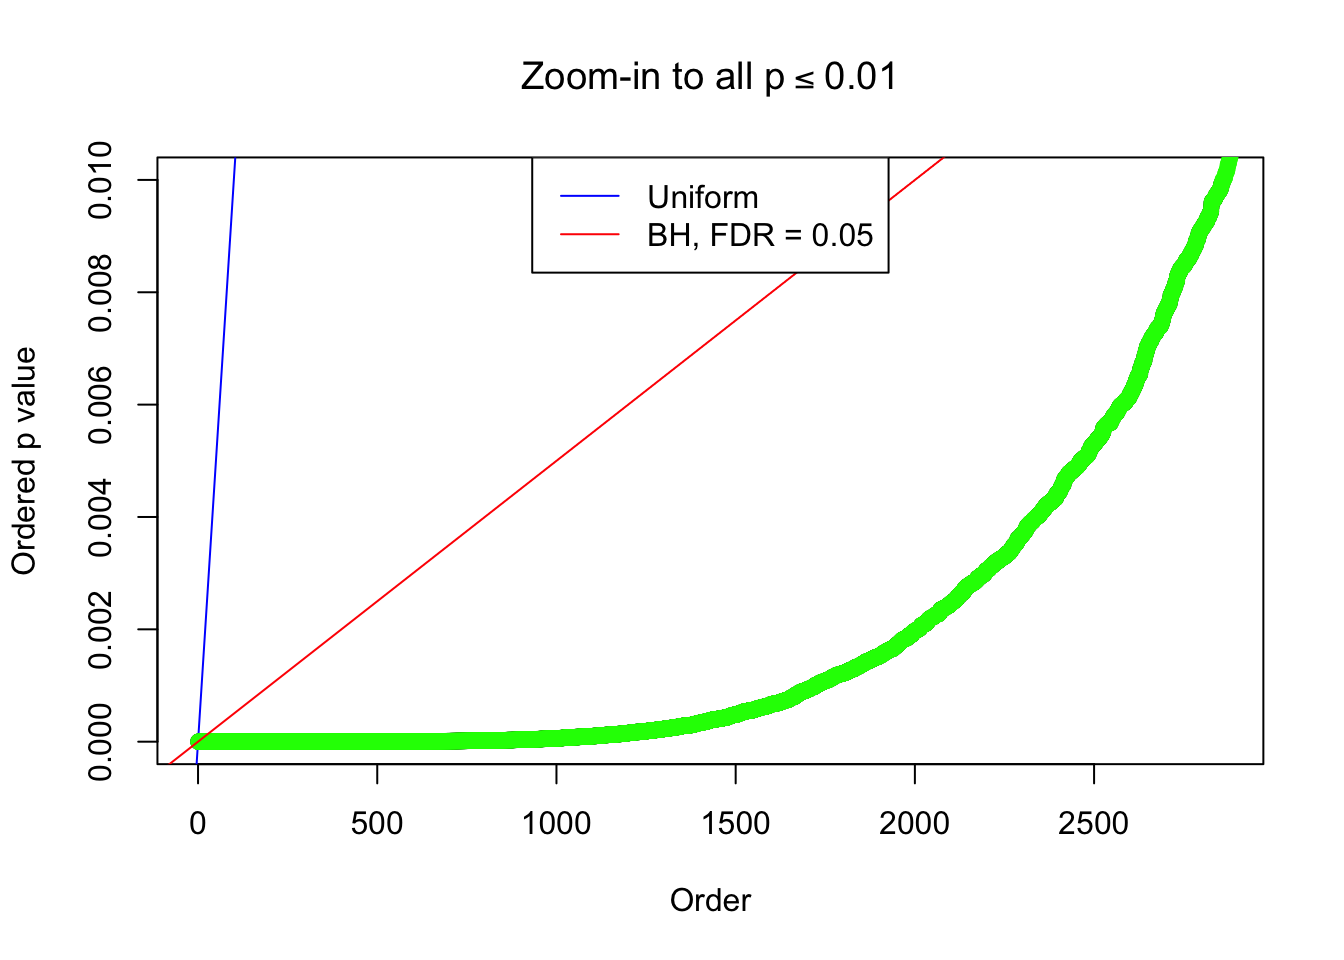
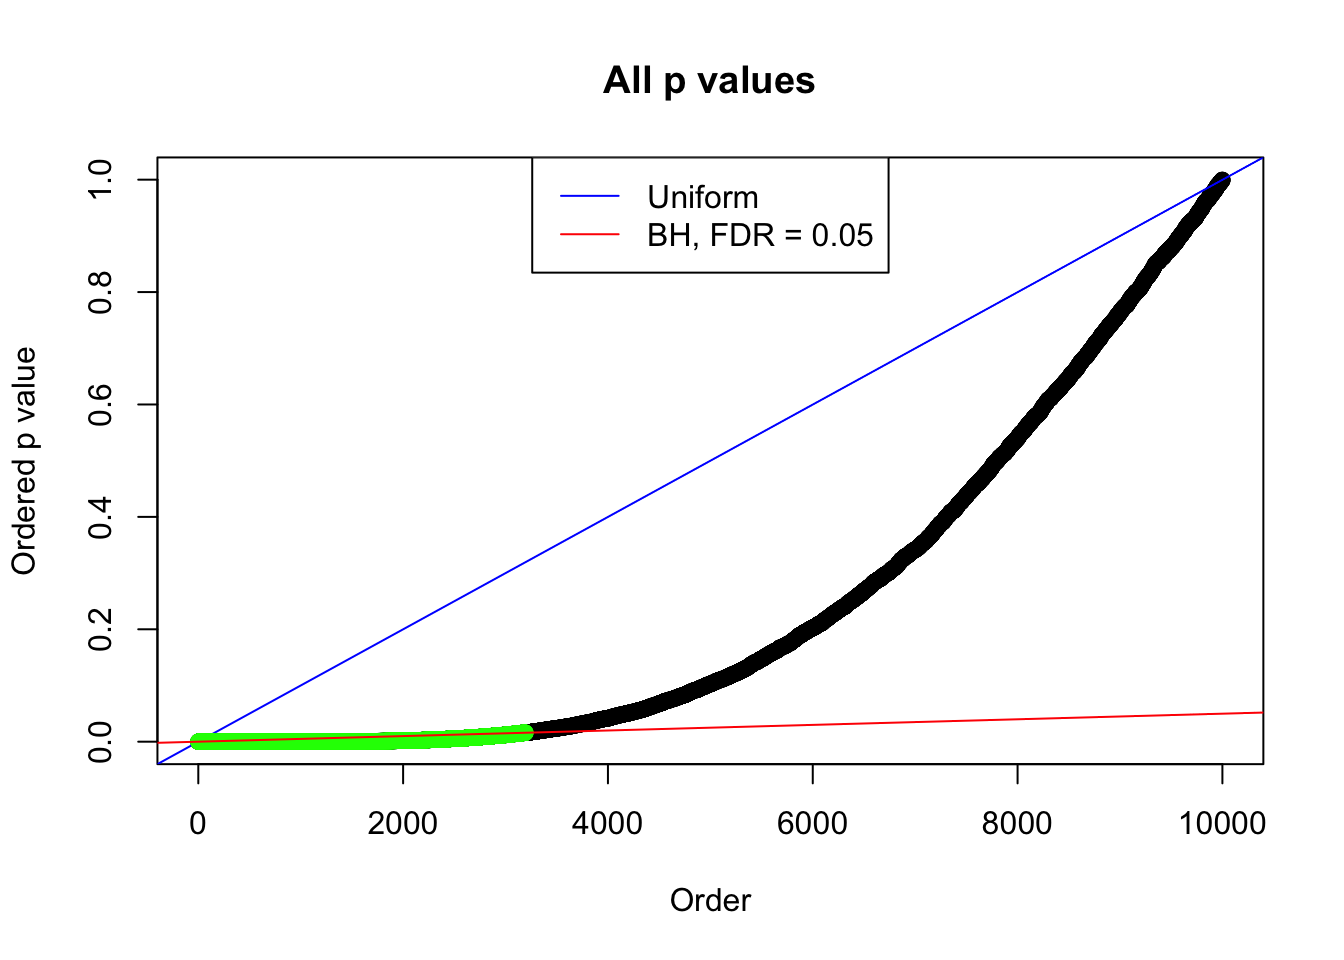
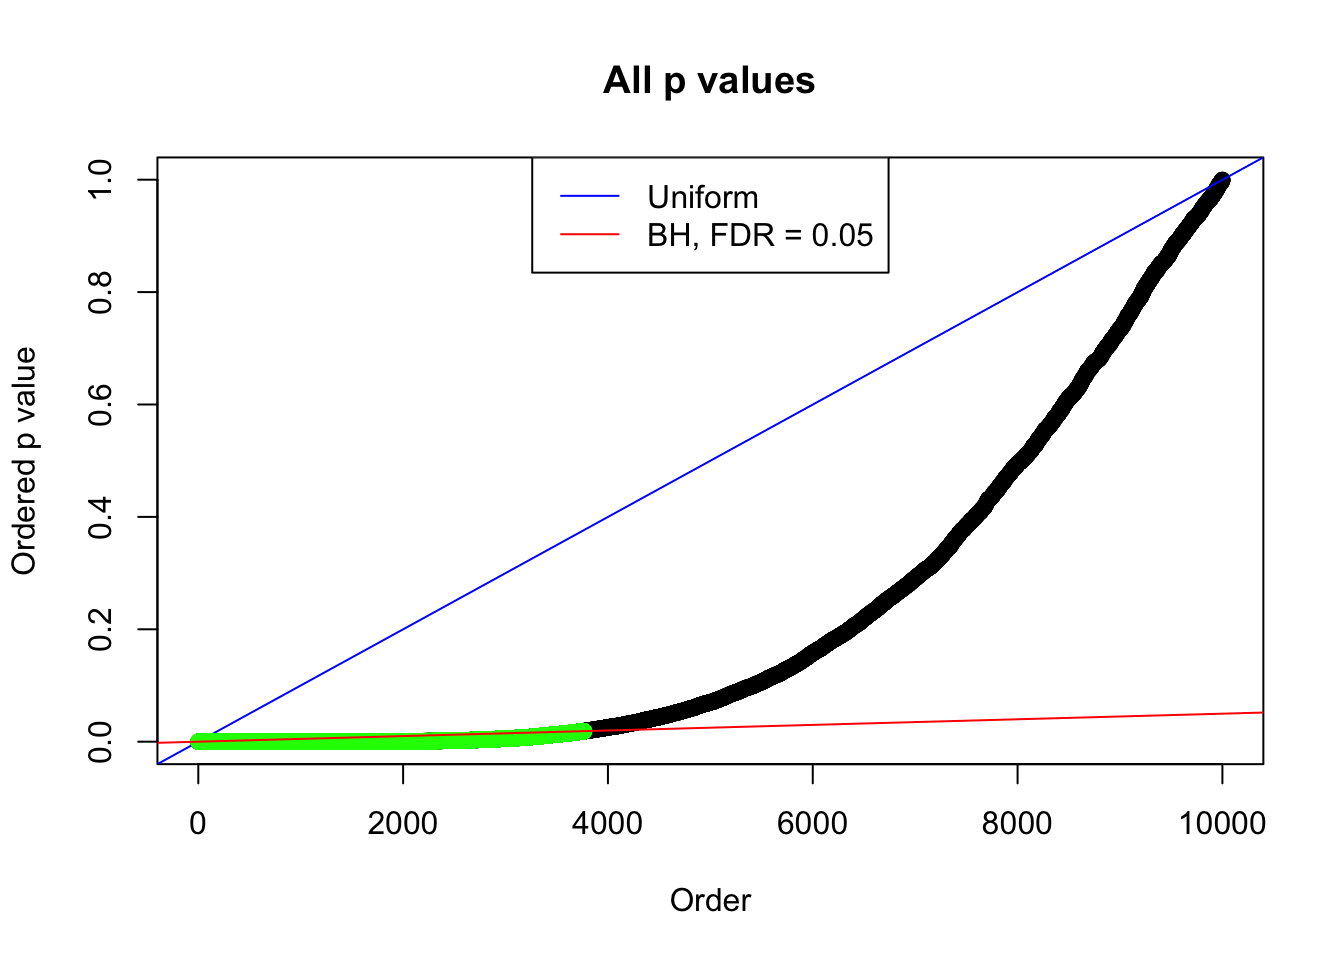
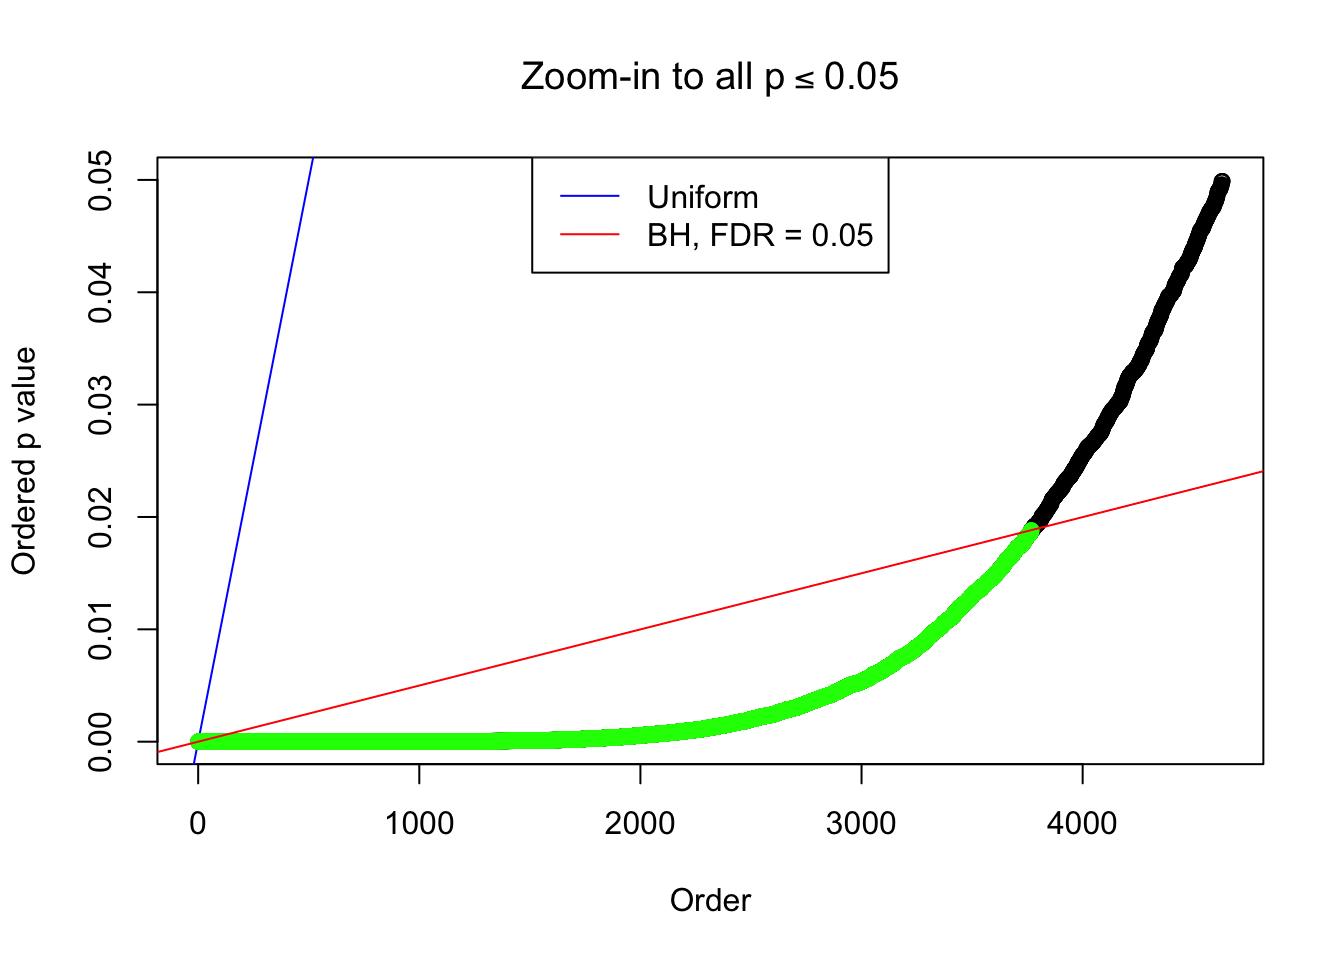
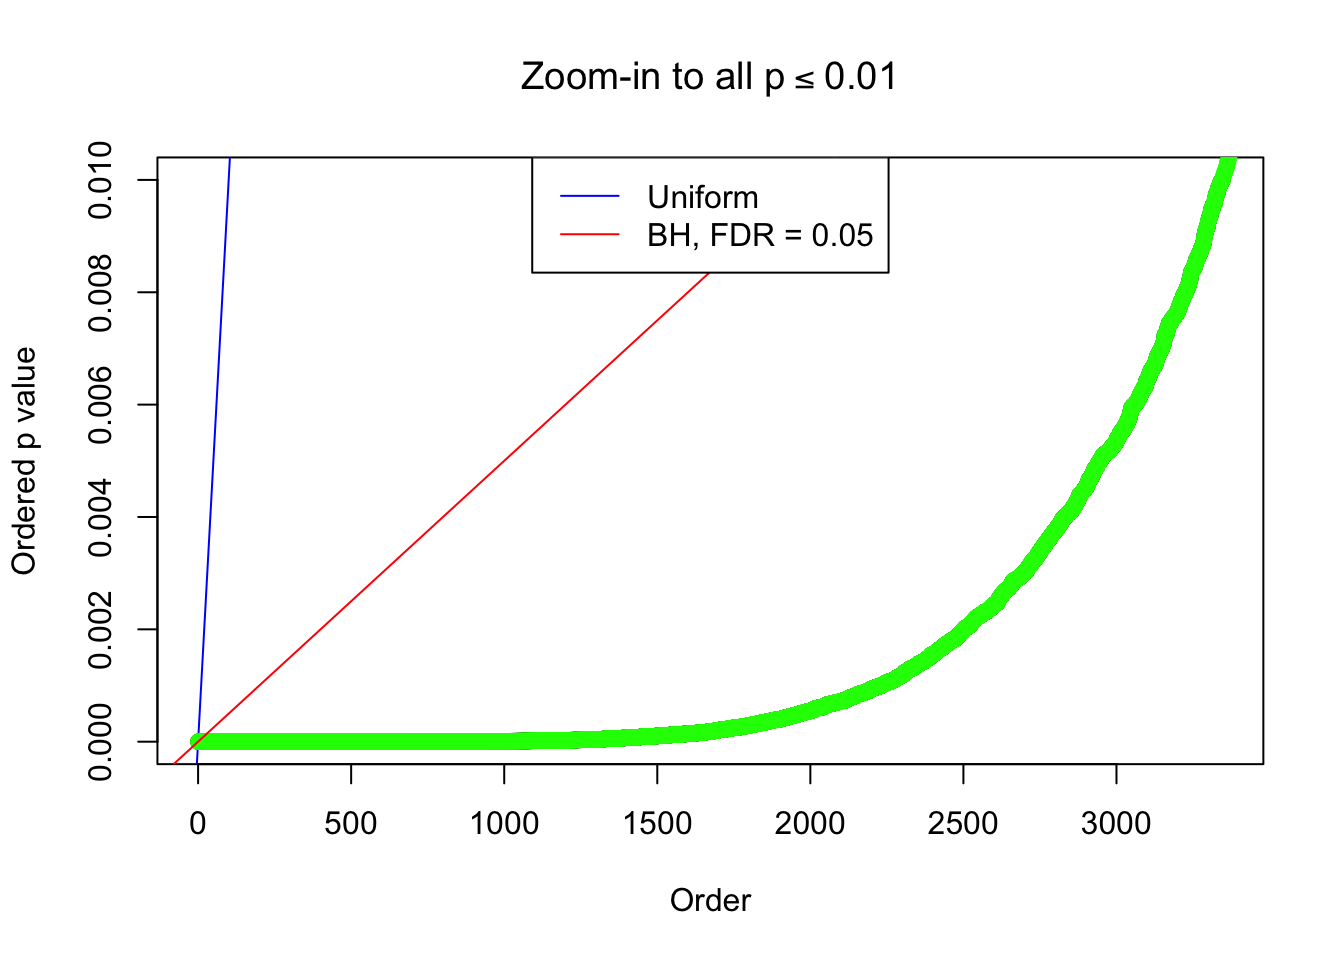
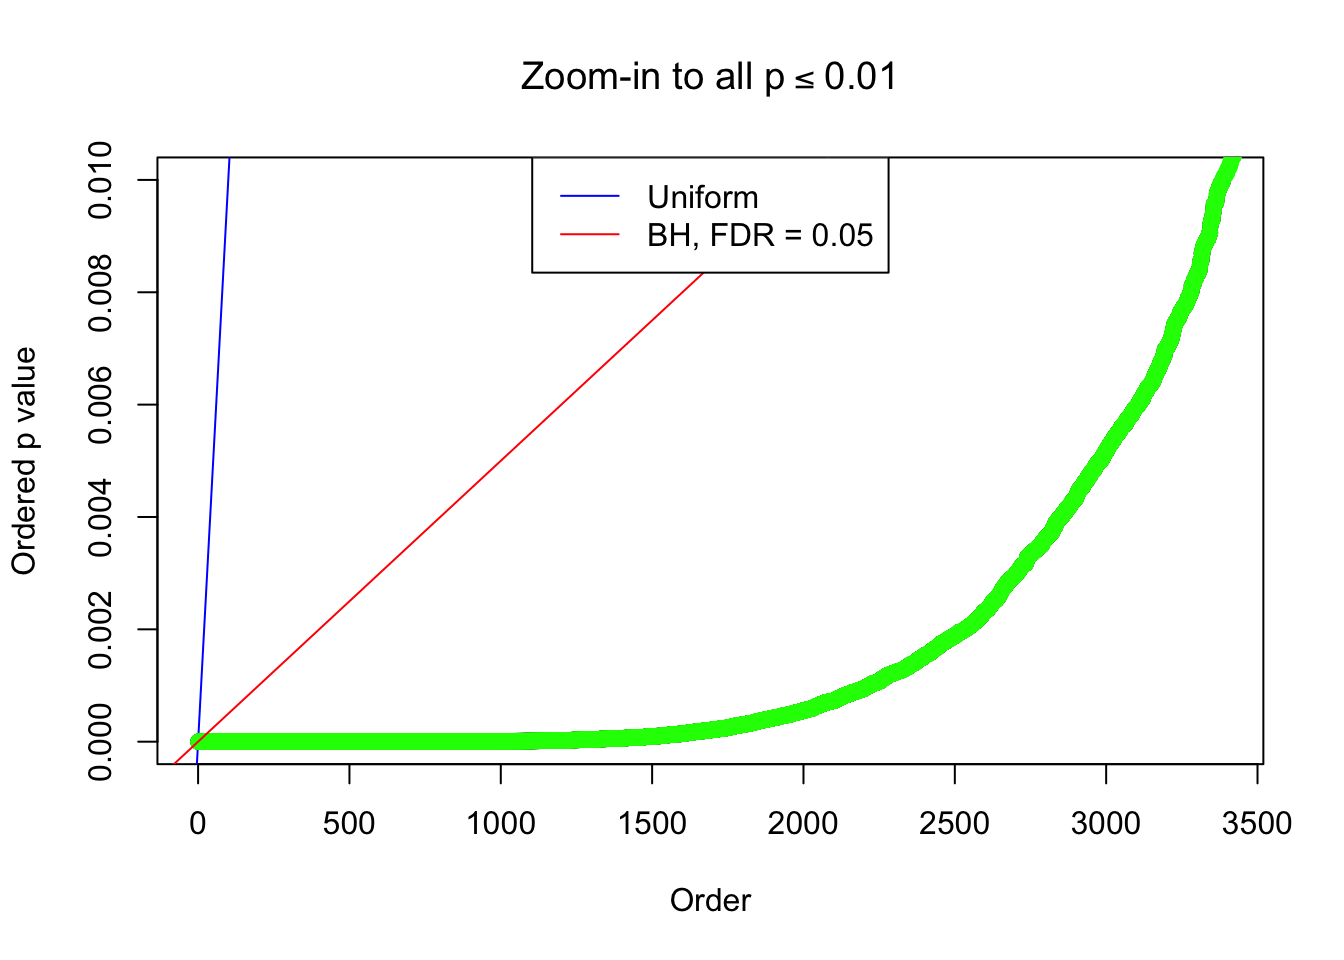
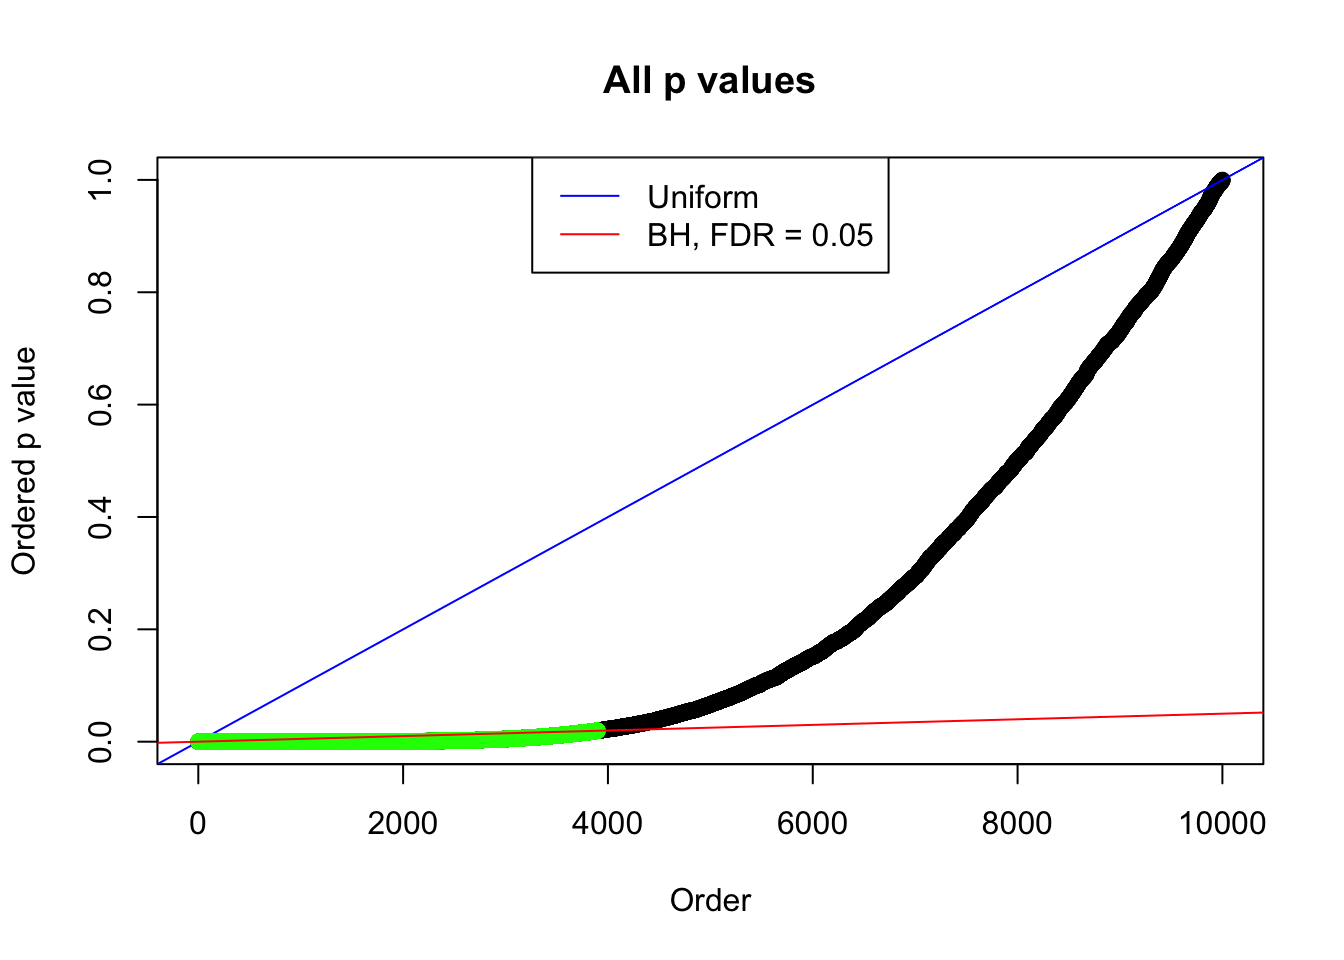
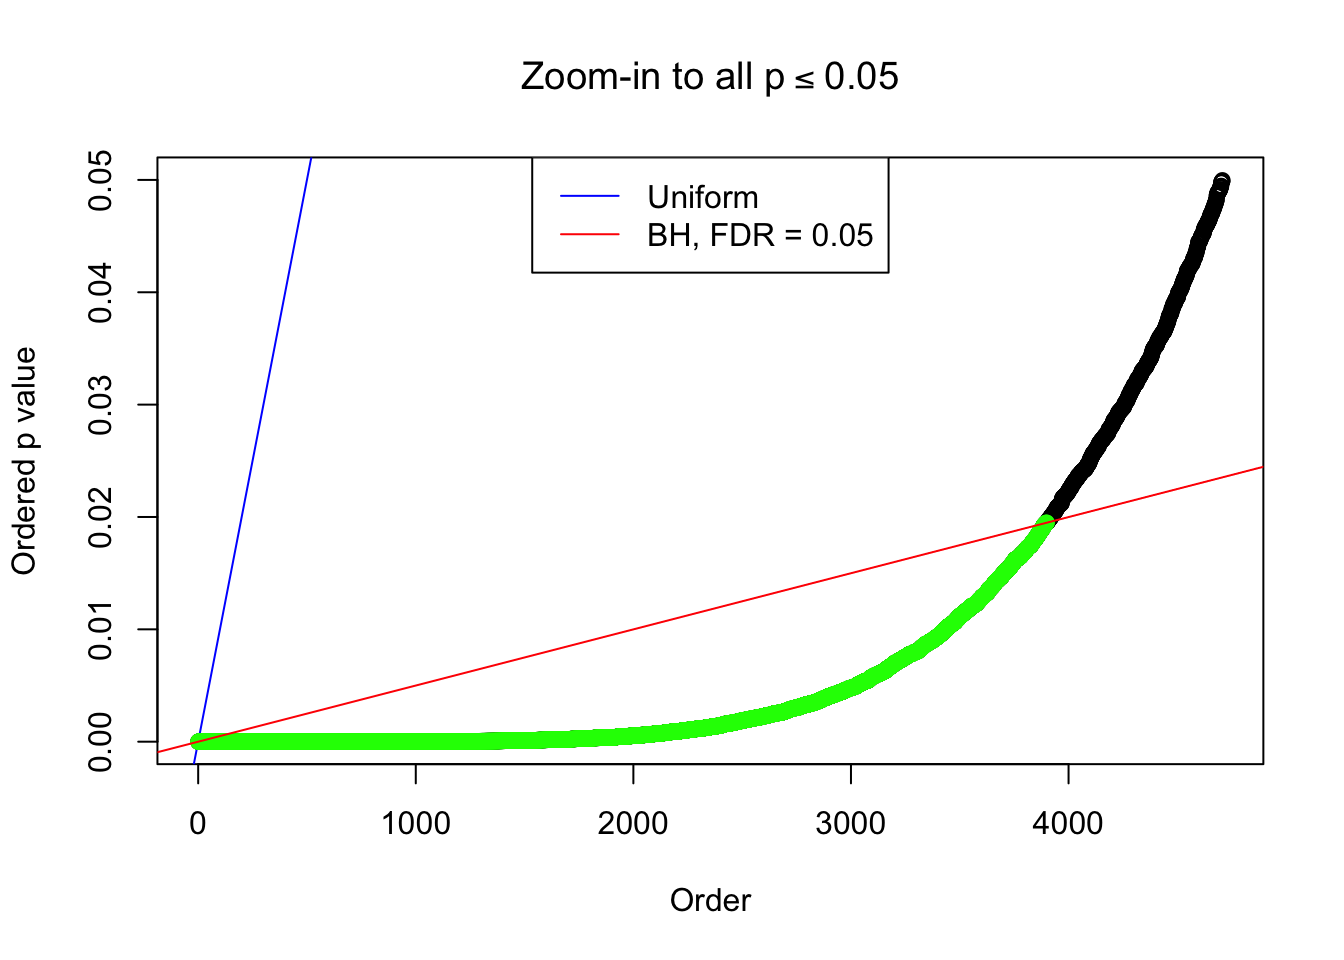
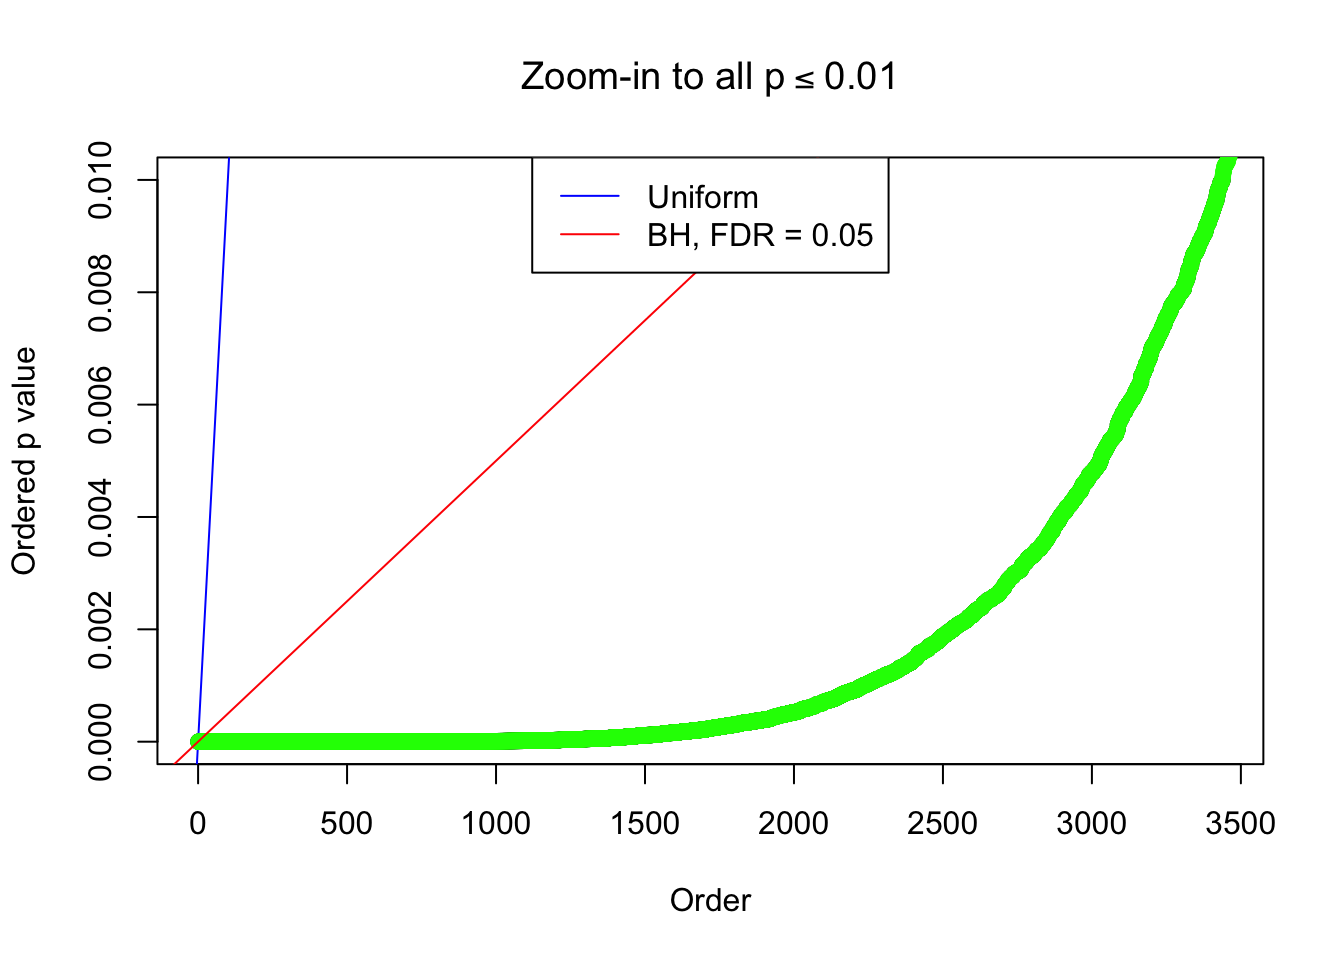
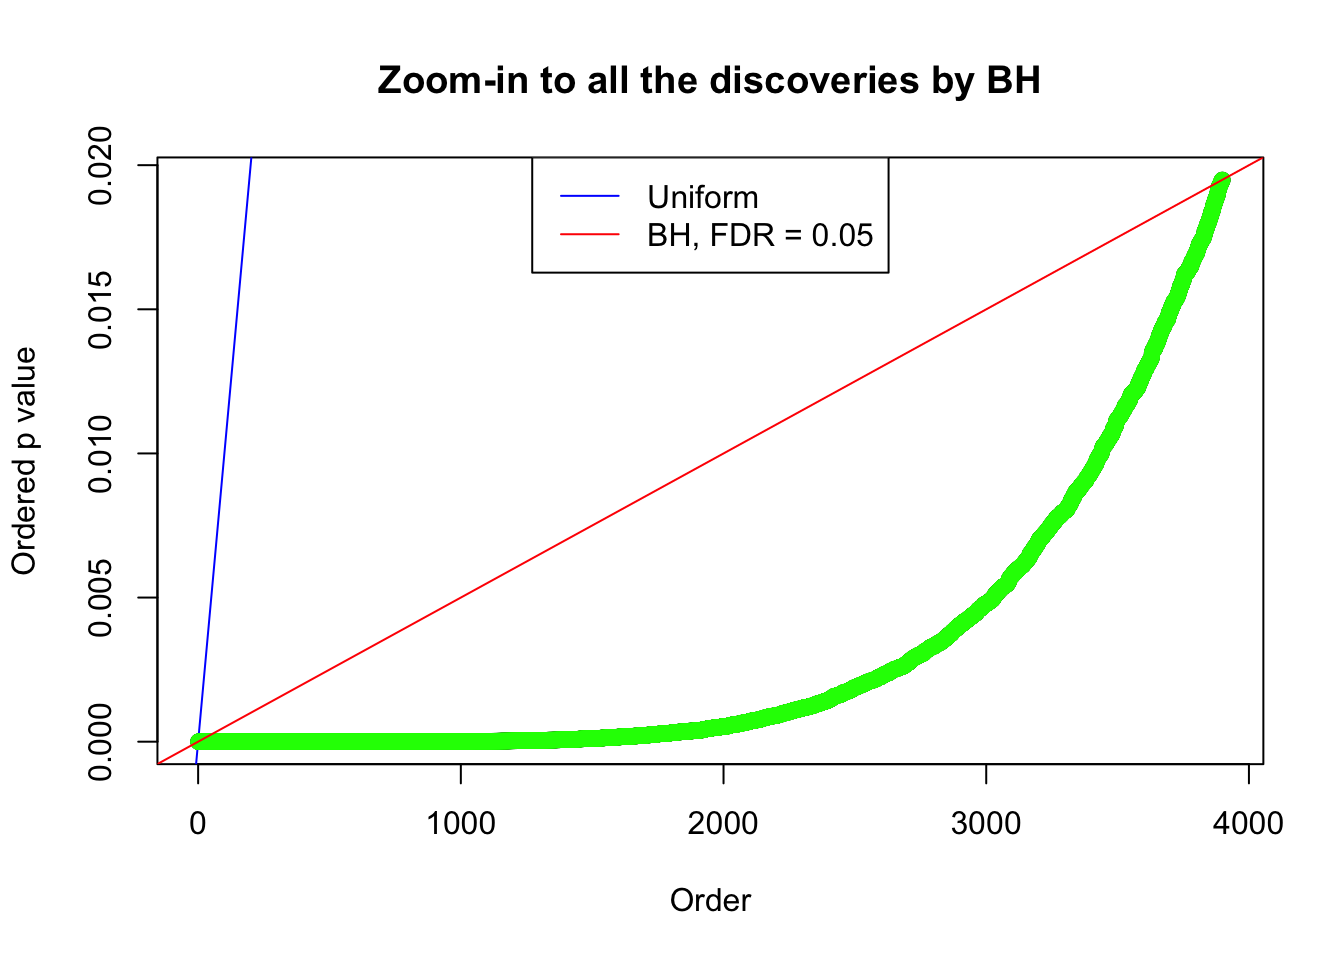
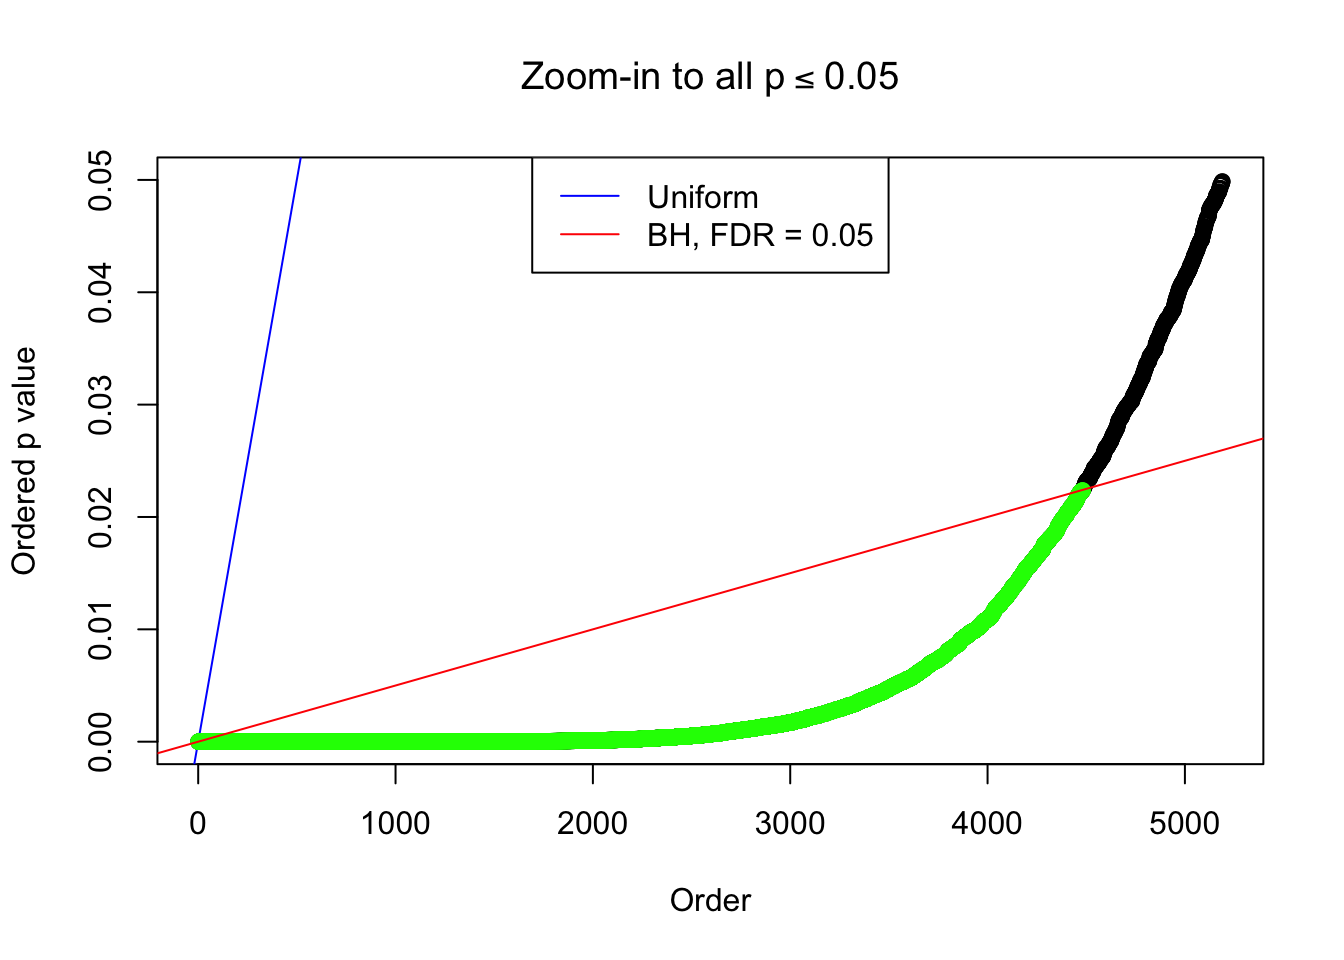
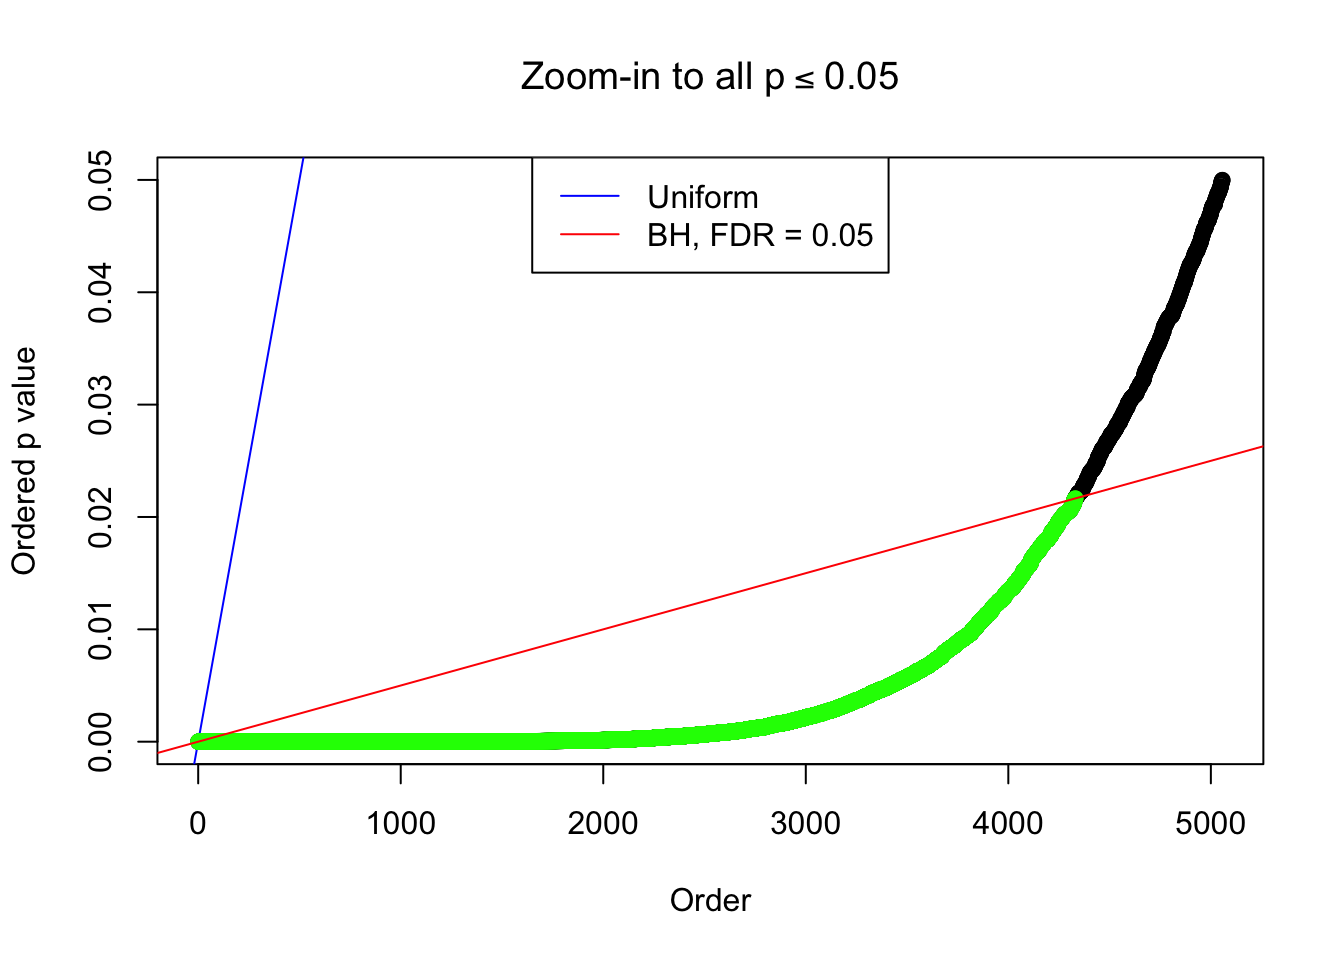
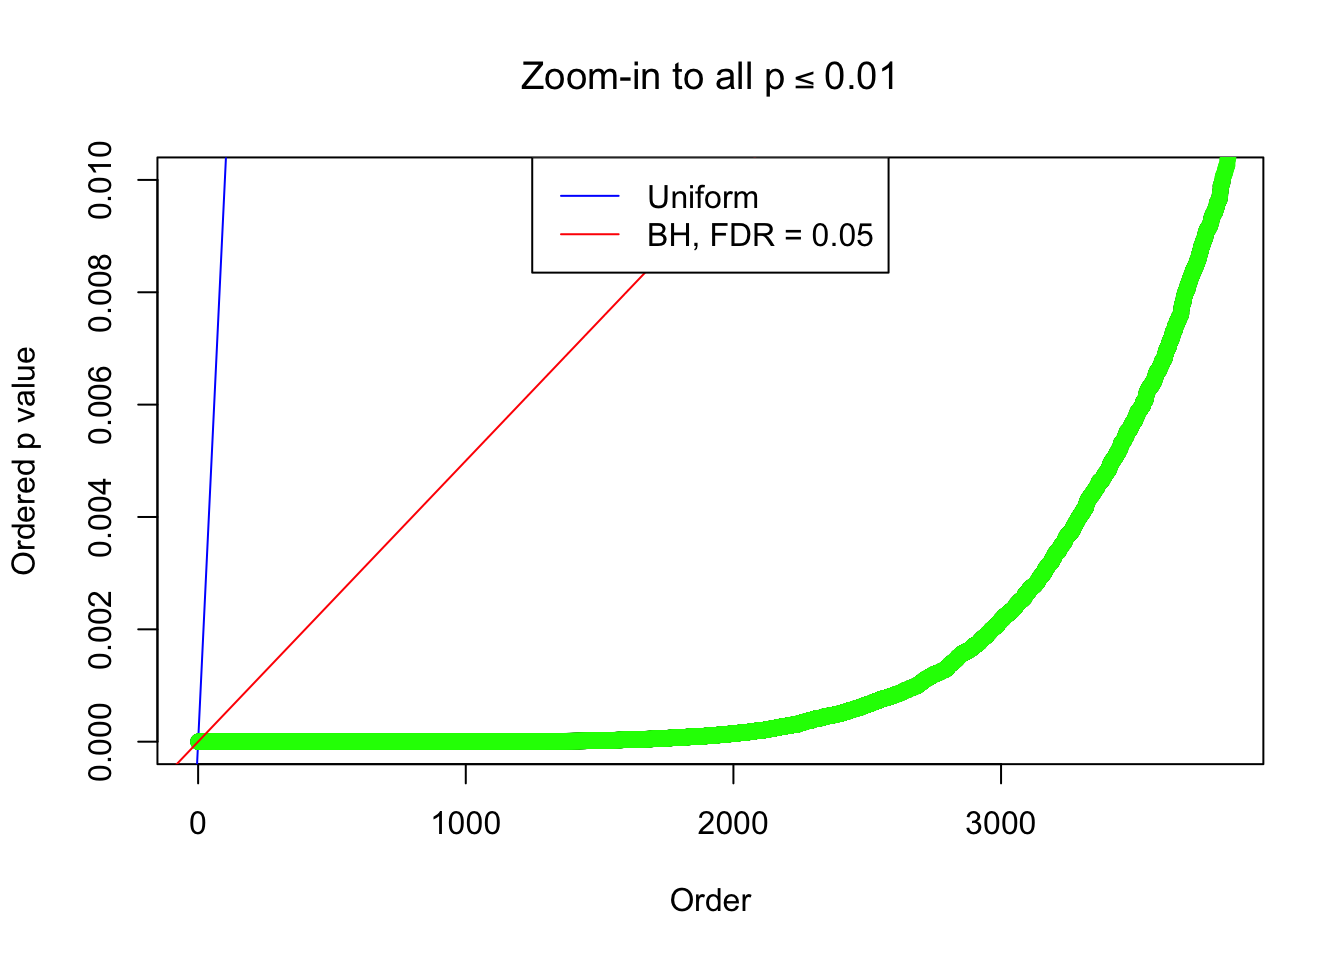
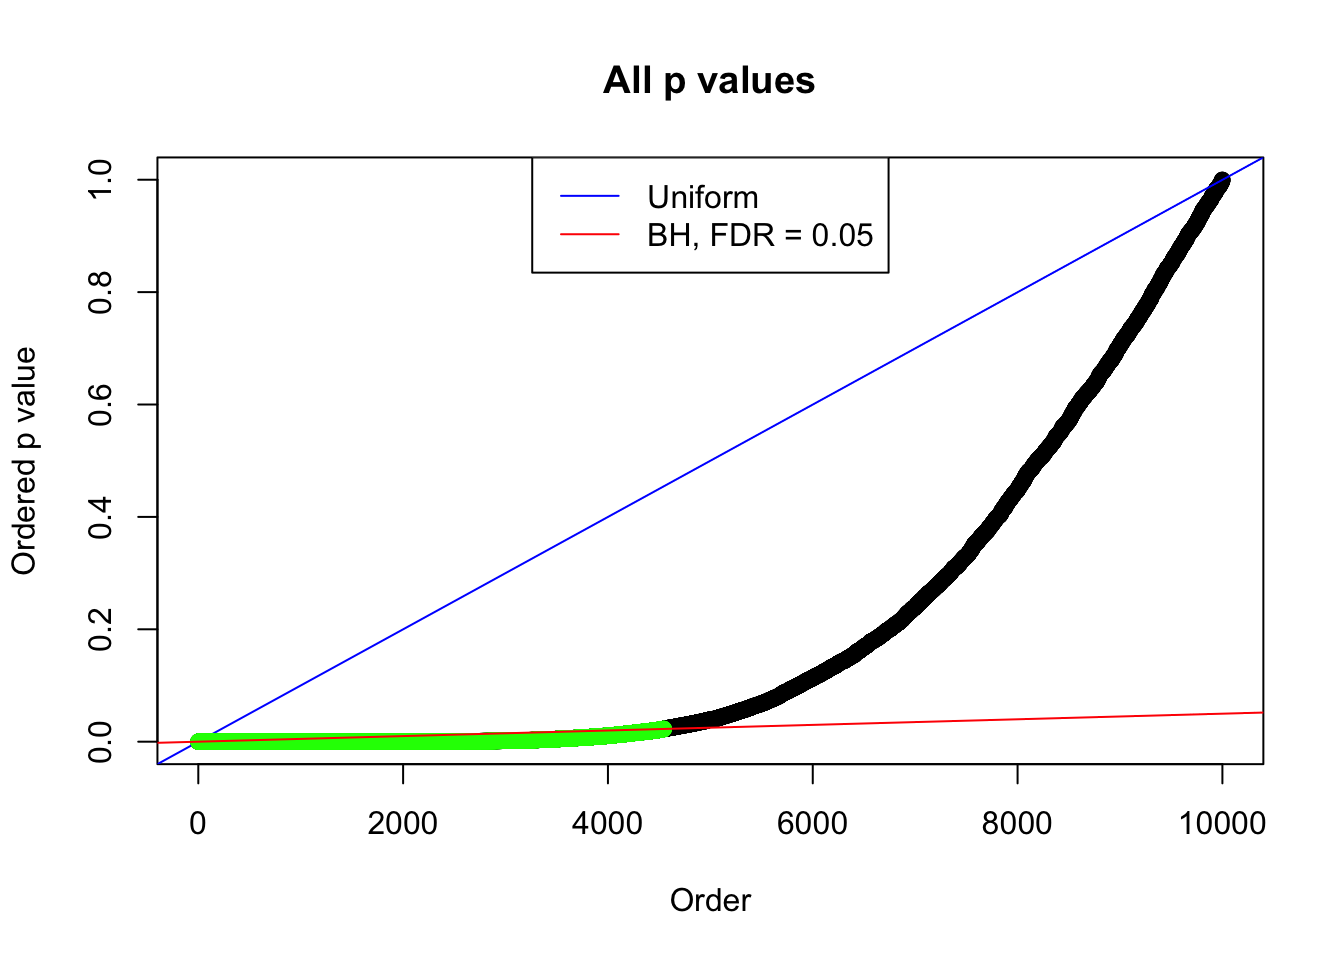
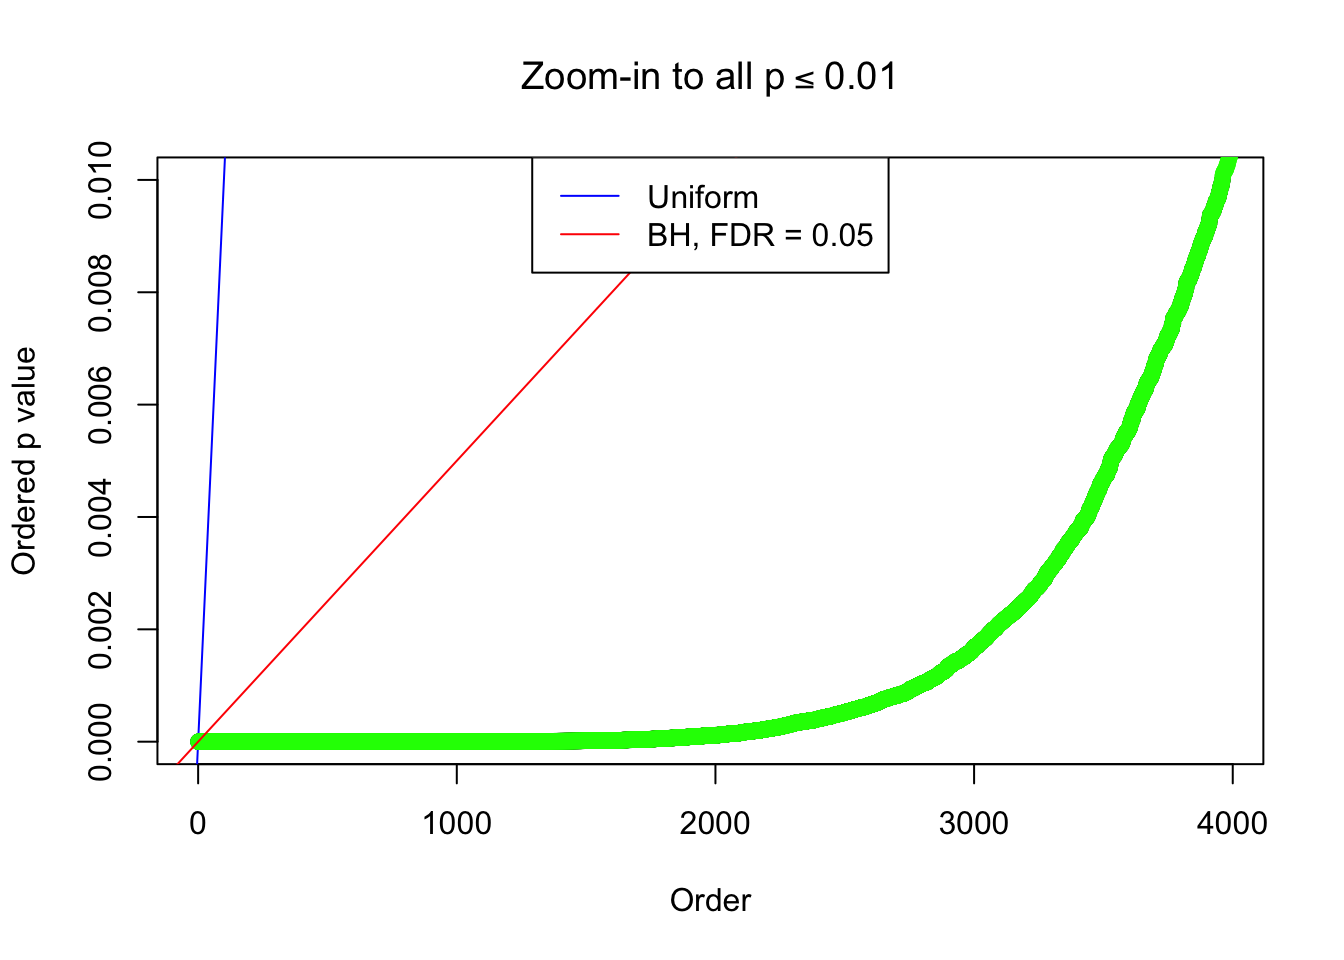
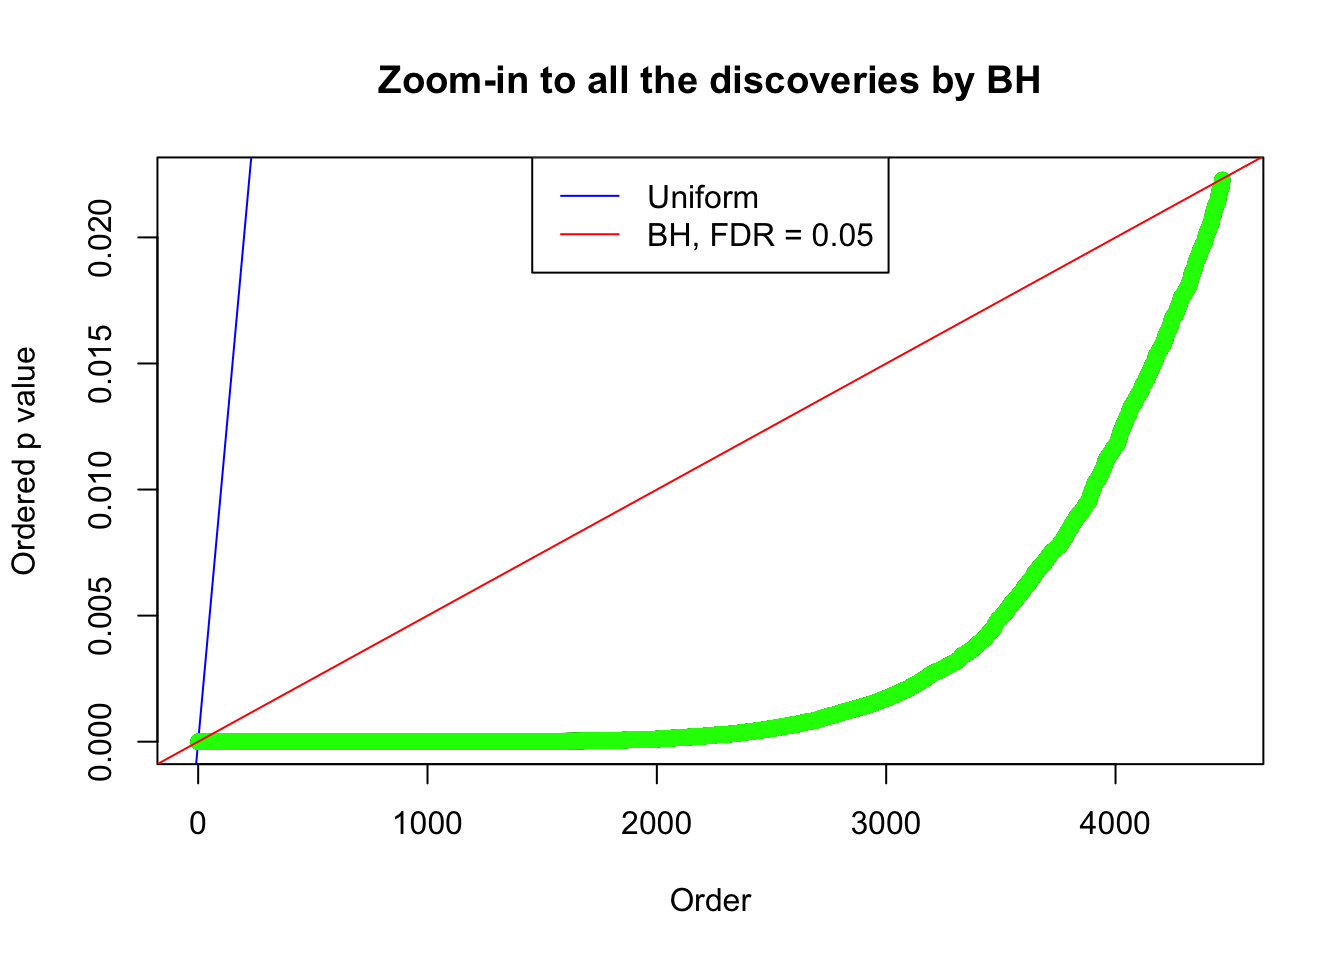
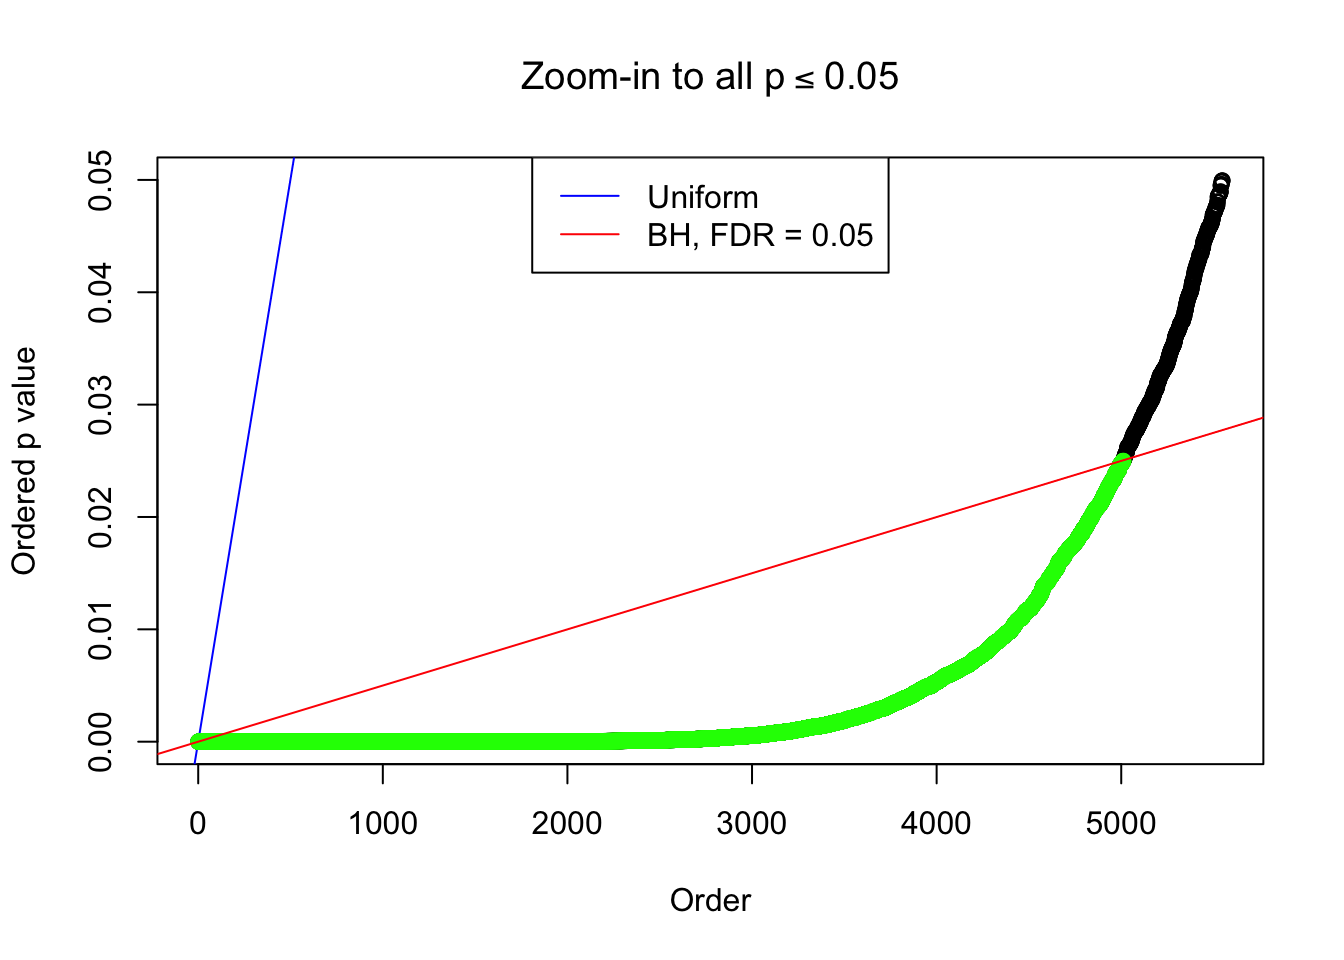
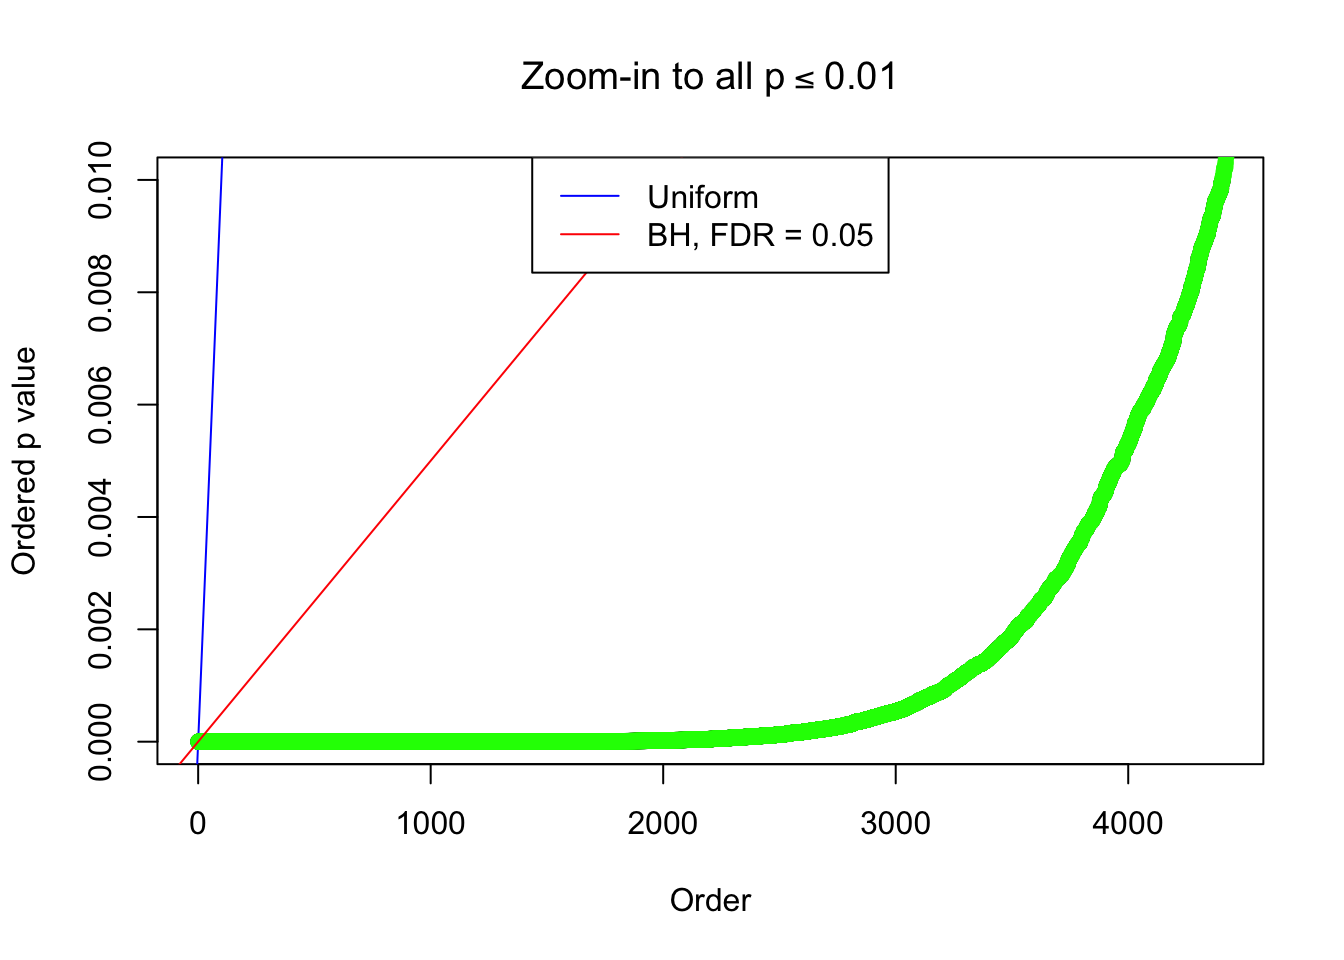
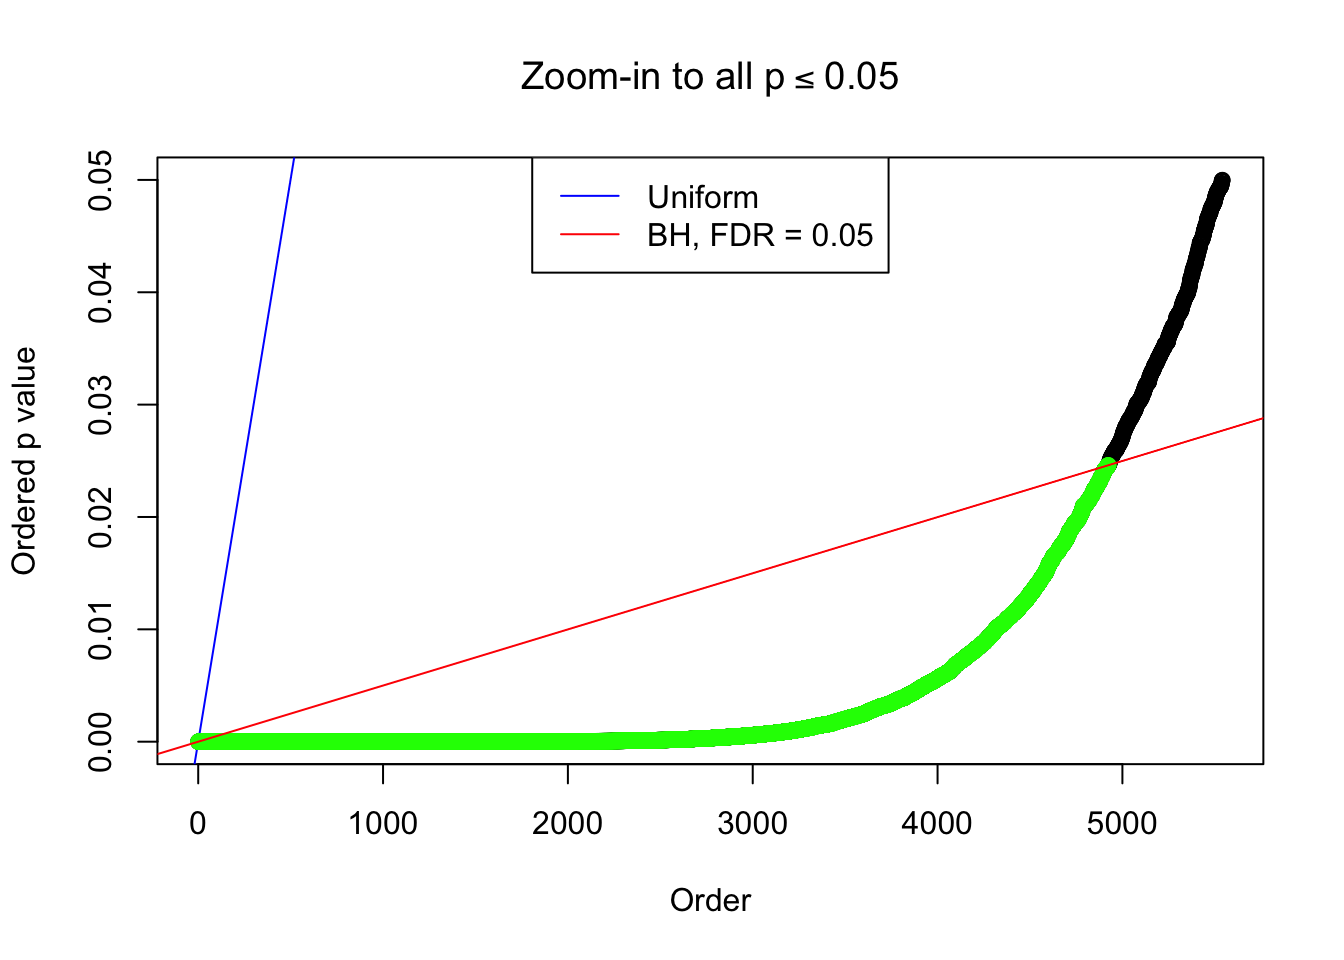
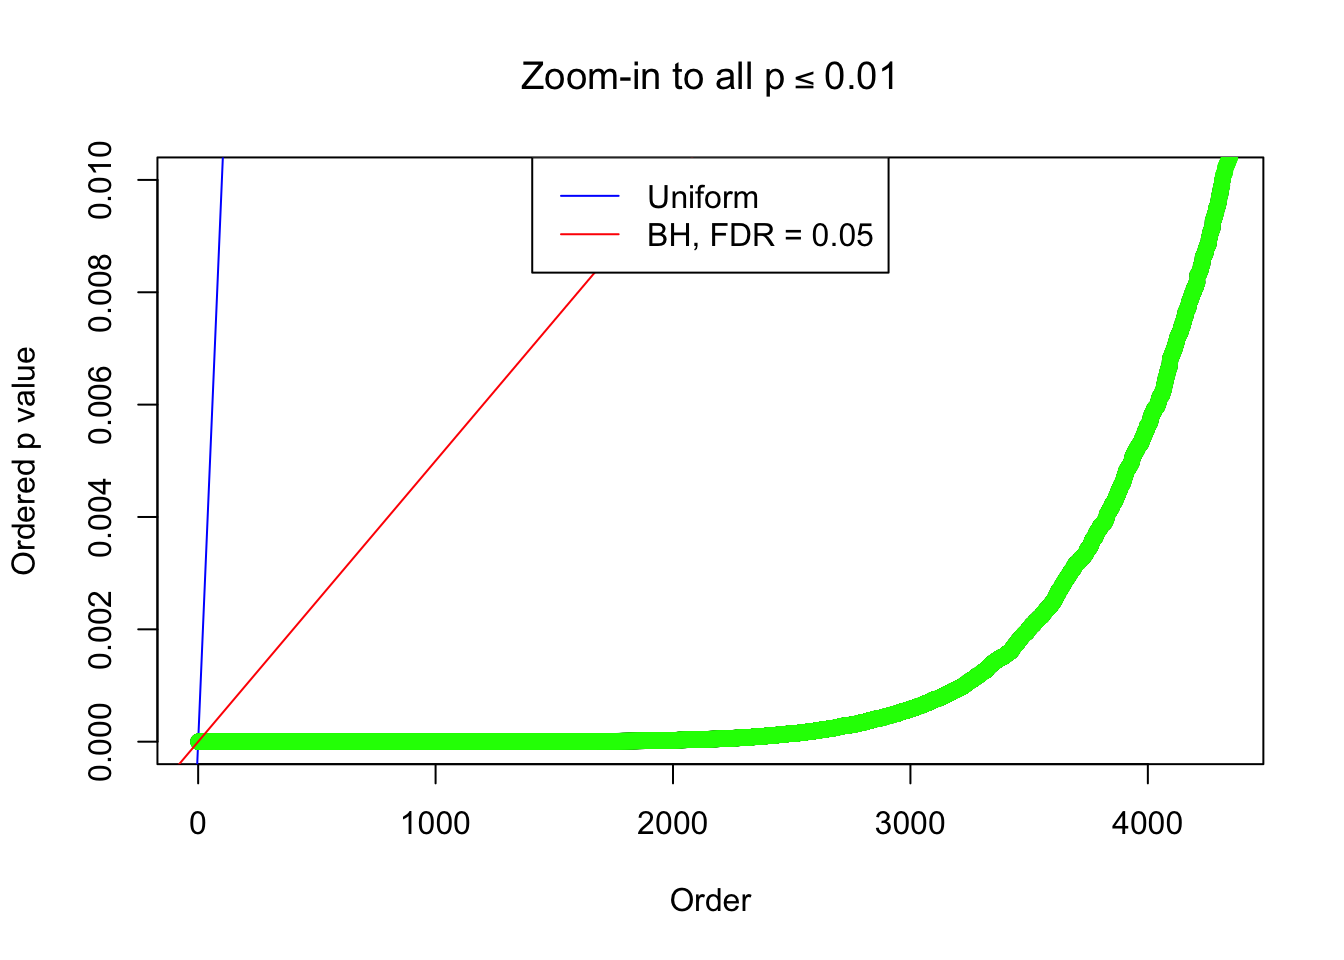
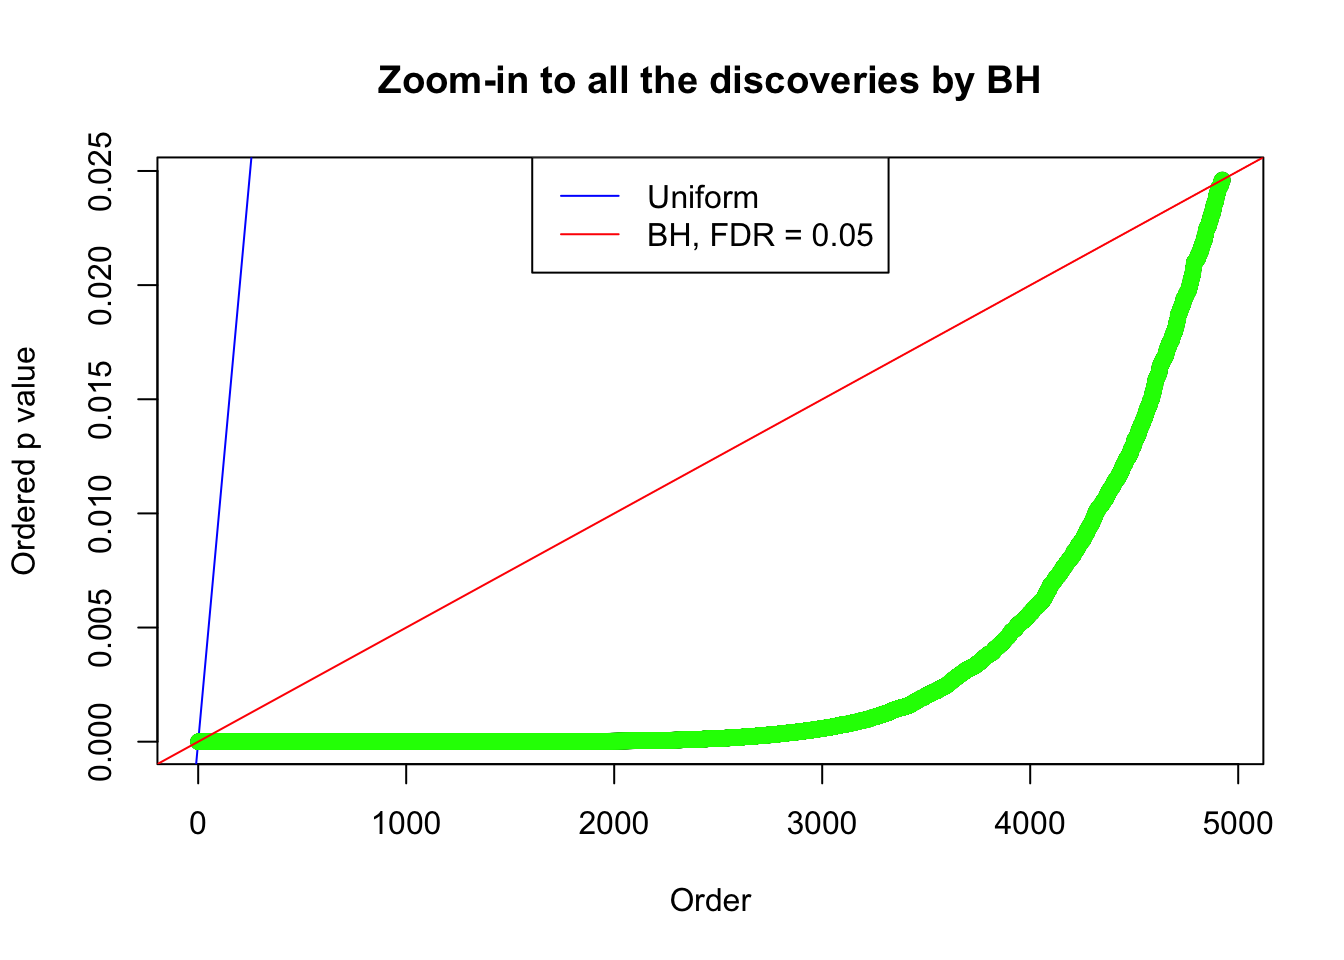
By the way, BH procedure seems very sensible in this task. It gives a lot of discoveries even when SNR = 1 that are too many to be credibly seen as from correlated null. Even SNR = 0 case, BH arguably gives more than expected discoveries, which indicates it’s more likely to be true effects rather than correlation.
So at this moment, we should concentrate on larger effects, whereas keep the SNR = 1 case, as well as BH’s “surprisingly good performance” in mind.
Session information
sessionInfo()R version 3.4.2 (2017-09-28)
Platform: x86_64-apple-darwin15.6.0 (64-bit)
Running under: macOS Sierra 10.12.6
Matrix products: default
BLAS: /Library/Frameworks/R.framework/Versions/3.4/Resources/lib/libRblas.0.dylib
LAPACK: /Library/Frameworks/R.framework/Versions/3.4/Resources/lib/libRlapack.dylib
locale:
[1] en_US.UTF-8/en_US.UTF-8/en_US.UTF-8/C/en_US.UTF-8/en_US.UTF-8
attached base packages:
[1] stats graphics grDevices utils datasets methods base
other attached packages:
[1] cvxr_0.0.0.9400 EQL_1.0-0 ttutils_1.0-1 ashr_2.1-27
loaded via a namespace (and not attached):
[1] Rcpp_0.12.13 knitr_1.17 magrittr_1.5
[4] MASS_7.3-47 doParallel_1.0.11 pscl_1.5.2
[7] SQUAREM_2017.10-1 lattice_0.20-35 foreach_1.4.3
[10] stringr_1.2.0 tools_3.4.2 parallel_3.4.2
[13] grid_3.4.2 git2r_0.19.0 htmltools_0.3.6
[16] iterators_1.0.8 yaml_2.1.14 rprojroot_1.2
[19] digest_0.6.12 gmp_0.5-13.1 Matrix_1.2-11
[22] codetools_0.2-15 evaluate_0.10.1 rmarkdown_1.6
[25] stringi_1.1.5 compiler_3.4.2 backports_1.1.1
[28] truncnorm_1.0-7 This R Markdown site was created with workflowr