Improvement on Implementation with Rmosek: Normalization
Lei Sun
2017-05-09
Last updated: 2017-05-09
Code version: 85b0795
Introduction
When fitting Gaussian derivatives, normalization could potentially increase the parity in the magnitude of the coefficients and thus make the results more accurate.
data.list = readRDS("../output/z_null_liver_777_select.RDS")
zscore = data.list[[3]]
sel.num = length(zscore)
data.list.index = readRDS("../output/z_null_liver_777_select_index.RDS")
ord = data.list.index[[3]]$gd.ord
source("../code/gdash.R")
library(ashr)
library(PolynomF)
x <- polynom()
H <- polylist(x, - 1 + x^2)
for(n in 2 : 19)
H[[n+1]] <- x * H[[n]] - n * H[[n-1]]Correlated null
Fitted w: -0.03642797 0.2788315 0.02632224 -0.106871
Time Cost in Seconds: 0.492 0.022 0.493 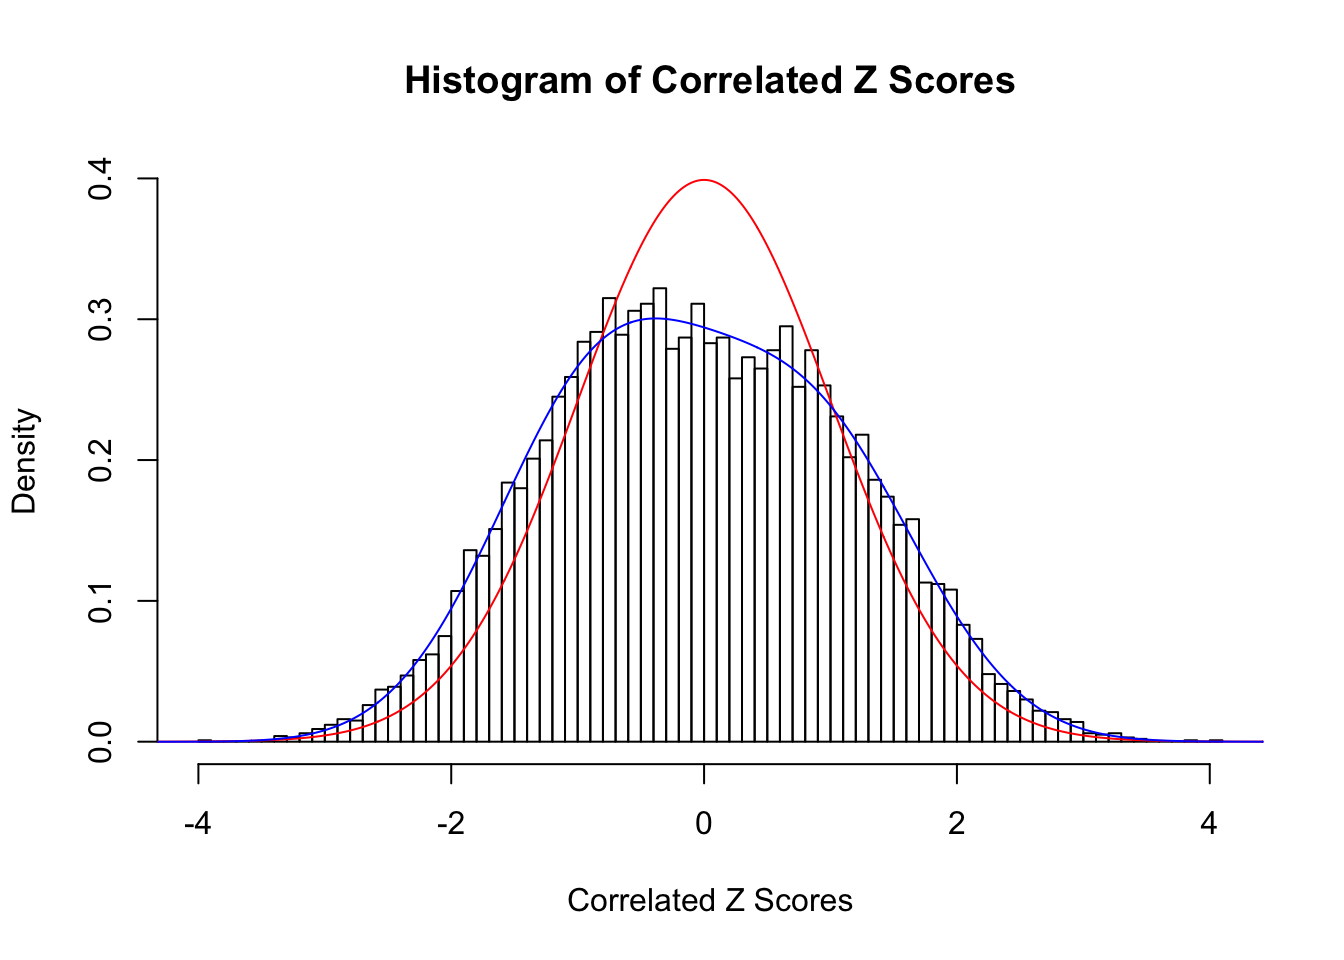
Fitted w: 0.03361434 1.037918 -0.3782364 0.9186735 -0.6135029 0.6083007 -0.5077214 0.2384846 -0.2000794
Time Cost in Seconds: 0.522 0.013 0.46 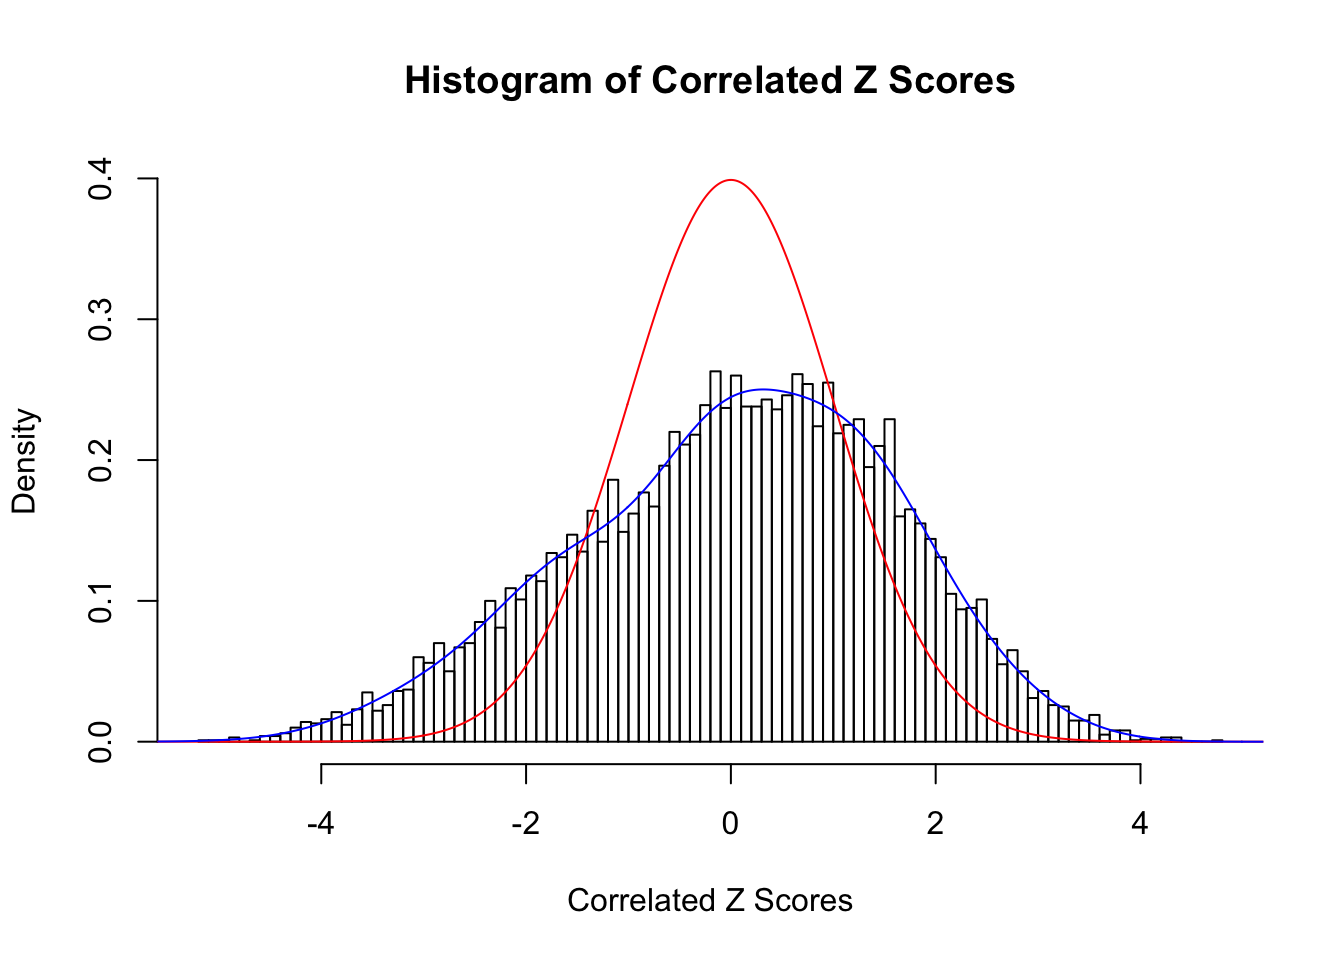
Fitted w: 0.02273596 1.301977 0.05448238 0.8574552 -0.1466924 0.09679719 -0.3403967 -0.1284122 -0.1752019
Time Cost in Seconds: 0.527 0.01 0.437 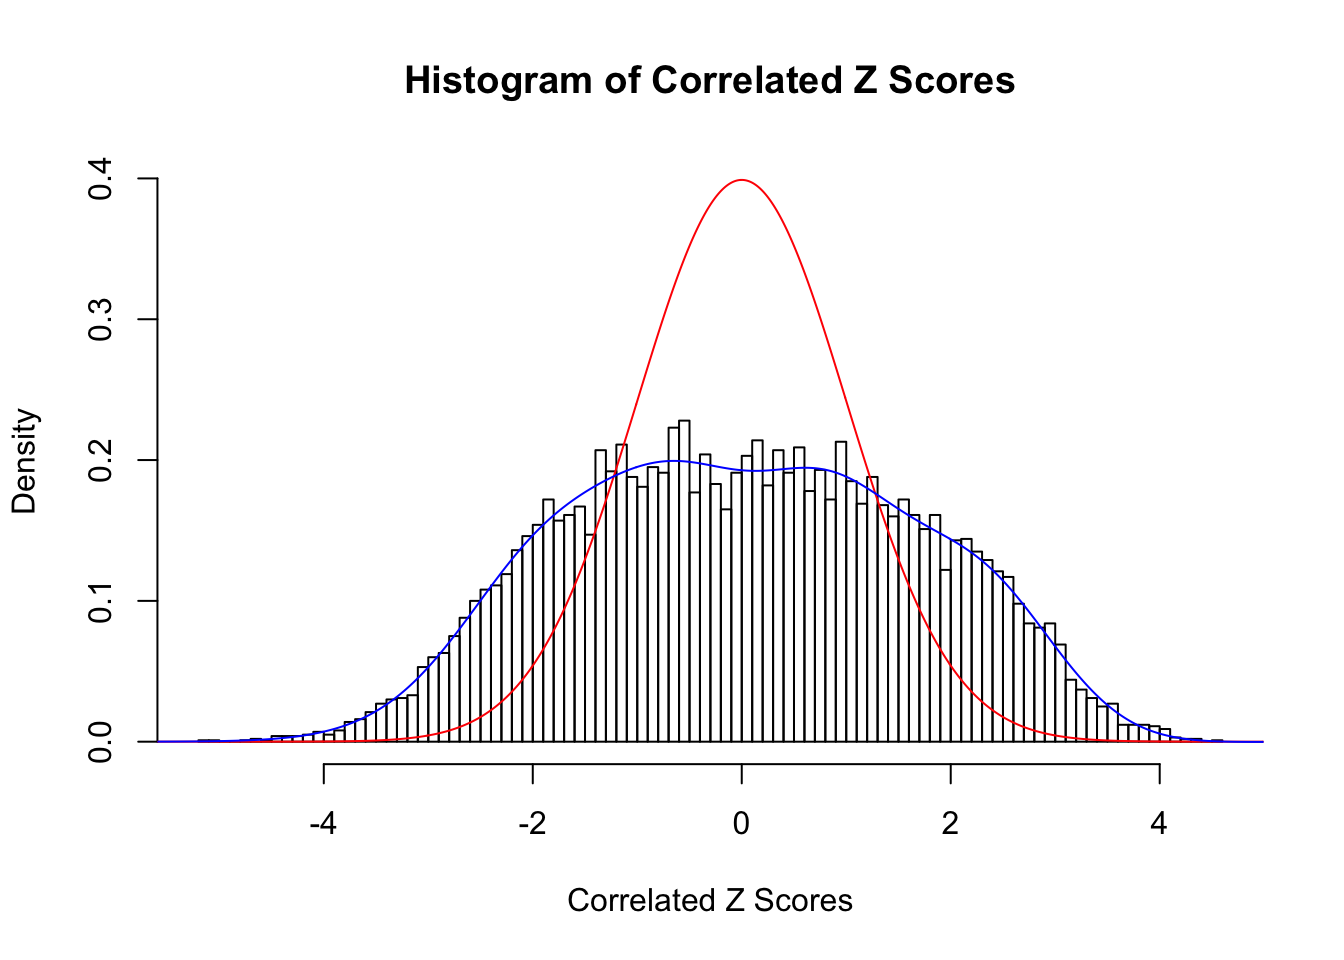
Fitted w: 0.04544396 -0.1800044 0.02158272 0.04857491
Time Cost in Seconds: 0.491 0.009 0.371 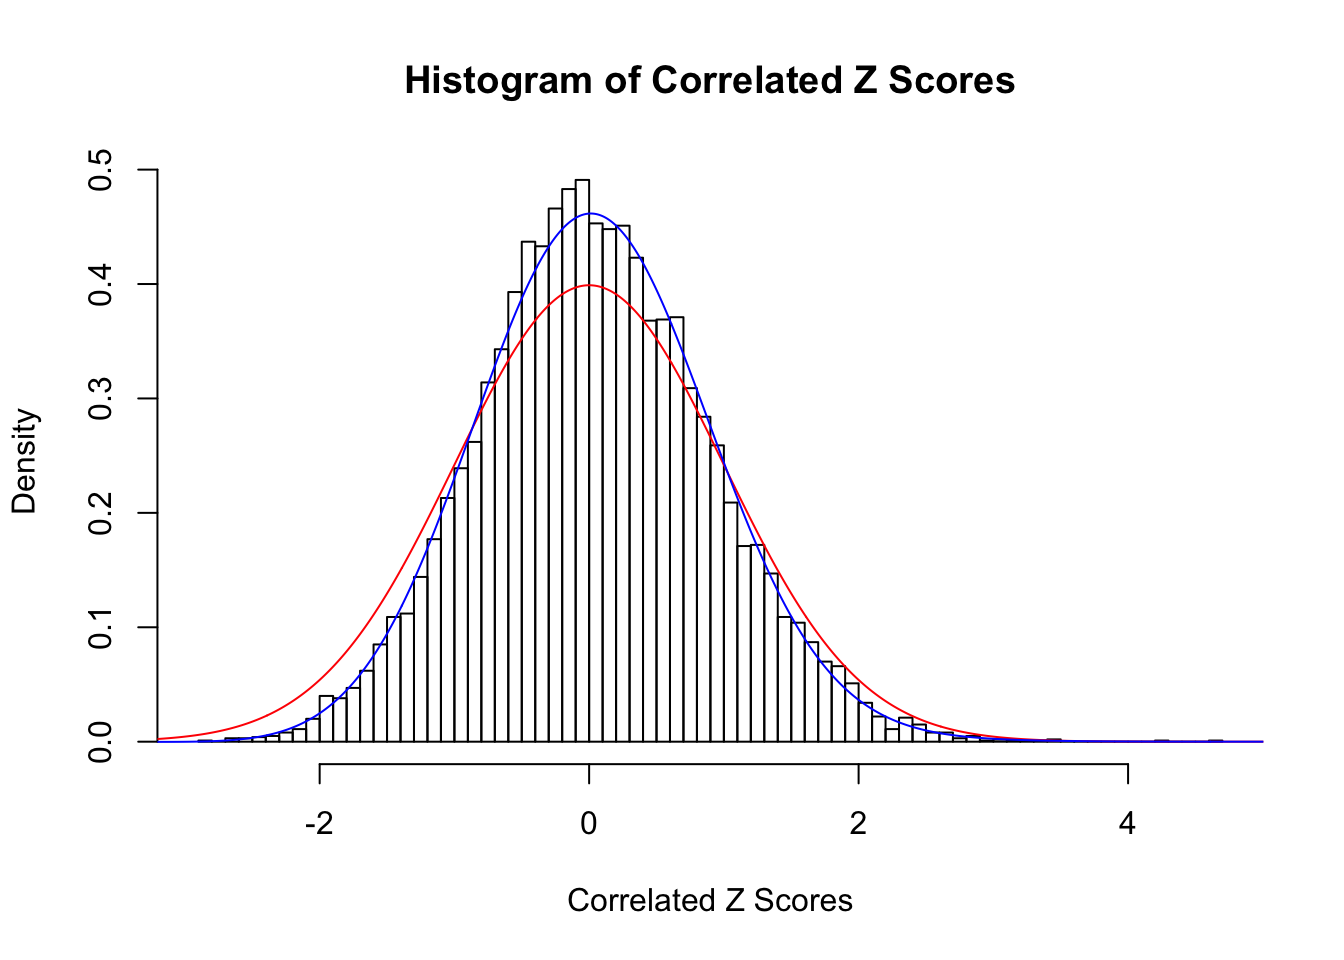
Fitted w: 0.006084177 0.5623754 -0.02229827 0.1278911
Time Cost in Seconds: 0.357 0.006 0.377 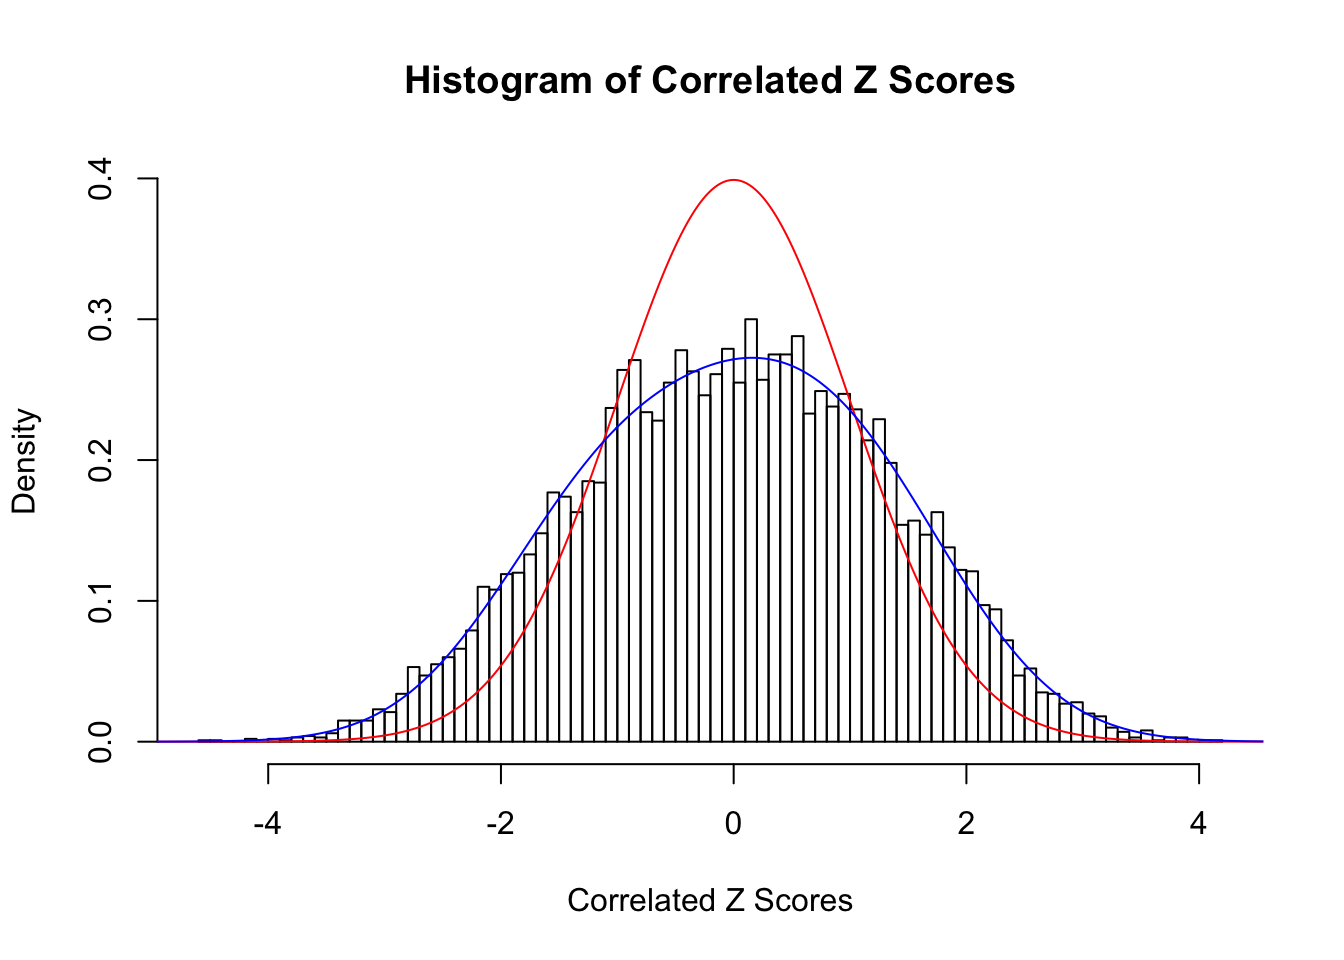
Signal \(+\) correlated error
Converged: TRUE
Number of Iteration: 21
Time Cost in Seconds: 38.654 2.382 38.811 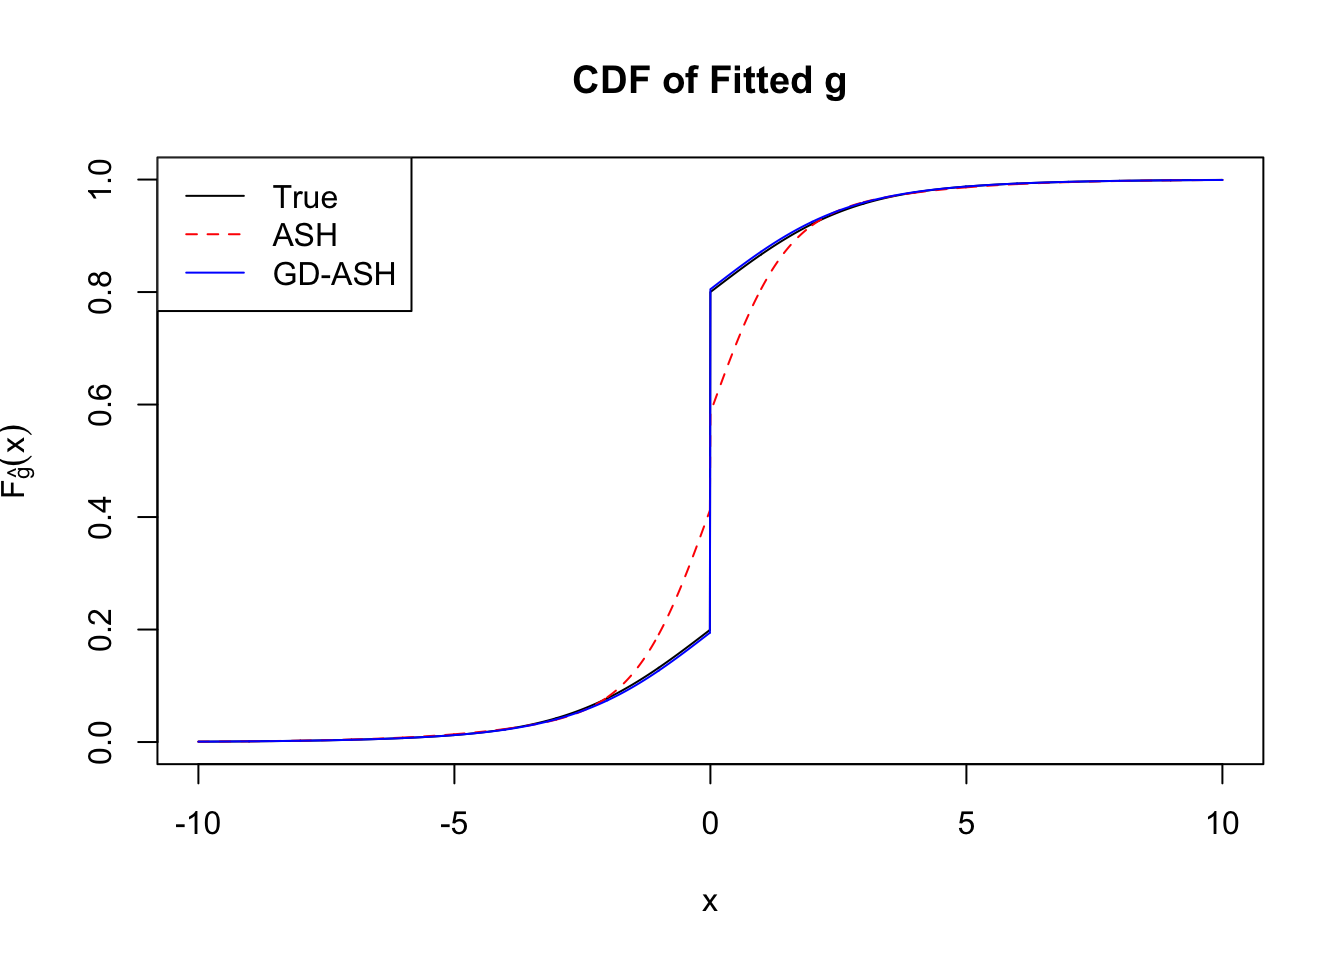
Converged: TRUE
Number of Iteration: 24
Time Cost in Seconds: 65.451 4.351 58.666 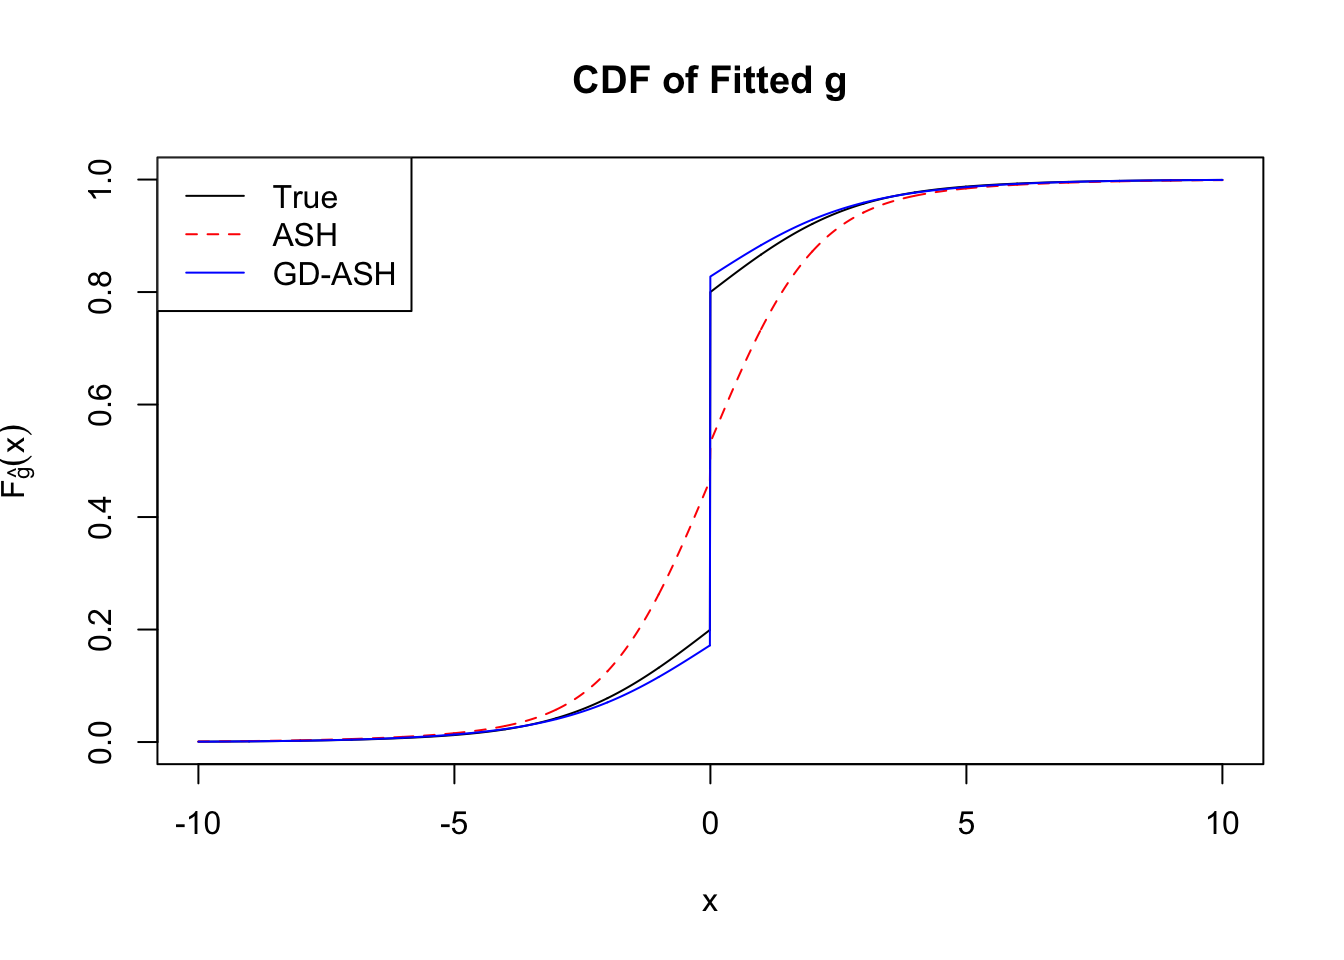
Converged: TRUE
Number of Iteration: 21
Time Cost in Seconds: 53.677 3.877 53.751 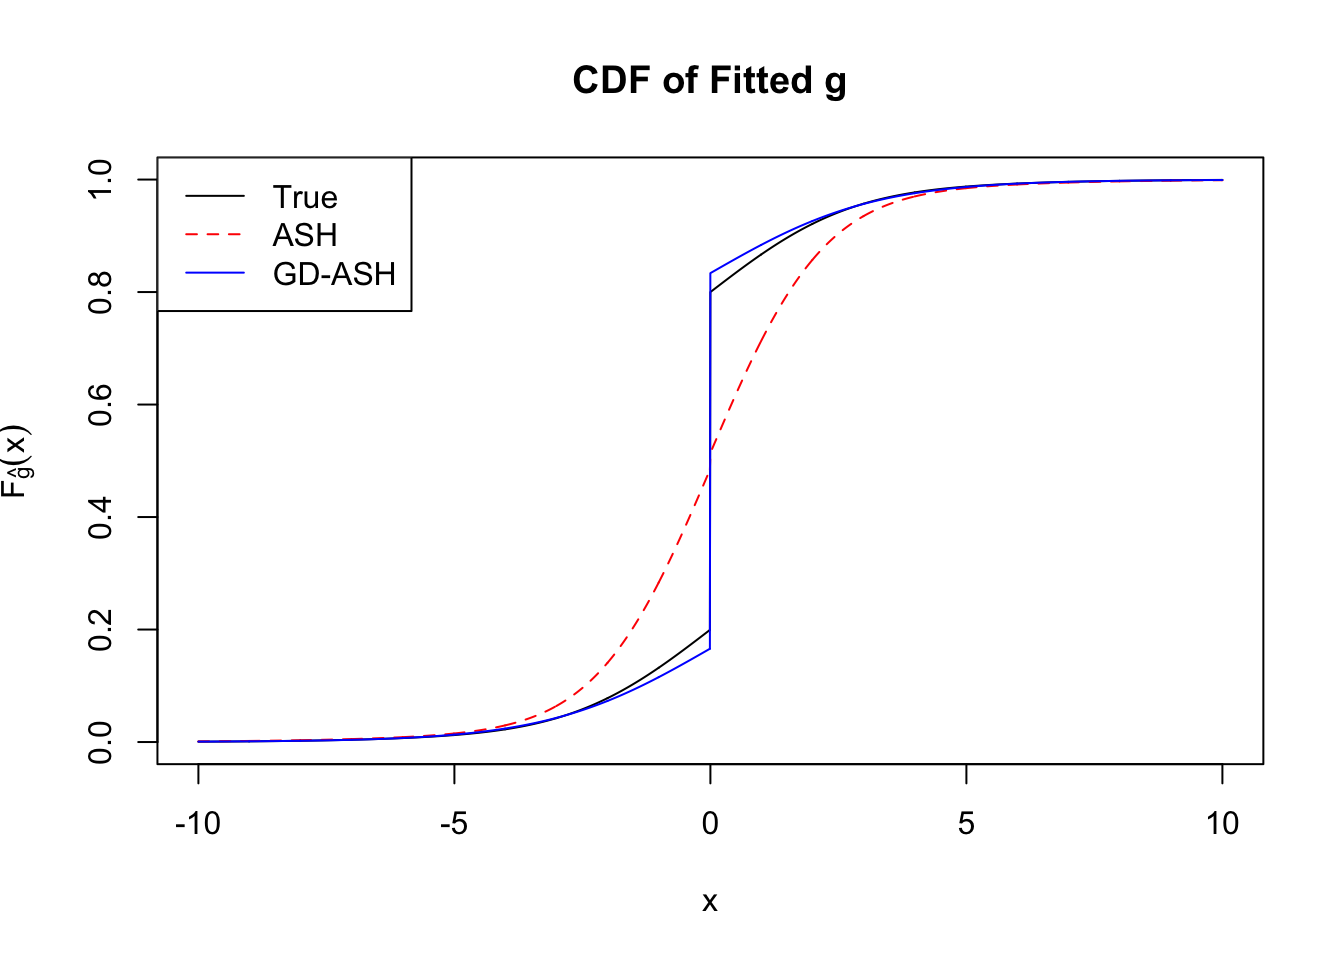
Converged: TRUE
Number of Iteration: 27
Time Cost in Seconds: 59.707 3.056 38.881 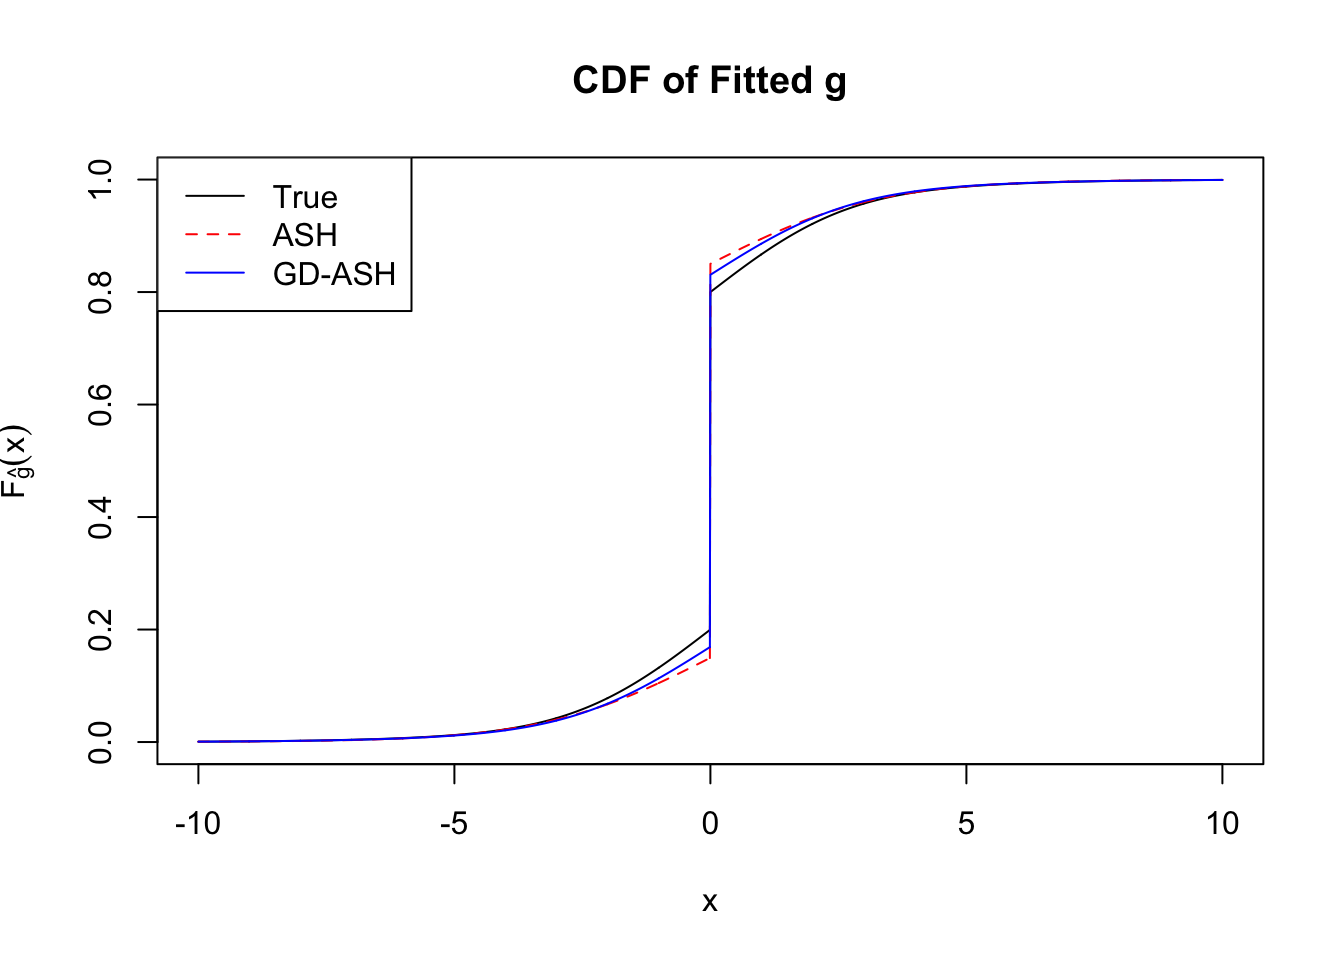
Converged: TRUE
Number of Iteration: 12
Time Cost in Seconds: 30.248 1.343 23.311 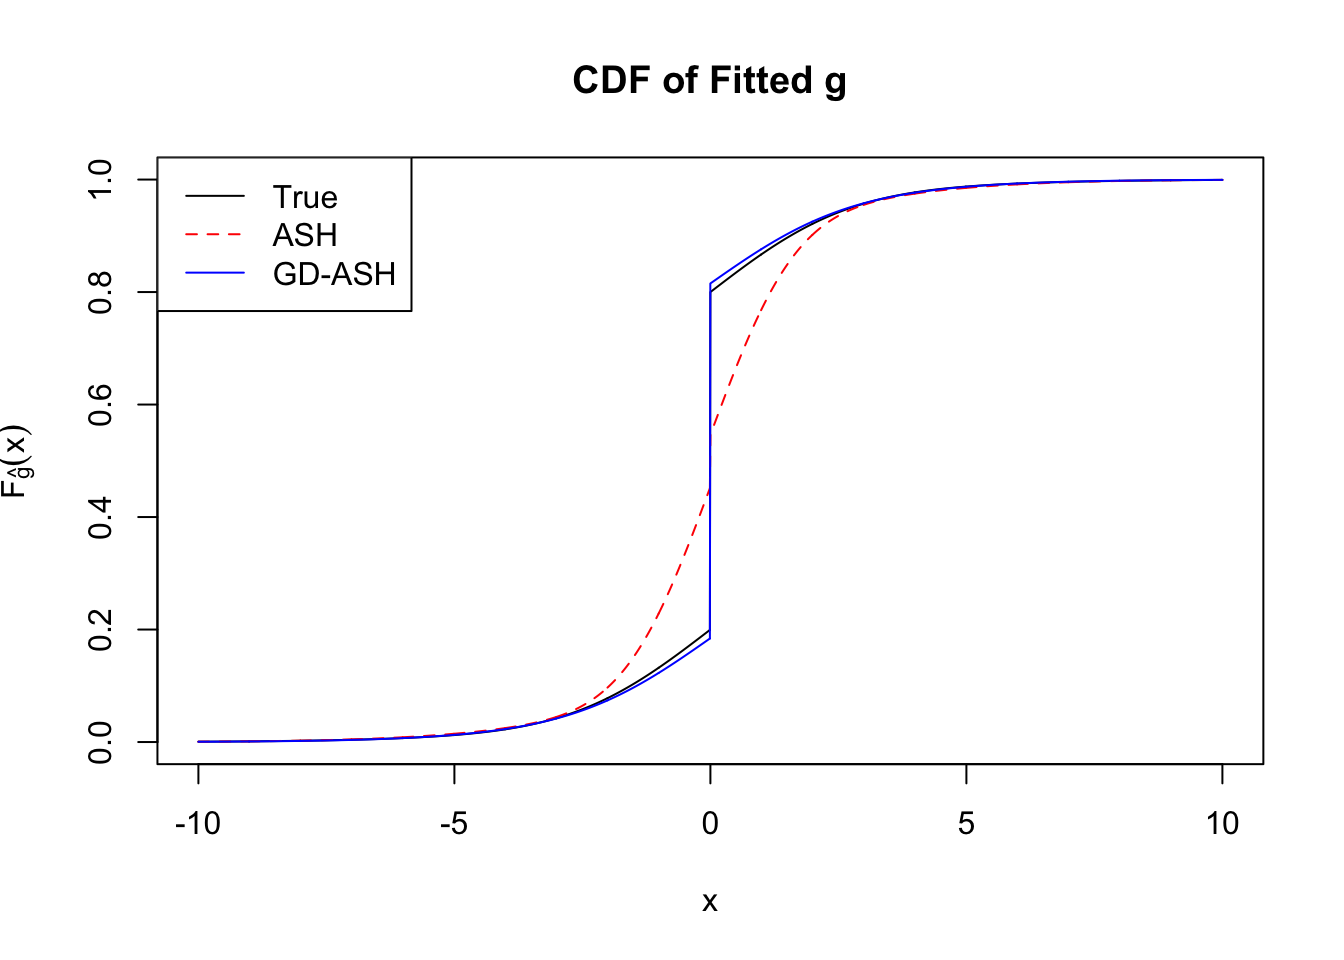
Conclusion
It appears normalization indeed increases the accuracy, although the computation seems slowing down a little bit? Not sure.
Session information
sessionInfo()R version 3.3.3 (2017-03-06)
Platform: x86_64-apple-darwin13.4.0 (64-bit)
Running under: macOS Sierra 10.12.4
locale:
[1] en_US.UTF-8/en_US.UTF-8/en_US.UTF-8/C/en_US.UTF-8/en_US.UTF-8
attached base packages:
[1] stats graphics grDevices utils datasets methods base
loaded via a namespace (and not attached):
[1] backports_1.0.5 magrittr_1.5 rprojroot_1.2 tools_3.3.3
[5] htmltools_0.3.5 yaml_2.1.14 Rcpp_0.12.10 stringi_1.1.2
[9] rmarkdown_1.3 knitr_1.15.1 git2r_0.18.0 stringr_1.2.0
[13] digest_0.6.11 evaluate_0.10 This R Markdown site was created with workflowr