CASH Simulations: lfsr Included
Lei Sun
2018-02-10
Last updated: 2018-05-23
workflowr checks: (Click a bullet for more information)-
✔ R Markdown file: up-to-date
Great! Since the R Markdown file has been committed to the Git repository, you know the exact version of the code that produced these results.
-
✔ Environment: empty
Great job! The global environment was empty. Objects defined in the global environment can affect the analysis in your R Markdown file in unknown ways. For reproduciblity it’s best to always run the code in an empty environment.
-
✔ Seed:
set.seed(12345)The command
set.seed(12345)was run prior to running the code in the R Markdown file. Setting a seed ensures that any results that rely on randomness, e.g. subsampling or permutations, are reproducible. -
✔ Session information: recorded
Great job! Recording the operating system, R version, and package versions is critical for reproducibility.
-
Great! You are using Git for version control. Tracking code development and connecting the code version to the results is critical for reproducibility. The version displayed above was the version of the Git repository at the time these results were generated.✔ Repository version: 0cdcf7b
Note that you need to be careful to ensure that all relevant files for the analysis have been committed to Git prior to generating the results (you can usewflow_publishorwflow_git_commit). workflowr only checks the R Markdown file, but you know if there are other scripts or data files that it depends on. Below is the status of the Git repository when the results were generated:
Note that any generated files, e.g. HTML, png, CSS, etc., are not included in this status report because it is ok for generated content to have uncommitted changes.Ignored files: Ignored: .DS_Store Ignored: .Rhistory Ignored: .Rproj.user/ Ignored: analysis/.DS_Store Ignored: analysis/BH_robustness_cache/ Ignored: analysis/FDR_Null_cache/ Ignored: analysis/FDR_null_betahat_cache/ Ignored: analysis/Rmosek_cache/ Ignored: analysis/StepDown_cache/ Ignored: analysis/alternative2_cache/ Ignored: analysis/alternative_cache/ Ignored: analysis/ash_gd_cache/ Ignored: analysis/average_cor_gtex_2_cache/ Ignored: analysis/average_cor_gtex_cache/ Ignored: analysis/brca_cache/ Ignored: analysis/cash_deconv_cache/ Ignored: analysis/cash_fdr_1_cache/ Ignored: analysis/cash_fdr_2_cache/ Ignored: analysis/cash_fdr_3_cache/ Ignored: analysis/cash_fdr_4_cache/ Ignored: analysis/cash_fdr_5_cache/ Ignored: analysis/cash_fdr_6_cache/ Ignored: analysis/cash_plots_2_cache/ Ignored: analysis/cash_plots_cache/ Ignored: analysis/cash_sim_1_cache/ Ignored: analysis/cash_sim_2_cache/ Ignored: analysis/cash_sim_3_cache/ Ignored: analysis/cash_sim_4_cache/ Ignored: analysis/cash_sim_5_cache/ Ignored: analysis/cash_sim_6_cache/ Ignored: analysis/cash_sim_7_cache/ Ignored: analysis/correlated_z_2_cache/ Ignored: analysis/correlated_z_3_cache/ Ignored: analysis/correlated_z_cache/ Ignored: analysis/create_null_cache/ Ignored: analysis/cutoff_null_cache/ Ignored: analysis/design_matrix_2_cache/ Ignored: analysis/design_matrix_cache/ Ignored: analysis/diagnostic_ash_cache/ Ignored: analysis/diagnostic_correlated_z_2_cache/ Ignored: analysis/diagnostic_correlated_z_3_cache/ Ignored: analysis/diagnostic_correlated_z_cache/ Ignored: analysis/diagnostic_plot_2_cache/ Ignored: analysis/diagnostic_plot_cache/ Ignored: analysis/efron_leukemia_cache/ Ignored: analysis/fitting_normal_cache/ Ignored: analysis/gaussian_derivatives_2_cache/ Ignored: analysis/gaussian_derivatives_3_cache/ Ignored: analysis/gaussian_derivatives_4_cache/ Ignored: analysis/gaussian_derivatives_5_cache/ Ignored: analysis/gaussian_derivatives_cache/ Ignored: analysis/gd-ash_cache/ Ignored: analysis/gd_delta_cache/ Ignored: analysis/gd_lik_2_cache/ Ignored: analysis/gd_lik_cache/ Ignored: analysis/gd_w_cache/ Ignored: analysis/knockoff_10_cache/ Ignored: analysis/knockoff_2_cache/ Ignored: analysis/knockoff_3_cache/ Ignored: analysis/knockoff_4_cache/ Ignored: analysis/knockoff_5_cache/ Ignored: analysis/knockoff_6_cache/ Ignored: analysis/knockoff_7_cache/ Ignored: analysis/knockoff_8_cache/ Ignored: analysis/knockoff_9_cache/ Ignored: analysis/knockoff_cache/ Ignored: analysis/knockoff_var_cache/ Ignored: analysis/marginal_z_alternative_cache/ Ignored: analysis/marginal_z_cache/ Ignored: analysis/mosek_reg_2_cache/ Ignored: analysis/mosek_reg_4_cache/ Ignored: analysis/mosek_reg_5_cache/ Ignored: analysis/mosek_reg_6_cache/ Ignored: analysis/mosek_reg_cache/ Ignored: analysis/pihat0_null_cache/ Ignored: analysis/plot_diagnostic_cache/ Ignored: analysis/poster_obayes17_cache/ Ignored: analysis/real_data_simulation_2_cache/ Ignored: analysis/real_data_simulation_3_cache/ Ignored: analysis/real_data_simulation_4_cache/ Ignored: analysis/real_data_simulation_5_cache/ Ignored: analysis/real_data_simulation_cache/ Ignored: analysis/rmosek_primal_dual_2_cache/ Ignored: analysis/rmosek_primal_dual_cache/ Ignored: analysis/seqgendiff_cache/ Ignored: analysis/simulated_correlated_null_2_cache/ Ignored: analysis/simulated_correlated_null_3_cache/ Ignored: analysis/simulated_correlated_null_cache/ Ignored: analysis/simulation_real_se_2_cache/ Ignored: analysis/simulation_real_se_cache/ Ignored: analysis/smemo_2_cache/ Ignored: data/LSI/ Ignored: docs/.DS_Store Ignored: docs/figure/.DS_Store Ignored: output/fig/
Expand here to see past versions:
| File | Version | Author | Date | Message |
|---|---|---|---|---|
| rmd | 0cdcf7b | LSun | 2018-05-23 | wflow_publish(“analysis/cash_plots_2.rmd”) |
| html | 1eec7b1 | LSun | 2018-05-23 | Build site. |
| rmd | f912730 | LSun | 2018-05-23 | wflow_publish(“analysis/cash_plots_2.rmd”) |
| rmd | f178424 | Lei Sun | 2018-05-21 | multiple priors |
| rmd | 637bdce | LSun | 2018-05-21 | simulations |
| rmd | fe910f1 | Lei Sun | 2018-05-21 | plotting |
| rmd | e5852e2 | Lei Sun | 2018-05-20 | replot |
| rmd | 3dc5e78 | Lei Sun | 2018-05-20 | revision |
| rmd | f387ded | Lei Sun | 2018-05-20 | revision |
| rmd | 86fc901 | Lei Sun | 2018-05-20 | new simulation scheme |
| html | d51ff50 | LSun | 2018-05-18 | Build site. |
| rmd | 7c1e2f8 | LSun | 2018-05-18 | wflow_publish(c(“analysis/cash_plots_2.rmd”, |
| rmd | c818b3f | Lei Sun | 2018-05-17 | lfsr simulations |
source("../code/gdfit.R")
source("../code/gdash_lik.R")
source("../code/count_to_summary.R")
library(ashr)
library(locfdr)
library(qvalue)
library(reshape2)
library(ggplot2)
mean_sdp <- function (x) {
m <- mean(x)
ymax <- m + sd(x)
return(c(y = m, ymax = ymax, ymin = m))
}
mad.mean <- function (x) {
return(mean(abs(x - median(x))))
}
FDP <- function (FDR, qvalue, beta) {
return(sum(qvalue <= FDR & beta == 0) / max(sum(qvalue <= FDR), 1))
}
pFDP <- function (FDR, qvalue, beta) {
return(sum(qvalue <= FDR & beta == 0) / sum(qvalue <= FDR))
}
TDP <- function (FDR, qvalue, beta) {
return(sum(qvalue <= FDR & beta != 0) / sum(beta != 0))
}
FSP <- function (FSR, svalue, beta, betahat) {
return(sum(sign(betahat[svalue <= FSR]) != sign(beta[svalue <= FSR])) / max(sum(svalue <= FSR), 1))
}r <- readRDS("../data/liver.rds")ngene <- 1e4
top_genes_index = function (g, X) {
return(order(rowSums(X), decreasing = TRUE)[1 : g])
}
lcpm = function (r) {
R = colSums(r)
t(log2(((t(r) + 0.5) / (R + 1)) * 10^6))
}
Y = lcpm(r)
subset = top_genes_index(ngene, Y)
r = r[subset,]nsamp <- 5
pi0.vec <- c(0.5, 0.9, 0.99)
q.vec <- seq(0.001, 0.20, by = 0.001)
q <- 0.1
z.over <- 1.05
z.under <- 0.95
method.name.FDR <- c("BHq", "qvalue", "locfdr", "ASH", "CASH")
method.name.FSR <- c("ASH", "CASH")
method.col.FDR <- scales::hue_pal()(length(method.name.FDR))
method.col.pi0hat <- method.col.FDR[-1]
method.col.FSR <- method.col.FDR[4 : 5]FXP.ggdata <- function (FXP.list, Noise) {
FXP.mean <- lapply(FXP.list, function (FXP.mat, Noise) {
rbind(
All = colMeans(FXP.mat, na.rm = TRUE),
apply(FXP.mat, 2, tapply, Noise, mean, na.rm = TRUE)
)
}, Noise)
FXP.ggdata <- melt(FXP.mean, value.name = "mean", varnames = c("Noise", "Method"))
FXP.q975 <- lapply(FXP.list, function (FXP.mat, Noise) {
rbind(
All = apply(FXP.mat, 2, quantile, probs = 0.975, na.rm = TRUE),
apply(FXP.mat, 2, tapply, Noise, quantile, probs = 0.975, na.rm = TRUE)
)
}, Noise)
FXP.q975.ggdata <- melt(FXP.q975, value.name = "q975")
FXP.q025 <- lapply(FXP.list, function (FXP.mat, Noise) {
rbind(
All = apply(FXP.mat, 2, quantile, probs = 0.025, na.rm = TRUE),
apply(FXP.mat, 2, tapply, Noise, quantile, probs = 0.025, na.rm = TRUE)
)
}, Noise)
FXP.q025.ggdata <- melt(FXP.q025, value.name = "q025")
FXP.ggdata <- cbind.data.frame(
FXP.ggdata,
q975 = FXP.q975.ggdata$q975,
q025 = FXP.q025.ggdata$q025
)
FXP.ggdata$L1 <- as.numeric(FXP.ggdata$L1)
return(FXP.ggdata)
}Normal
\[ g_1 = N\left(0, 2^2\right) \]
plotx <- seq(-6, 6, by = 0.01)
plot(plotx, plotx, ylim = c(0, dnorm(0)),
     xlab = expression(theta), ylab = expression(g(theta)),
     type = "n")
lines(plotx, dnorm(plotx), lty = 2)
lines(plotx, dnorm(plotx, 0, 2), col = "blue")
legend("topright", lty = c(1, 2), col = c(4, 1), c("g", "N(0, 1)"))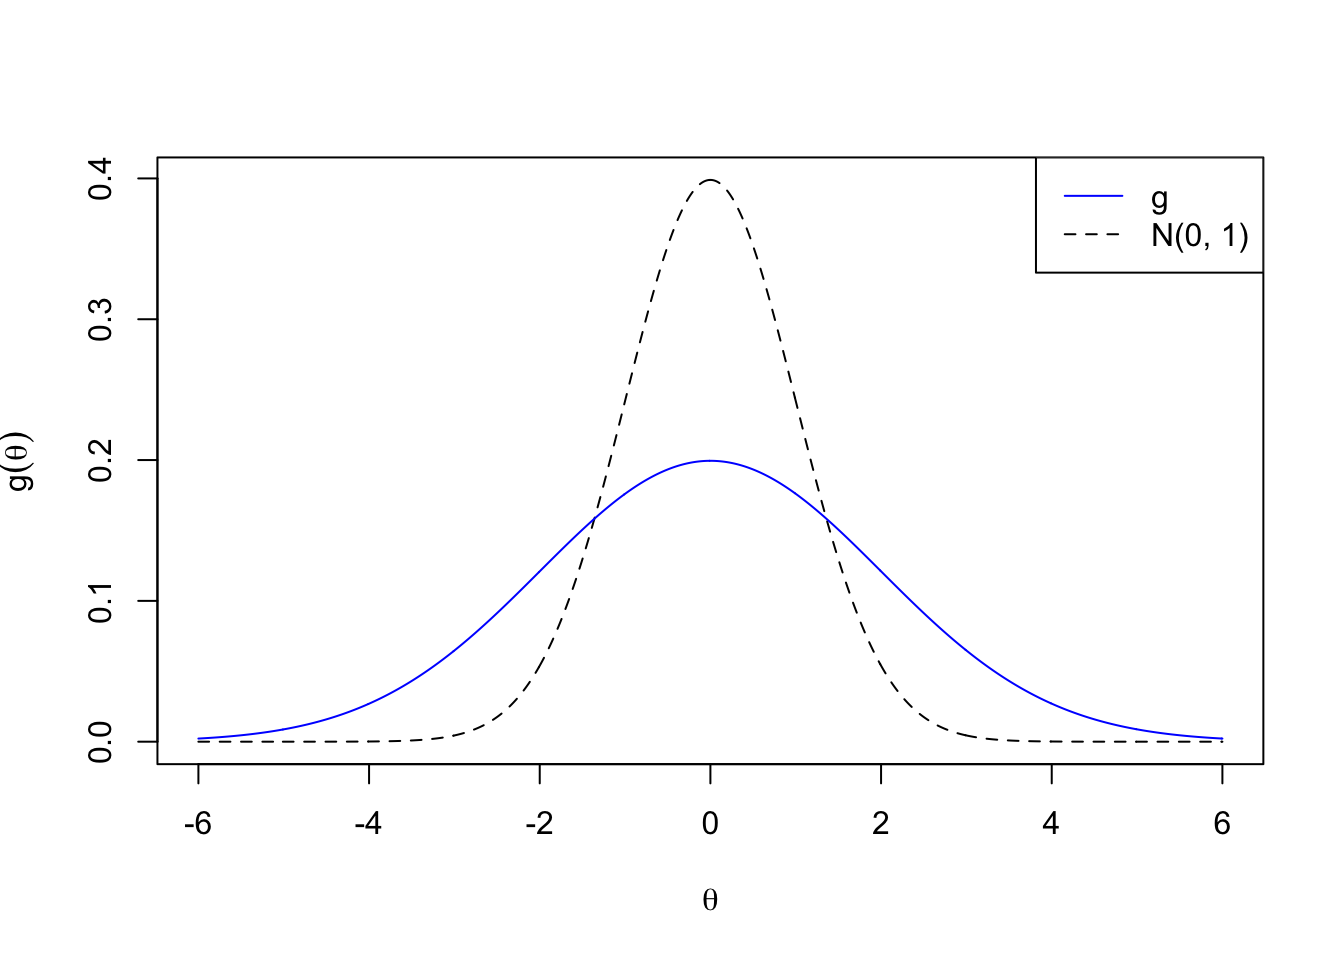
Expand here to see past versions of g1-1.png:
| Version | Author | Date |
|---|---|---|
| 1eec7b1 | LSun | 2018-05-23 |
# n01 <- cbind.data.frame(x = plotx, n01 = dnorm(plotx))
# g1 <- cbind.data.frame(n01, g1 = dnorm(plotx, 0, 2))
# g1.ggdata <- melt(g1, id.vars = "x", variable.name = "g", value.name = "pdf")

# g.plot <- ggplot(data = g1.ggdata, aes(x = x, y = pdf, col = g, linetype = g)) +
#   geom_line() +
#   scale_color_manual(values = c("black", "blue")) +
#   scale_linetype_manual(values = c("dashed", "solid")) +
#   labs(x = expression(theta), y = expression(g(theta))) +
#   annotate("text", x = -Inf, y = Inf, label = "Normal", vjust = 1, hjust = 0, color = "blue", size = 15) +
#   theme(axis.title.x = element_text(size = 15),
#         axis.text.x = element_text(size = 10, hjust = 1),
#         axis.title.y = element_text(size = 15),
#         axis.text.y = element_text(size = 10),
#         strip.text = element_text(size = 15),
#         legend.position = "none",
#         legend.background = element_rect(color = "grey"),
#         legend.text = element_text(size = 12))
#
# g.plot
pi0hat.mat <- cbind.data.frame(pi0 = factor(do.call(rbind, pi0.list)), do.call(rbind, pi0hat.list))
FDP.list <- lapply(q.vec, function (q) {
t(mapply(function (qvalue.mat, beta, q) {
apply(qvalue.mat, 2, function (qvalue, q, beta) {
FDP(q, qvalue, beta)
}, q, beta)
}, qvalue.list, beta.list, q))
})
names(FDP.list) <- q.vec
FSP.list <- lapply(q.vec, function (s) {
t(mapply(function (svalue.mat, beta, betahat, s) {
apply(svalue.mat, 2, function (svalue, s, beta, betahat) {
FSP(s, svalue, beta, betahat)
}, s, beta, betahat)
}, svalue.list, beta.list, betahat.list, s))
})
names(FSP.list) <- q.vec
TDP.list <- lapply(q.vec, function(q) {
t(mapply(function(qvalue.mat, beta, q) {
apply(qvalue.mat, 2, function (qvalue, q, beta) {
TDP(q, qvalue, beta)
}, q, beta)
}, qvalue.list, beta.list, q))
})
names(TDP.list) <- q.vecsd.z <- sapply(z.list, sd)
Noise <- cut(sd.z, breaks = c(0, quantile(sd.z, probs = 1 : 2 / 3), Inf), labels = c("Deflated Noise", "In-between", "Inflated Noise"))
# Noise <- cut(sd.z, breaks = c(0, z.under, z.over, Inf), labels = c("Deflated Noise", "In-between", "Inflated Noise"))
##=================================================
pi0hat.noise.mat <- rbind.data.frame(
cbind.data.frame(Noise = rep("All", length(Noise)), pi0hat.mat),
cbind.data.frame(Noise, pi0hat.mat)
)
pi0hat.ggdata <- melt(pi0hat.noise.mat, id.vars = c("Noise", "pi0"), variable.name = "Method", value.name = "pi0hat")
pi0hat.plot <- ggplot(data = pi0hat.ggdata, aes(x = pi0, y = pi0hat)) +
geom_boxplot(aes(fill = Method, color = Method), outlier.color = NULL, outlier.size = 0.5
# , outlier.shape = NA
) +
scale_color_manual(values = method.col.pi0hat) +
scale_fill_manual(values = alpha(method.col.pi0hat, 0.35)) +
facet_wrap(~Noise, nrow = 1, ncol = 4) +
geom_hline(yintercept = pi0.vec, col = "black", linetype = "dashed", size = 1) +
labs(x = expression(pi[0]), y = expression(hat(pi)[0])) +
theme(axis.title.x = element_text(size = 15),
axis.text.x = element_text(size = 10, angle = 45, hjust = 1),
axis.title.y = element_text(size = 15),
axis.text.y = element_text(size = 10),
strip.text = element_text(size = 15),
legend.position = "top",
legend.background = element_rect(color = "grey"),
legend.text = element_text(size = 12))
##==================================================
FDP.calib.ggdata <- FXP.ggdata(FDP.list, Noise)
FDR.calib.plot <- ggplot(data = FDP.calib.ggdata, aes(x = L1, y = mean, group = Method, col = Method)) +
geom_line() +
geom_ribbon(aes(ymin = q025, ymax = q975, fill = Method), alpha = 0.35, linetype = "blank") +
scale_color_manual(labels = method.name.FDR, values = method.col.FDR) +
scale_fill_manual(labels = method.name.FDR, values = method.col.FDR) +
facet_wrap(~Noise, nrow = 1, ncol = 4) +
geom_abline(slope = 1, intercept = 0, linetype = "dashed", size = 1, col = "black") +
labs(x = "Nominal FDR", y = "FDP") +
theme(axis.title.x = element_text(size = 12),
axis.text.x = element_text(size = 10, angle = 45, hjust = 1),
axis.title.y = element_text(size = 12),
axis.text.y = element_text(size = 10),
strip.text = element_text(size = 15),
legend.position = "top",
legend.background = element_rect(color = "grey"),
legend.text = element_text(size = 12))
##==================================================
FSP.calib.ggdata <- FXP.ggdata(FSP.list, Noise)
FSR.calib.plot <- ggplot(data = FSP.calib.ggdata, aes(x = L1, y = mean, group = Method, col = Method)) +
geom_line() +
geom_ribbon(aes(ymin = q025, ymax = q975, fill = Method), alpha = 0.35, linetype = "blank") +
scale_color_manual(labels = method.name.FSR, values = method.col.FSR) +
scale_fill_manual(labels = method.name.FSR, values = method.col.FSR) +
facet_wrap(~Noise, nrow = 1, ncol = 4) +
geom_abline(slope = 1, intercept = 0, linetype = "dashed", size = 1, col = "black") +
labs(x = "Nominal FSR", y = "FSP") +
theme(axis.title.x = element_text(size = 12),
axis.text.x = element_text(size = 10, angle = 45, hjust = 1),
axis.title.y = element_text(size = 12),
axis.text.y = element_text(size = 10),
strip.text = element_text(size = 15),
legend.position = "top",
legend.background = element_rect(color = "grey"),
legend.text = element_text(size = 12))
##============================================================
FDP.q <- FDP.list[[which(q.vec == q)]]
FDP.q.noise.mat <- rbind.data.frame(
cbind.data.frame(Noise = rep("All", length(Noise)),
pi0 = factor(do.call(rbind, pi0.list)),
FDP.q),
cbind.data.frame(Noise,
pi0 = factor(do.call(rbind, pi0.list)),
FDP.q)
)
FDP.q.ggdata <- melt(FDP.q.noise.mat, id.vars = c("Noise", "pi0"), variable.name = "Method", value.name = "FDP")
FDP.q.plot <- ggplot(data = FDP.q.ggdata, aes(x = pi0, y = FDP)) +
geom_boxplot(aes(fill = Method, color = Method), outlier.color = NULL, outlier.size = 0.5
# , outlier.shape = NA
) +
scale_color_manual(values = method.col.FDR) +
scale_fill_manual(values = alpha(method.col.FDR, 0.35)) +
facet_wrap(~Noise, nrow = 1, ncol = 4) +
geom_hline(yintercept = q, col = "black", linetype = "dashed", size = 1) +
labs(x = expression(pi[0]), y = "FDP") +
theme(axis.title.x = element_text(size = 15),
axis.text.x = element_text(size = 10, angle = 45, hjust = 1),
axis.title.y = element_text(size = 12),
axis.text.y = element_text(size = 10),
strip.text = element_text(size = 15),
legend.position = "top",
legend.background = element_rect(color = "grey"),
legend.text = element_text(size = 12))
##====================================================================
TDP.q <- TDP.list[[which(q.vec == q)]]
TDP.q.noise.mat <- rbind.data.frame(
cbind.data.frame(Noise = rep("All", length(Noise)),
pi0 = factor(do.call(rbind, pi0.list)),
TDP.q),
cbind.data.frame(Noise,
pi0 = factor(do.call(rbind, pi0.list)),
TDP.q)
)
TDP.q.ggdata <- melt(TDP.q.noise.mat, id.vars = c("Noise", "pi0"), variable.name = "Method", value.name = "TDP")
TDP.q.plot <- ggplot(data = TDP.q.ggdata, aes(x = pi0, y = TDP)) +
geom_boxplot(aes(fill = Method, color = Method), outlier.color = NULL, outlier.size = 0.5
# , outlier.shape = NA
) +
scale_color_manual(values = method.col.FDR) +
scale_fill_manual(values = alpha(method.col.FDR, 0.35)) +
facet_wrap(~Noise, nrow = 1, ncol = 4) +
labs(x = expression(pi[0]), y = "TDP") +
theme(axis.title.x = element_text(size = 15),
axis.text.x = element_text(size = 10, angle = 45, hjust = 1),
axis.title.y = element_text(size = 12),
axis.text.y = element_text(size = 10),
strip.text = element_text(size = 15),
legend.position = "top",
legend.background = element_rect(color = "grey"),
legend.text = element_text(size = 12))Overall
pi0hat.plot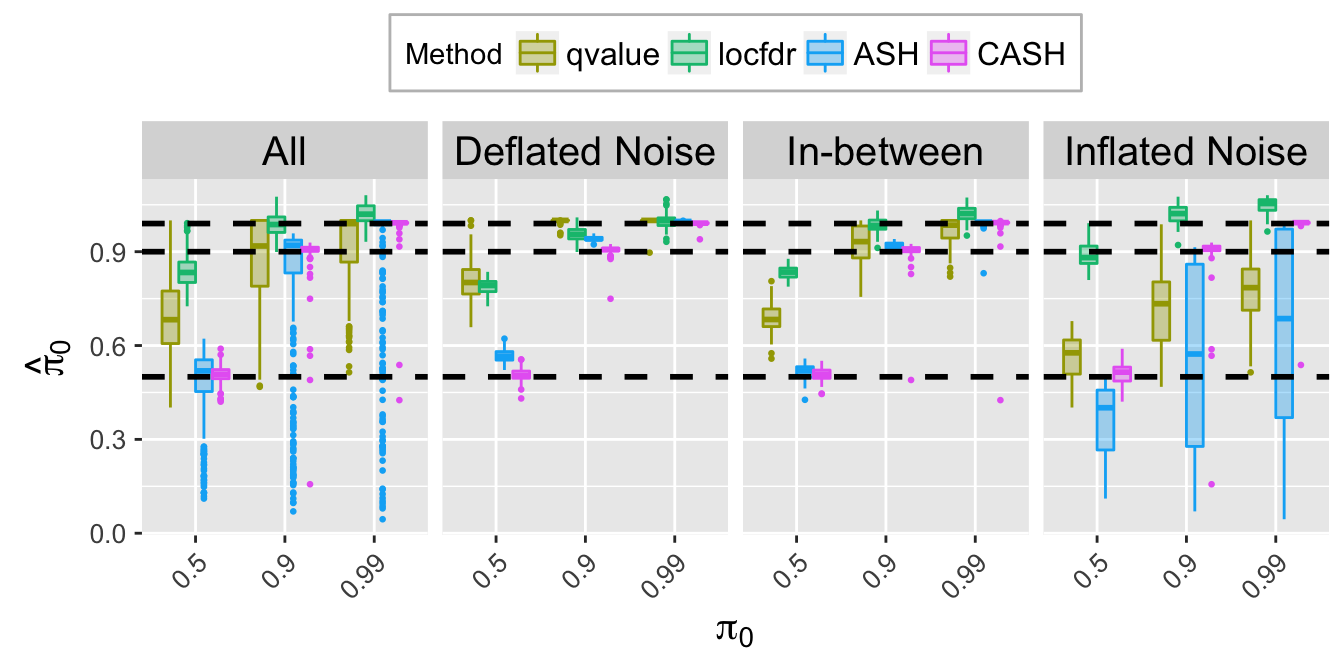
Expand here to see past versions of unnamed-chunk-7-1.png:
| Version | Author | Date |
|---|---|---|
| 1eec7b1 | LSun | 2018-05-23 |
FDR.calib.plot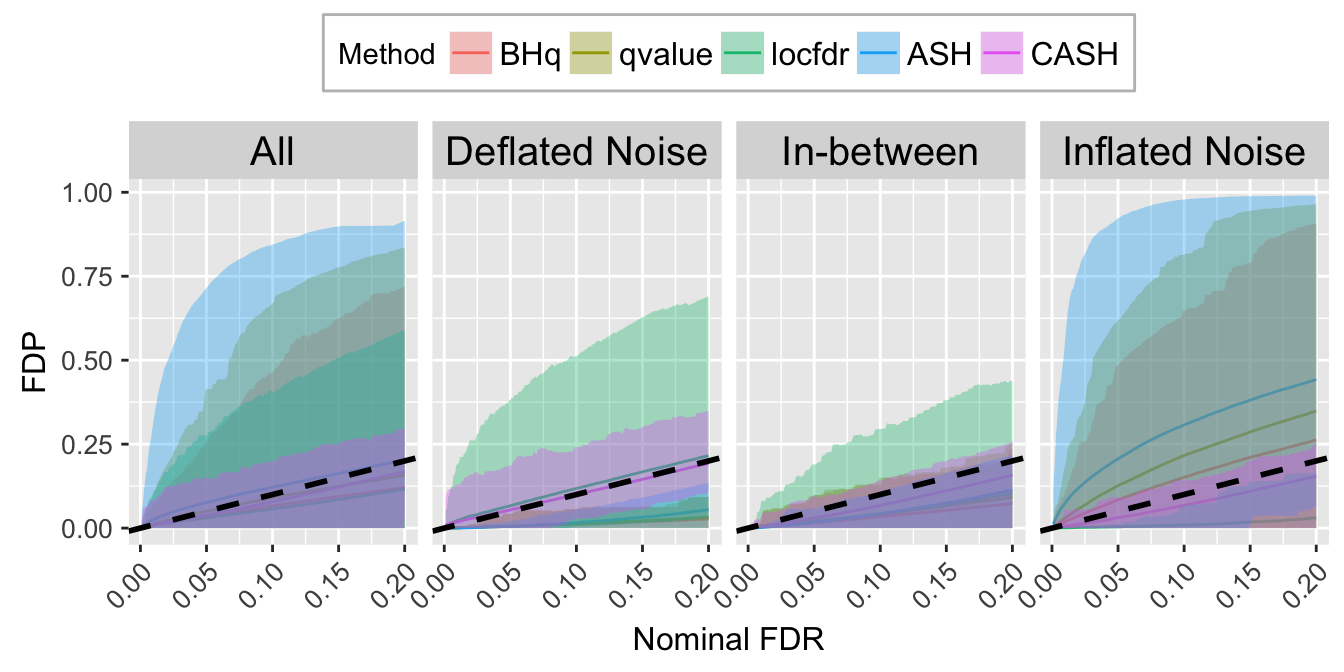
Expand here to see past versions of unnamed-chunk-7-2.png:
| Version | Author | Date |
|---|---|---|
| 1eec7b1 | LSun | 2018-05-23 |
FSR.calib.plot
Expand here to see past versions of unnamed-chunk-7-3.png:
| Version | Author | Date |
|---|---|---|
| 1eec7b1 | LSun | 2018-05-23 |
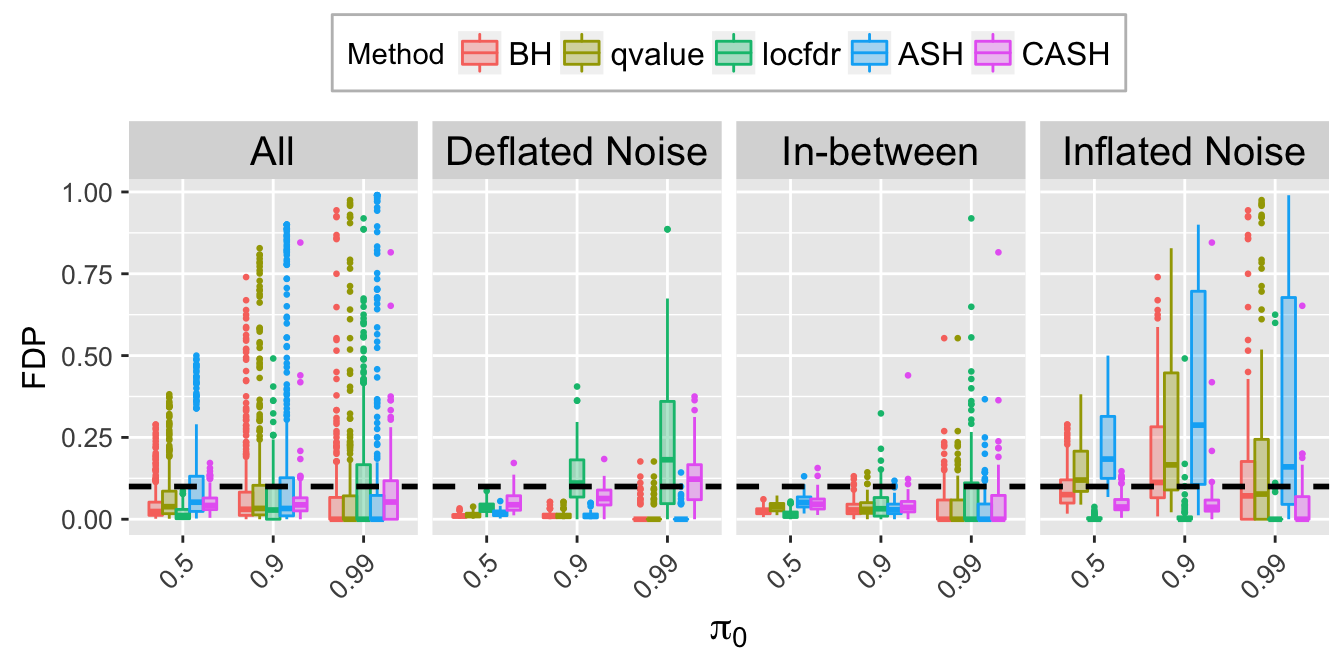
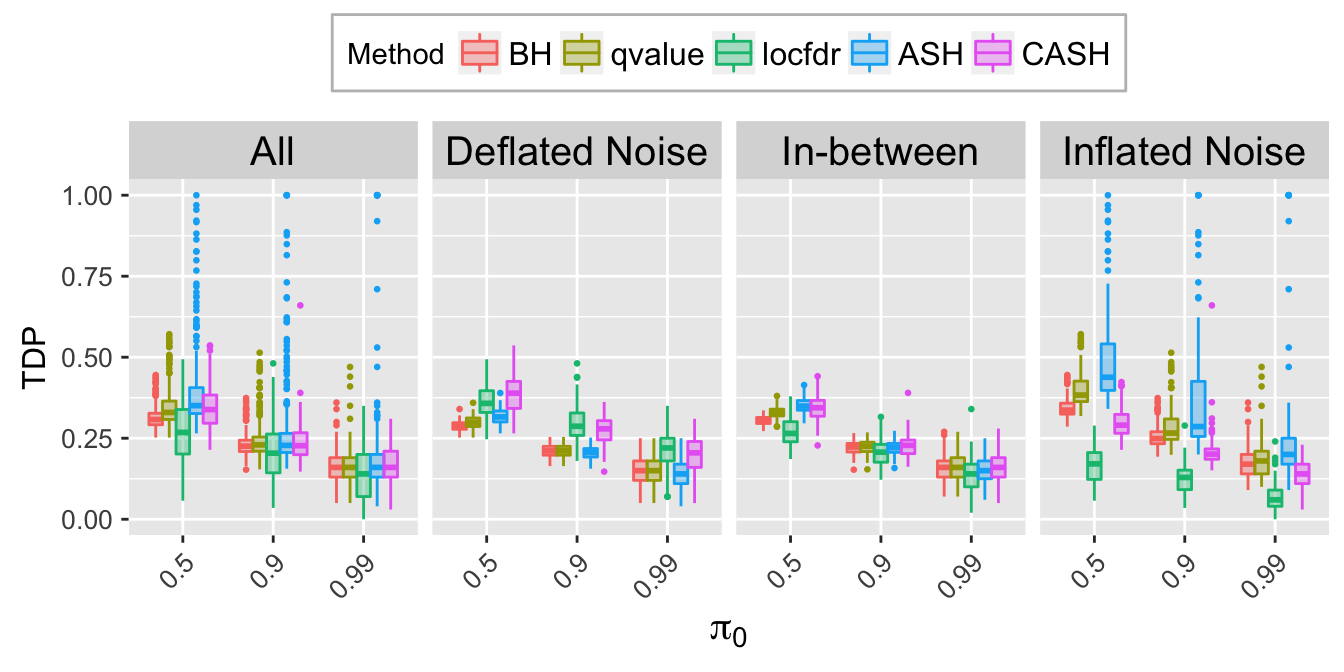
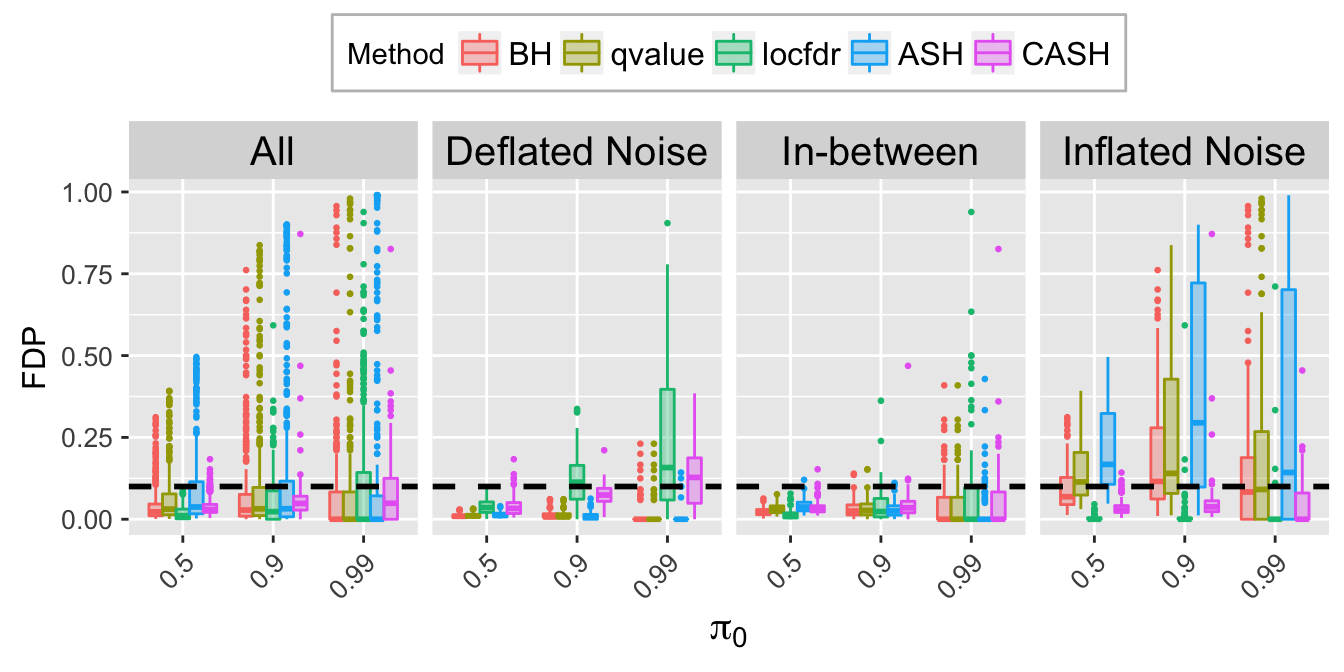
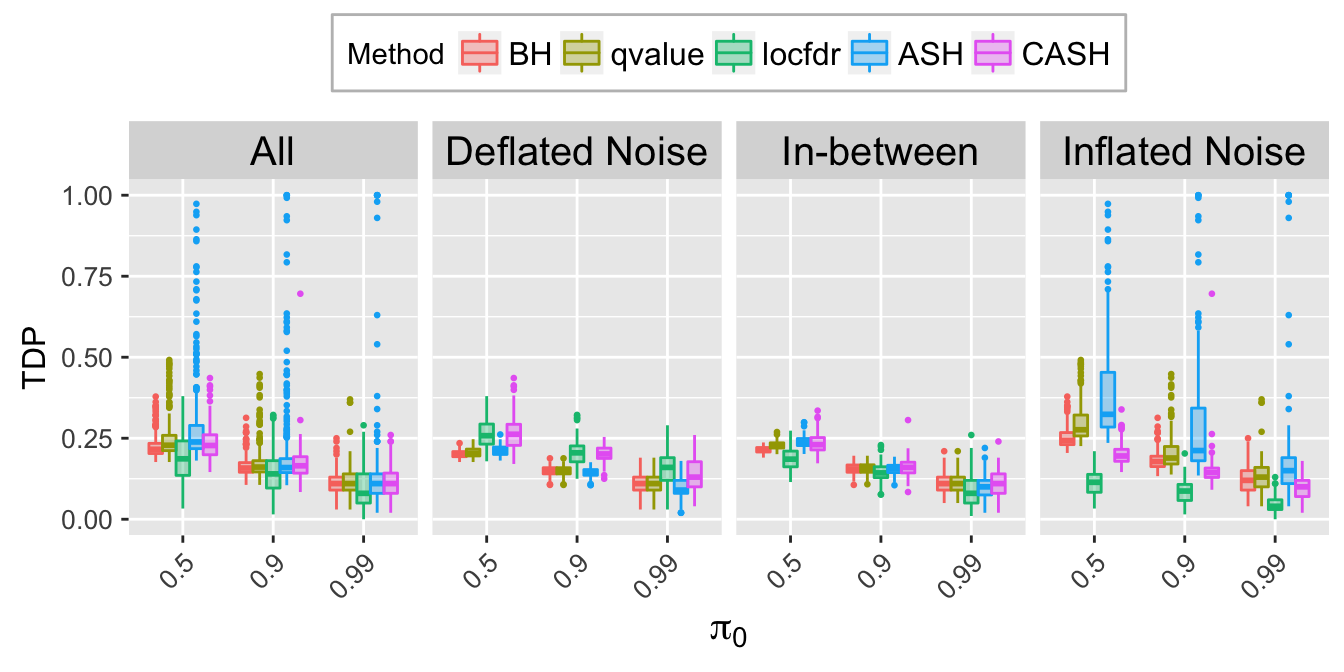
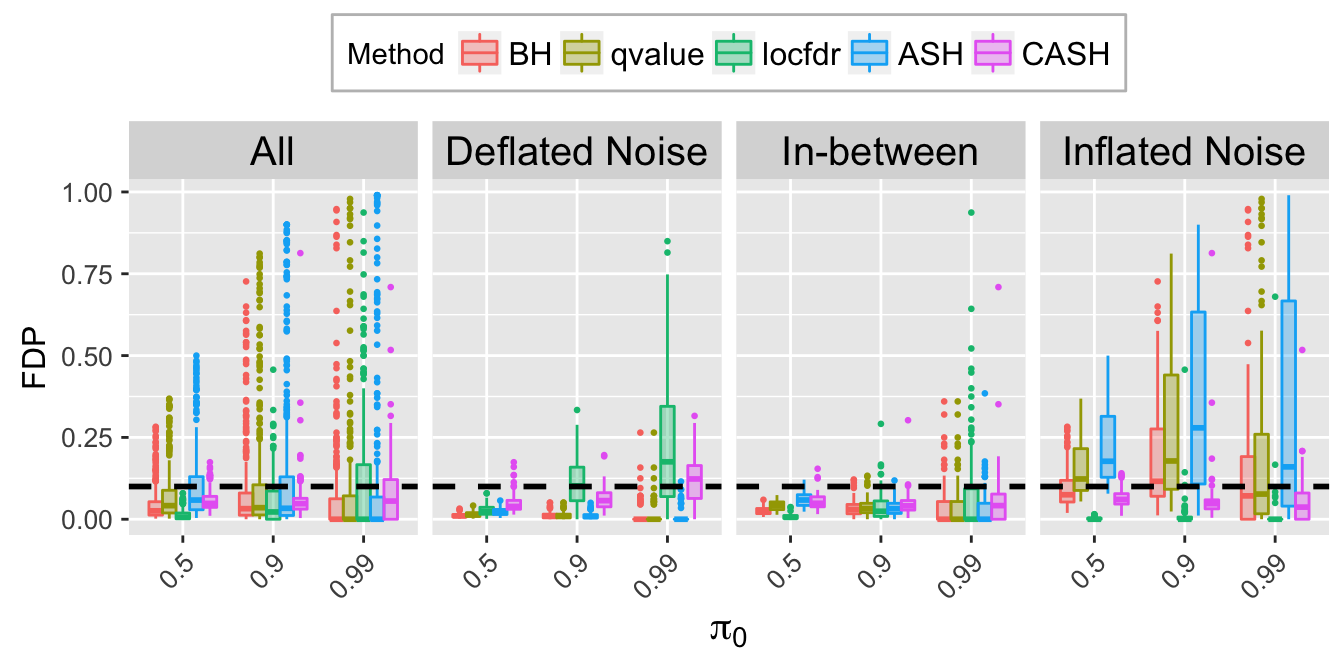
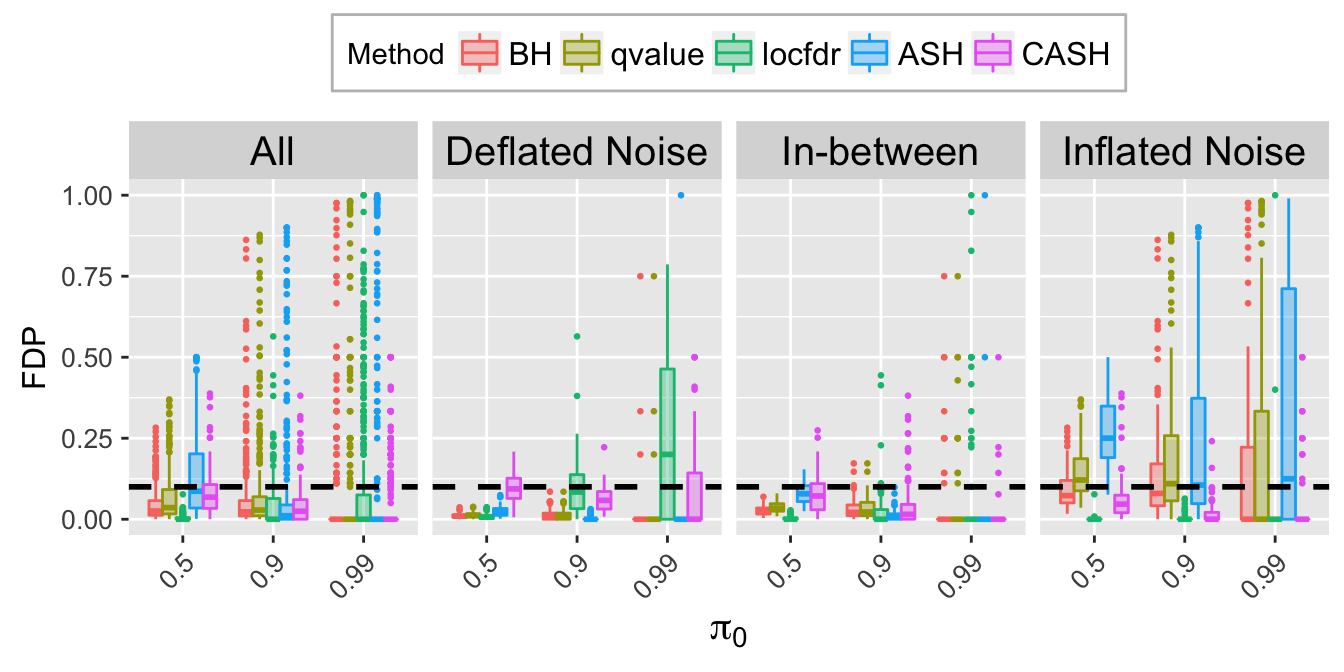
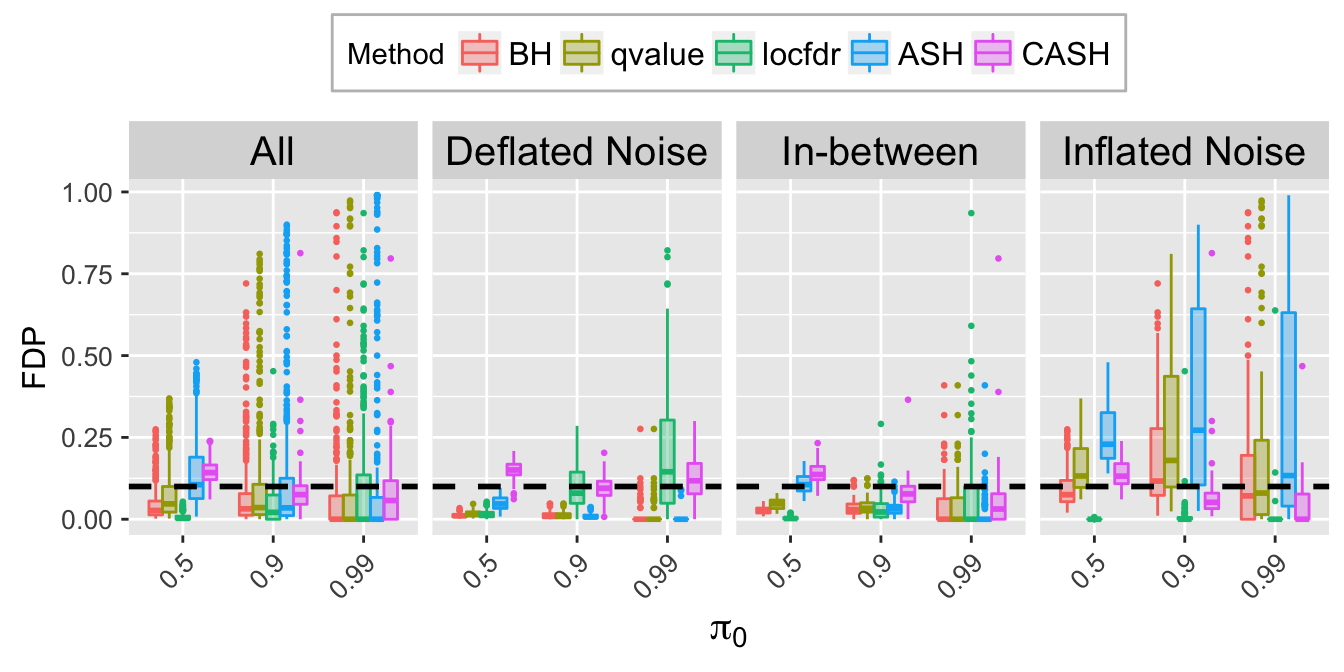
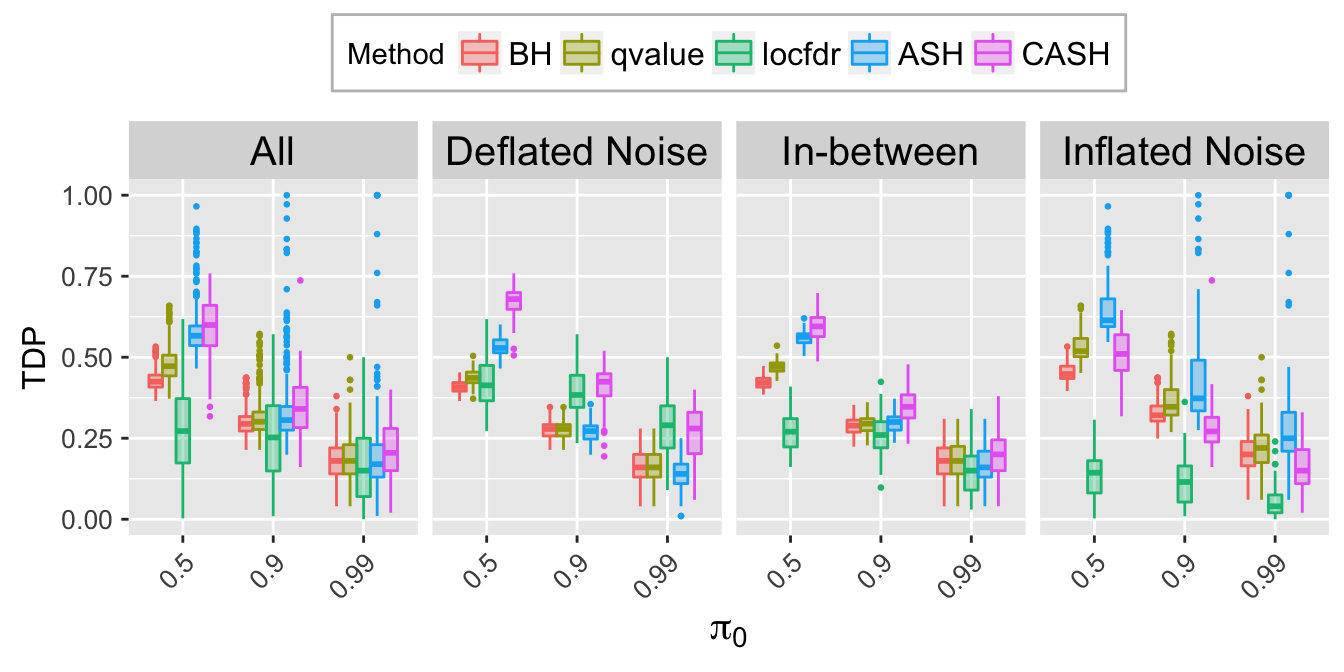
At nominal FDR = \(0.1\)
FDP.q.plot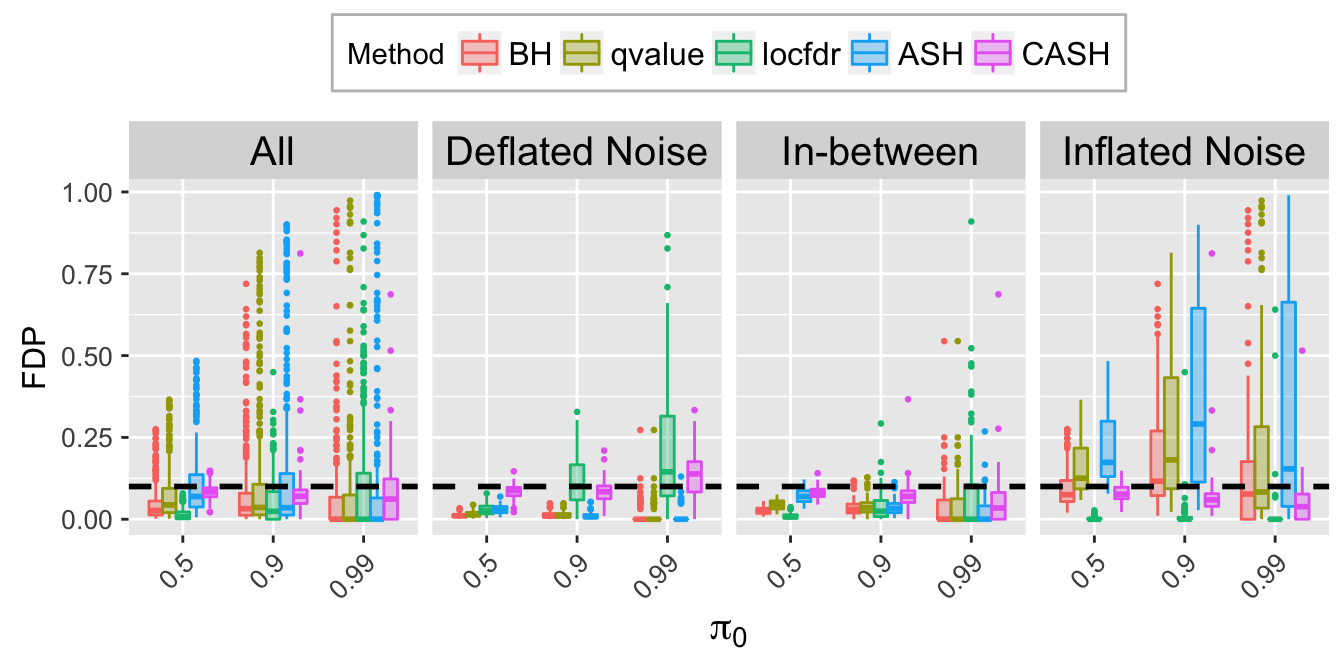
Expand here to see past versions of unnamed-chunk-8-1.png:
| Version | Author | Date |
|---|---|---|
| 1eec7b1 | LSun | 2018-05-23 |
| d51ff50 | LSun | 2018-05-18 |
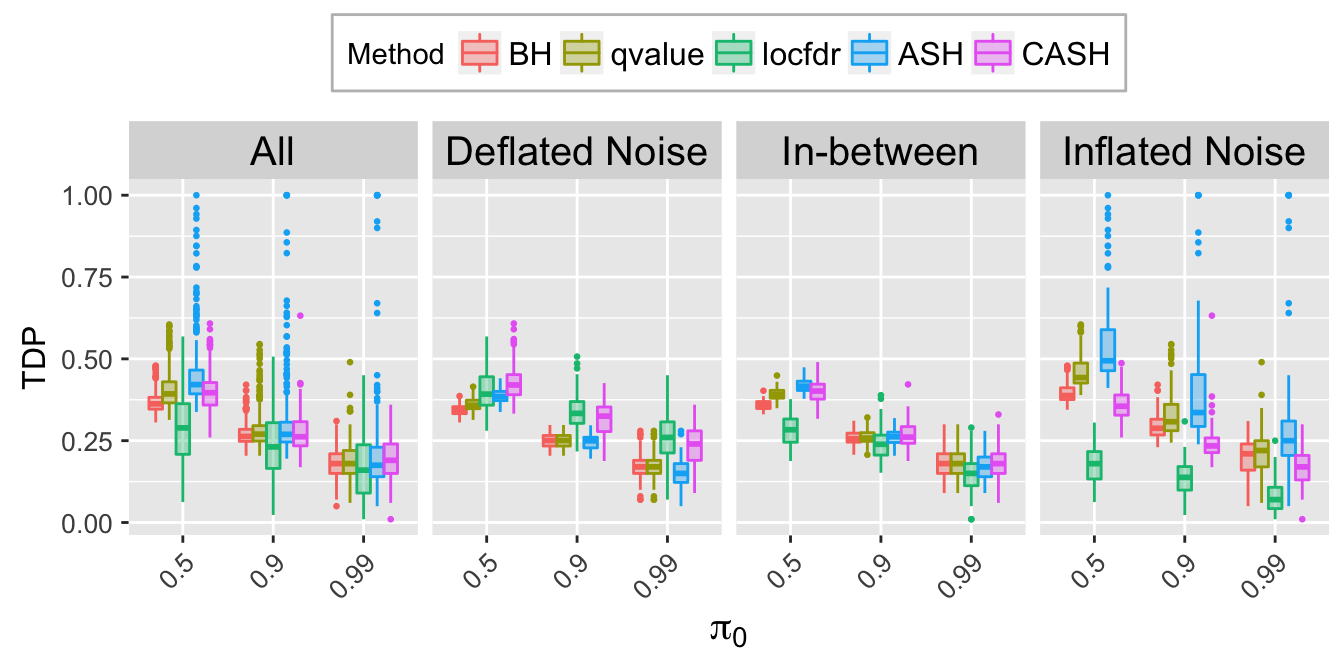
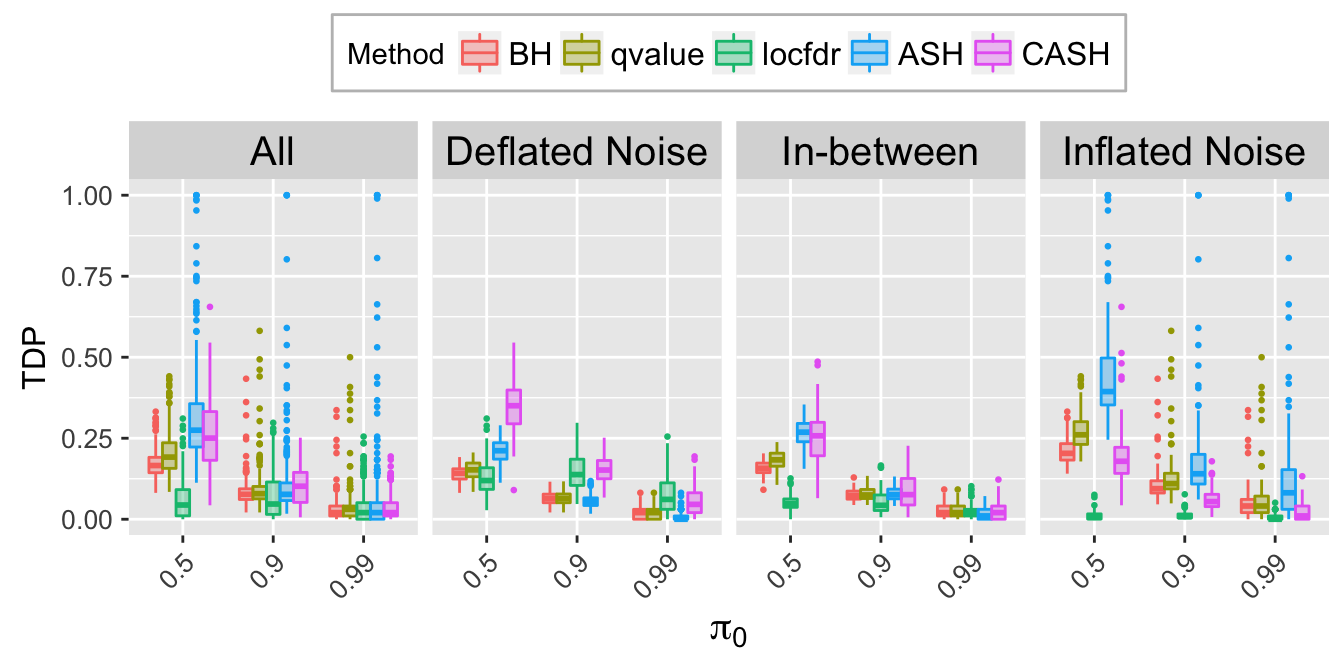
TDP.q.plot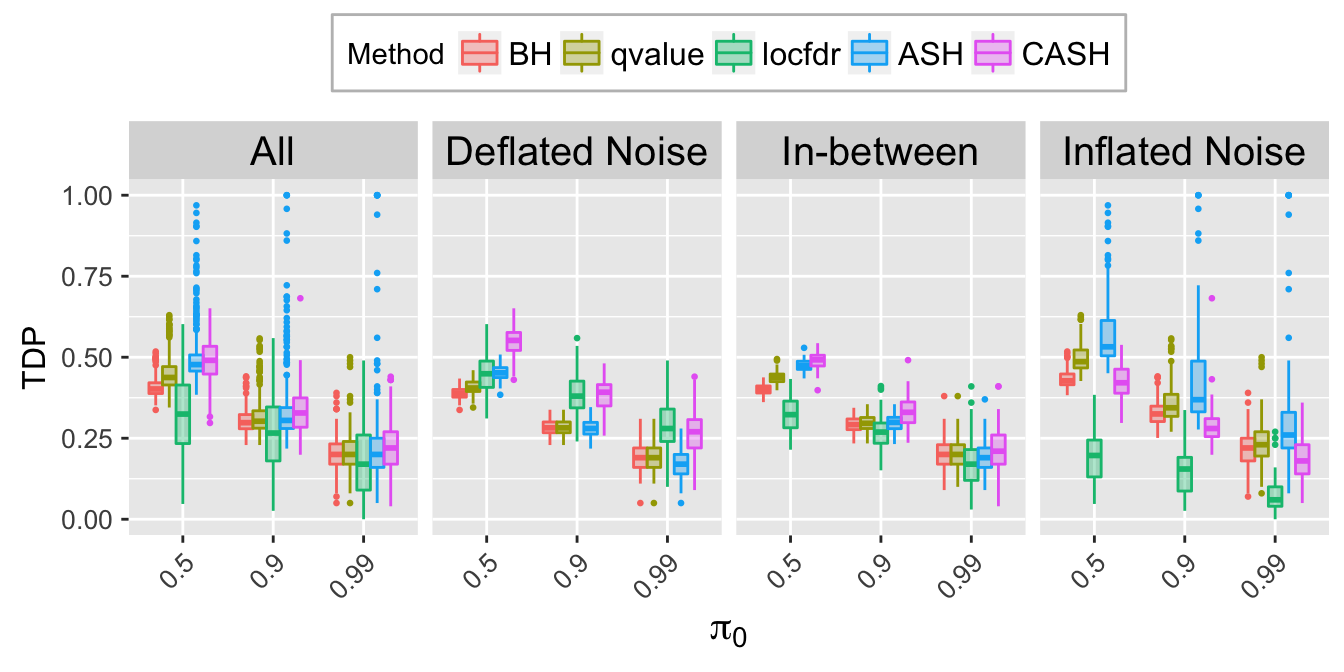
Expand here to see past versions of unnamed-chunk-8-2.png:
| Version | Author | Date |
|---|---|---|
| 1eec7b1 | LSun | 2018-05-23 |
| d51ff50 | LSun | 2018-05-18 |
# g.plot.all <- gridExtra::arrangeGrob(g.plot, pi0hat.plot, FDR.calib.plot, FSR.calib.plot, FDP.q.plot, TDP.q.plot, ncol = 1, heights = c(0.8, rep(1, 5)))
# ggsave("../output/fig/g1.pdf", g.plot.all, width = 10, height = 29)Big normal
\[ g_2 = N\left(0, 5^2\right) \]
plotx <- seq(-6, 6, by = 0.01)
plot(plotx, plotx, ylim = c(0, dnorm(0)),
xlab = expression(theta), ylab = expression(g(theta)),
type = "n")
lines(plotx, dnorm(plotx), lty = 2)
lines(plotx, dnorm(plotx, 0, 5), col = "blue")
legend("topright", lty = c(1, 2), col = c(4, 1), c("g", "N(0, 1)"))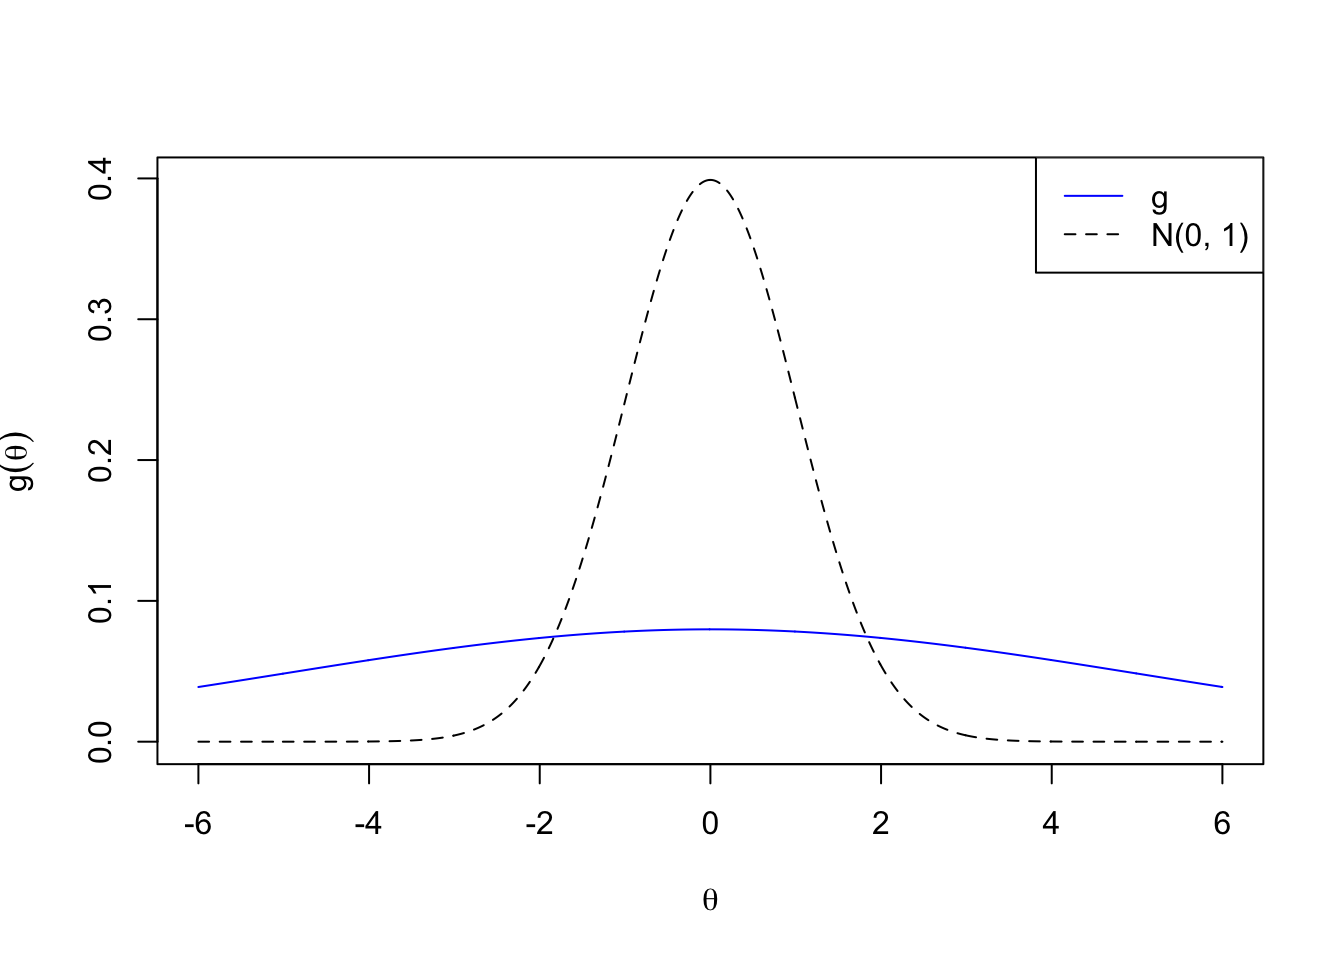
Expand here to see past versions of g2-1.png:
| Version | Author | Date |
|---|---|---|
| 1eec7b1 | LSun | 2018-05-23 |
pi0hat.mat <- cbind.data.frame(pi0 = factor(do.call(rbind, pi0.list)), do.call(rbind, pi0hat.list))

FDP.list <- lapply(q.vec, function (q) {
  t(mapply(function (qvalue.mat, beta, q) {
    apply(qvalue.mat, 2, function (qvalue, q, beta) {
      FDP(q, qvalue, beta)
    }, q, beta)
  }, qvalue.list, beta.list, q))
})
names(FDP.list) <- q.vec

FSP.list <- lapply(q.vec, function (s) {
  t(mapply(function (svalue.mat, beta, betahat, s) {
    apply(svalue.mat, 2, function (svalue, s, beta, betahat) {
      FSP(s, svalue, beta, betahat)
    }, s, beta, betahat)
  }, svalue.list, beta.list, betahat.list, s))
})
names(FSP.list) <- q.vec

TDP.list <- lapply(q.vec, function(q) {
  t(mapply(function(qvalue.mat, beta, q) {
    apply(qvalue.mat, 2, function (qvalue, q, beta) {
      TDP(q, qvalue, beta)
    }, q, beta)
  }, qvalue.list, beta.list, q))
})
names(TDP.list) <- q.vec
sd.z <- sapply(z.list, sd)
Noise <- cut(sd.z, breaks = c(0, quantile(sd.z, probs = 1 : 2 / 3), Inf), labels = c("Deflated Noise", "In-between", "Inflated Noise"))
# Noise <- cut(sd.z, breaks = c(0, z.under, z.over, Inf), labels = c("Deflated Noise", "In-between", "Inflated Noise"))
##=================================================
pi0hat.noise.mat <- rbind.data.frame(
cbind.data.frame(Noise = rep("All", length(Noise)), pi0hat.mat),
cbind.data.frame(Noise, pi0hat.mat)
)
pi0hat.ggdata <- melt(pi0hat.noise.mat, id.vars = c("Noise", "pi0"), variable.name = "Method", value.name = "pi0hat")
pi0hat.plot <- ggplot(data = pi0hat.ggdata, aes(x = pi0, y = pi0hat)) +
geom_boxplot(aes(fill = Method, color = Method), outlier.color = NULL, outlier.size = 0.5
# , outlier.shape = NA
) +
scale_color_manual(values = method.col.pi0hat) +
scale_fill_manual(values = alpha(method.col.pi0hat, 0.35)) +
facet_wrap(~Noise, nrow = 1, ncol = 4) +
geom_hline(yintercept = pi0.vec, col = "black", linetype = "dashed", size = 1) +
labs(x = expression(pi[0]), y = expression(hat(pi)[0])) +
theme(axis.title.x = element_text(size = 15),
axis.text.x = element_text(size = 10, angle = 45, hjust = 1),
axis.title.y = element_text(size = 15),
axis.text.y = element_text(size = 10),
strip.text = element_text(size = 15),
legend.position = "top",
legend.background = element_rect(color = "grey"),
legend.text = element_text(size = 12))
##==================================================
FDP.calib.ggdata <- FXP.ggdata(FDP.list, Noise)
FDR.calib.plot <- ggplot(data = FDP.calib.ggdata, aes(x = L1, y = mean, group = Method, col = Method)) +
geom_line() +
geom_ribbon(aes(ymin = q025, ymax = q975, fill = Method), alpha = 0.35, linetype = "blank") +
scale_color_manual(labels = method.name.FDR, values = method.col.FDR) +
scale_fill_manual(labels = method.name.FDR, values = method.col.FDR) +
facet_wrap(~Noise, nrow = 1, ncol = 4) +
geom_abline(slope = 1, intercept = 0, linetype = "dashed", size = 1, col = "black") +
labs(x = "Nominal FDR", y = "FDP") +
theme(axis.title.x = element_text(size = 12),
axis.text.x = element_text(size = 10, angle = 45, hjust = 1),
axis.title.y = element_text(size = 12),
axis.text.y = element_text(size = 10),
strip.text = element_text(size = 15),
legend.position = "top",
legend.background = element_rect(color = "grey"),
legend.text = element_text(size = 12))
##==================================================
FSP.calib.ggdata <- FXP.ggdata(FSP.list, Noise)
FSR.calib.plot <- ggplot(data = FSP.calib.ggdata, aes(x = L1, y = mean, group = Method, col = Method)) +
geom_line() +
geom_ribbon(aes(ymin = q025, ymax = q975, fill = Method), alpha = 0.35, linetype = "blank") +
scale_color_manual(labels = method.name.FSR, values = method.col.FSR) +
scale_fill_manual(labels = method.name.FSR, values = method.col.FSR) +
facet_wrap(~Noise, nrow = 1, ncol = 4) +
geom_abline(slope = 1, intercept = 0, linetype = "dashed", size = 1, col = "black") +
labs(x = "Nominal FSR", y = "FSP") +
theme(axis.title.x = element_text(size = 12),
axis.text.x = element_text(size = 10, angle = 45, hjust = 1),
axis.title.y = element_text(size = 12),
axis.text.y = element_text(size = 10),
strip.text = element_text(size = 15),
legend.position = "top",
legend.background = element_rect(color = "grey"),
legend.text = element_text(size = 12))
##============================================================
FDP.q <- FDP.list[[which(q.vec == q)]]
FDP.q.noise.mat <- rbind.data.frame(
cbind.data.frame(Noise = rep("All", length(Noise)),
pi0 = factor(do.call(rbind, pi0.list)),
FDP.q),
cbind.data.frame(Noise,
pi0 = factor(do.call(rbind, pi0.list)),
FDP.q)
)
FDP.q.ggdata <- melt(FDP.q.noise.mat, id.vars = c("Noise", "pi0"), variable.name = "Method", value.name = "FDP")
FDP.q.plot <- ggplot(data = FDP.q.ggdata, aes(x = pi0, y = FDP)) +
geom_boxplot(aes(fill = Method, color = Method), outlier.color = NULL, outlier.size = 0.5
# , outlier.shape = NA
) +
scale_color_manual(values = method.col.FDR) +
scale_fill_manual(values = alpha(method.col.FDR, 0.35)) +
facet_wrap(~Noise, nrow = 1, ncol = 4) +
geom_hline(yintercept = q, col = "black", linetype = "dashed", size = 1) +
labs(x = expression(pi[0]), y = "FDP") +
theme(axis.title.x = element_text(size = 15),
axis.text.x = element_text(size = 10, angle = 45, hjust = 1),
axis.title.y = element_text(size = 12),
axis.text.y = element_text(size = 10),
strip.text = element_text(size = 15),
legend.position = "top",
legend.background = element_rect(color = "grey"),
legend.text = element_text(size = 12))
##====================================================================
TDP.q <- TDP.list[[which(q.vec == q)]]
TDP.q.noise.mat <- rbind.data.frame(
cbind.data.frame(Noise = rep("All", length(Noise)),
pi0 = factor(do.call(rbind, pi0.list)),
TDP.q),
cbind.data.frame(Noise,
pi0 = factor(do.call(rbind, pi0.list)),
TDP.q)
)
TDP.q.ggdata <- melt(TDP.q.noise.mat, id.vars = c("Noise", "pi0"), variable.name = "Method", value.name = "TDP")
TDP.q.plot <- ggplot(data = TDP.q.ggdata, aes(x = pi0, y = TDP)) +
geom_boxplot(aes(fill = Method, color = Method), outlier.color = NULL, outlier.size = 0.5
# , outlier.shape = NA
) +
scale_color_manual(values = method.col.FDR) +
scale_fill_manual(values = alpha(method.col.FDR, 0.35)) +
facet_wrap(~Noise, nrow = 1, ncol = 4) +
labs(x = expression(pi[0]), y = "TDP") +
theme(axis.title.x = element_text(size = 15),
axis.text.x = element_text(size = 10, angle = 45, hjust = 1),
axis.title.y = element_text(size = 12),
axis.text.y = element_text(size = 10),
strip.text = element_text(size = 15),
legend.position = "top",
legend.background = element_rect(color = "grey"),
legend.text = element_text(size = 12))Overall
pi0hat.plot
Expand here to see past versions of unnamed-chunk-11-1.png:
| Version | Author | Date |
|---|---|---|
| 1eec7b1 | LSun | 2018-05-23 |
FDR.calib.plot
Expand here to see past versions of unnamed-chunk-11-2.png:
| Version | Author | Date |
|---|---|---|
| 1eec7b1 | LSun | 2018-05-23 |
FSR.calib.plot
Expand here to see past versions of unnamed-chunk-11-3.png:
| Version | Author | Date |
|---|---|---|
| 1eec7b1 | LSun | 2018-05-23 |

Near normal
\[ g_3 = 0.6 N\left(0, 1^2\right) + 0.4 N\left(0, 3^2\right) \]
plotx <- seq(-6, 6, by = 0.01)
plot(plotx, plotx, ylim = c(0, dnorm(0)),
xlab = expression(theta), ylab = expression(g(theta)),
type = "n")
lines(plotx, dnorm(plotx), lty = 2)
lines(plotx, 0.6 * dnorm(plotx) + 0.4 * dnorm(plotx, 0, 3), col = "blue")
legend("topright", lty = c(1, 2), col = c(4, 1), c("g", "N(0, 1)"))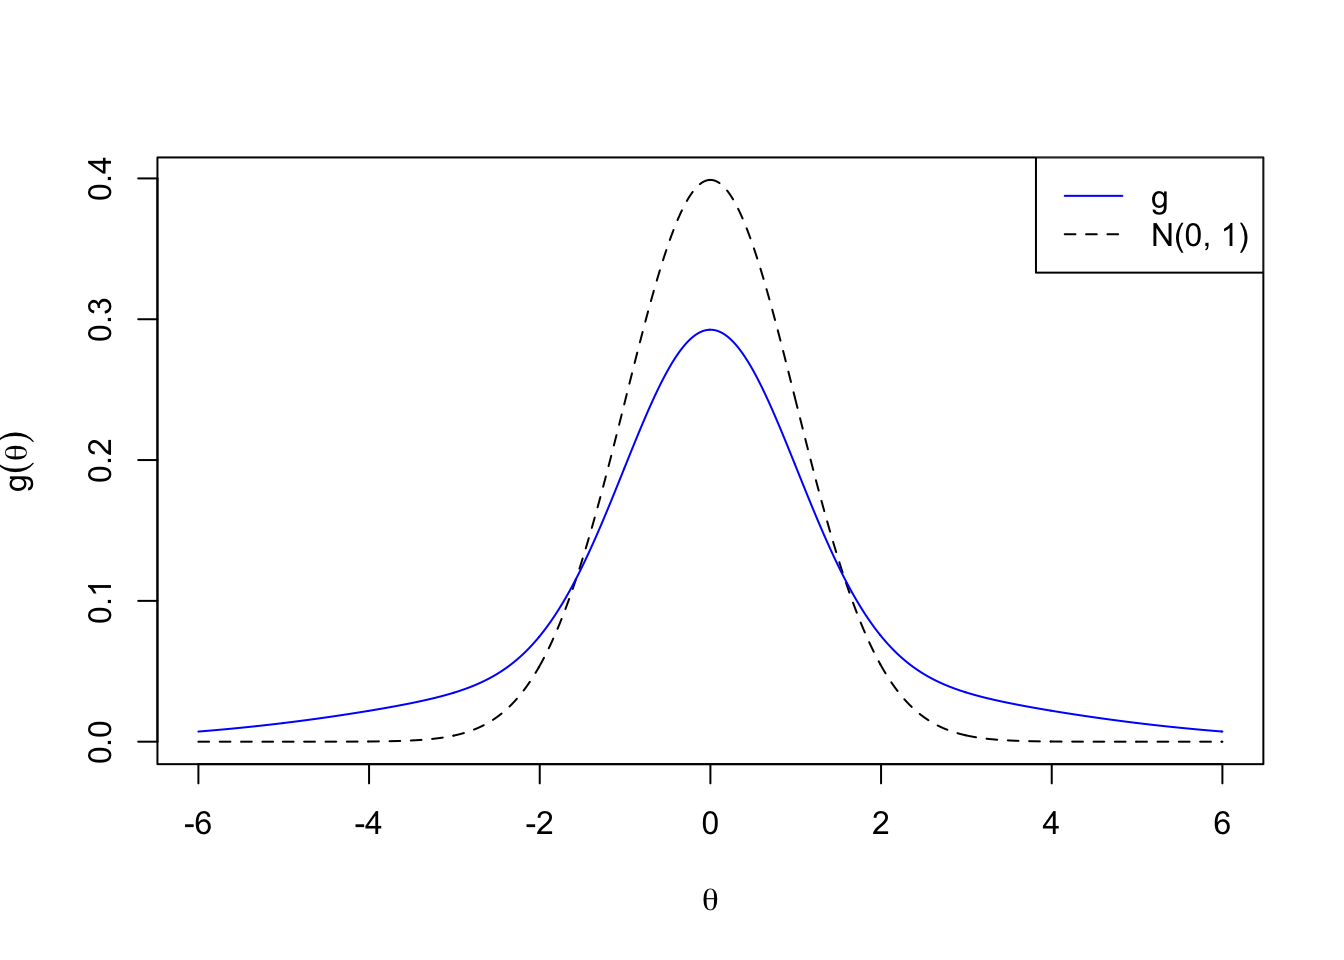
Expand here to see past versions of g3-1.png:
| Version | Author | Date |
|---|---|---|
| 1eec7b1 | LSun | 2018-05-23 |
pi0hat.mat <- cbind.data.frame(pi0 = factor(do.call(rbind, pi0.list)), do.call(rbind, pi0hat.list))

FDP.list <- lapply(q.vec, function (q) {
  t(mapply(function (qvalue.mat, beta, q) {
    apply(qvalue.mat, 2, function (qvalue, q, beta) {
      FDP(q, qvalue, beta)
    }, q, beta)
  }, qvalue.list, beta.list, q))
})
names(FDP.list) <- q.vec

FSP.list <- lapply(q.vec, function (s) {
  t(mapply(function (svalue.mat, beta, betahat, s) {
    apply(svalue.mat, 2, function (svalue, s, beta, betahat) {
      FSP(s, svalue, beta, betahat)
    }, s, beta, betahat)
  }, svalue.list, beta.list, betahat.list, s))
})
names(FSP.list) <- q.vec

TDP.list <- lapply(q.vec, function(q) {
  t(mapply(function(qvalue.mat, beta, q) {
    apply(qvalue.mat, 2, function (qvalue, q, beta) {
      TDP(q, qvalue, beta)
    }, q, beta)
  }, qvalue.list, beta.list, q))
})
names(TDP.list) <- q.vec
sd.z <- sapply(z.list, sd)
Noise <- cut(sd.z, breaks = c(0, quantile(sd.z, probs = 1 : 2 / 3), Inf), labels = c("Deflated Noise", "In-between", "Inflated Noise"))
# Noise <- cut(sd.z, breaks = c(0, z.under, z.over, Inf), labels = c("Deflated Noise", "In-between", "Inflated Noise"))
##=================================================
pi0hat.noise.mat <- rbind.data.frame(
cbind.data.frame(Noise = rep("All", length(Noise)), pi0hat.mat),
cbind.data.frame(Noise, pi0hat.mat)
)
pi0hat.ggdata <- melt(pi0hat.noise.mat, id.vars = c("Noise", "pi0"), variable.name = "Method", value.name = "pi0hat")
pi0hat.plot <- ggplot(data = pi0hat.ggdata, aes(x = pi0, y = pi0hat)) +
geom_boxplot(aes(fill = Method, color = Method), outlier.color = NULL, outlier.size = 0.5
# , outlier.shape = NA
) +
scale_color_manual(values = method.col.pi0hat) +
scale_fill_manual(values = alpha(method.col.pi0hat, 0.35)) +
facet_wrap(~Noise, nrow = 1, ncol = 4) +
geom_hline(yintercept = pi0.vec, col = "black", linetype = "dashed", size = 1) +
labs(x = expression(pi[0]), y = expression(hat(pi)[0])) +
theme(axis.title.x = element_text(size = 15),
axis.text.x = element_text(size = 10, angle = 45, hjust = 1),
axis.title.y = element_text(size = 15),
axis.text.y = element_text(size = 10),
strip.text = element_text(size = 15),
legend.position = "top",
legend.background = element_rect(color = "grey"),
legend.text = element_text(size = 12))
##==================================================
FDP.calib.ggdata <- FXP.ggdata(FDP.list, Noise)
FDR.calib.plot <- ggplot(data = FDP.calib.ggdata, aes(x = L1, y = mean, group = Method, col = Method)) +
geom_line() +
geom_ribbon(aes(ymin = q025, ymax = q975, fill = Method), alpha = 0.35, linetype = "blank") +
scale_color_manual(labels = method.name.FDR, values = method.col.FDR) +
scale_fill_manual(labels = method.name.FDR, values = method.col.FDR) +
facet_wrap(~Noise, nrow = 1, ncol = 4) +
geom_abline(slope = 1, intercept = 0, linetype = "dashed", size = 1, col = "black") +
labs(x = "Nominal FDR", y = "FDP") +
theme(axis.title.x = element_text(size = 12),
axis.text.x = element_text(size = 10, angle = 45, hjust = 1),
axis.title.y = element_text(size = 12),
axis.text.y = element_text(size = 10),
strip.text = element_text(size = 15),
legend.position = "top",
legend.background = element_rect(color = "grey"),
legend.text = element_text(size = 12))
##==================================================
FSP.calib.ggdata <- FXP.ggdata(FSP.list, Noise)
FSR.calib.plot <- ggplot(data = FSP.calib.ggdata, aes(x = L1, y = mean, group = Method, col = Method)) +
geom_line() +
geom_ribbon(aes(ymin = q025, ymax = q975, fill = Method), alpha = 0.35, linetype = "blank") +
scale_color_manual(labels = method.name.FSR, values = method.col.FSR) +
scale_fill_manual(labels = method.name.FSR, values = method.col.FSR) +
facet_wrap(~Noise, nrow = 1, ncol = 4) +
geom_abline(slope = 1, intercept = 0, linetype = "dashed", size = 1, col = "black") +
labs(x = "Nominal FSR", y = "FSP") +
theme(axis.title.x = element_text(size = 12),
axis.text.x = element_text(size = 10, angle = 45, hjust = 1),
axis.title.y = element_text(size = 12),
axis.text.y = element_text(size = 10),
strip.text = element_text(size = 15),
legend.position = "top",
legend.background = element_rect(color = "grey"),
legend.text = element_text(size = 12))
##============================================================
FDP.q <- FDP.list[[which(q.vec == q)]]
FDP.q.noise.mat <- rbind.data.frame(
cbind.data.frame(Noise = rep("All", length(Noise)),
pi0 = factor(do.call(rbind, pi0.list)),
FDP.q),
cbind.data.frame(Noise,
pi0 = factor(do.call(rbind, pi0.list)),
FDP.q)
)
FDP.q.ggdata <- melt(FDP.q.noise.mat, id.vars = c("Noise", "pi0"), variable.name = "Method", value.name = "FDP")
FDP.q.plot <- ggplot(data = FDP.q.ggdata, aes(x = pi0, y = FDP)) +
geom_boxplot(aes(fill = Method, color = Method), outlier.color = NULL, outlier.size = 0.5
# , outlier.shape = NA
) +
scale_color_manual(values = method.col.FDR) +
scale_fill_manual(values = alpha(method.col.FDR, 0.35)) +
facet_wrap(~Noise, nrow = 1, ncol = 4) +
geom_hline(yintercept = q, col = "black", linetype = "dashed", size = 1) +
labs(x = expression(pi[0]), y = "FDP") +
theme(axis.title.x = element_text(size = 15),
axis.text.x = element_text(size = 10, angle = 45, hjust = 1),
axis.title.y = element_text(size = 12),
axis.text.y = element_text(size = 10),
strip.text = element_text(size = 15),
legend.position = "top",
legend.background = element_rect(color = "grey"),
legend.text = element_text(size = 12))
##====================================================================
TDP.q <- TDP.list[[which(q.vec == q)]]
TDP.q.noise.mat <- rbind.data.frame(
cbind.data.frame(Noise = rep("All", length(Noise)),
pi0 = factor(do.call(rbind, pi0.list)),
TDP.q),
cbind.data.frame(Noise,
pi0 = factor(do.call(rbind, pi0.list)),
TDP.q)
)
TDP.q.ggdata <- melt(TDP.q.noise.mat, id.vars = c("Noise", "pi0"), variable.name = "Method", value.name = "TDP")
TDP.q.plot <- ggplot(data = TDP.q.ggdata, aes(x = pi0, y = TDP)) +
geom_boxplot(aes(fill = Method, color = Method), outlier.color = NULL, outlier.size = 0.5
# , outlier.shape = NA
) +
scale_color_manual(values = method.col.FDR) +
scale_fill_manual(values = alpha(method.col.FDR, 0.35)) +
facet_wrap(~Noise, nrow = 1, ncol = 4) +
labs(x = expression(pi[0]), y = "TDP") +
theme(axis.title.x = element_text(size = 15),
axis.text.x = element_text(size = 10, angle = 45, hjust = 1),
axis.title.y = element_text(size = 12),
axis.text.y = element_text(size = 10),
strip.text = element_text(size = 15),
legend.position = "top",
legend.background = element_rect(color = "grey"),
legend.text = element_text(size = 12))Overall
pi0hat.plot
Expand here to see past versions of unnamed-chunk-15-1.png:
| Version | Author | Date |
|---|---|---|
| 1eec7b1 | LSun | 2018-05-23 |
FDR.calib.plot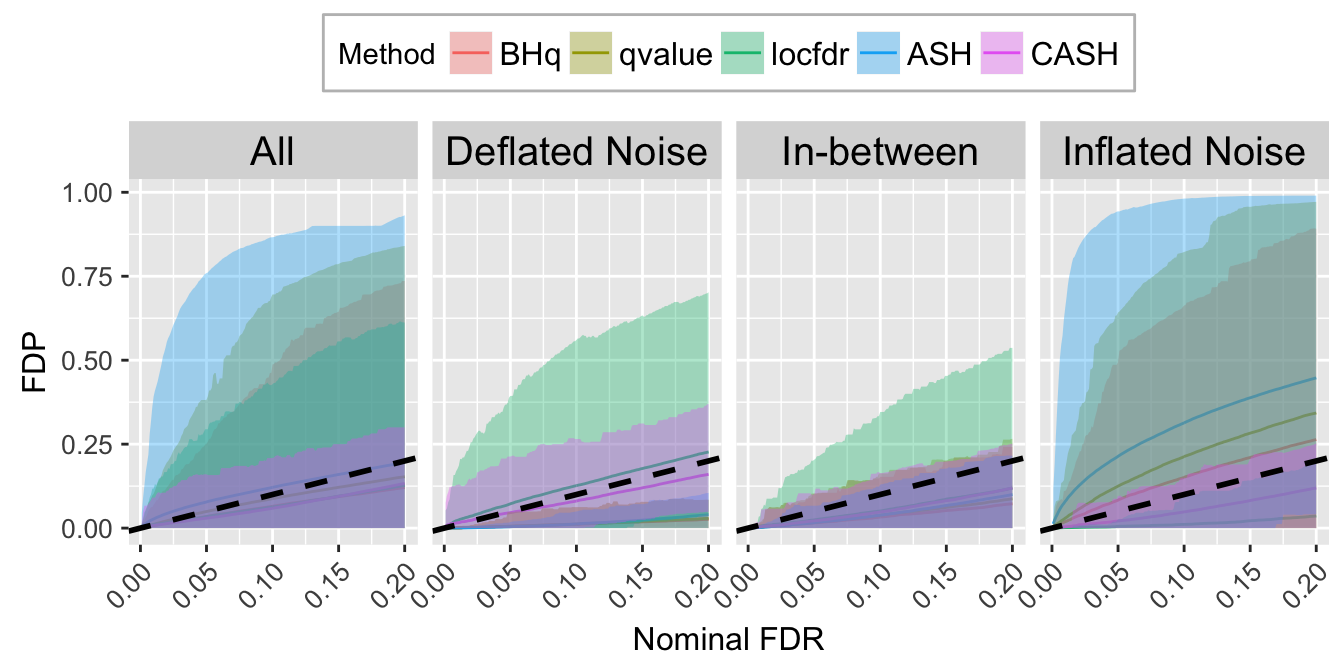
Expand here to see past versions of unnamed-chunk-15-2.png:
| Version | Author | Date |
|---|---|---|
| 1eec7b1 | LSun | 2018-05-23 |
FSR.calib.plot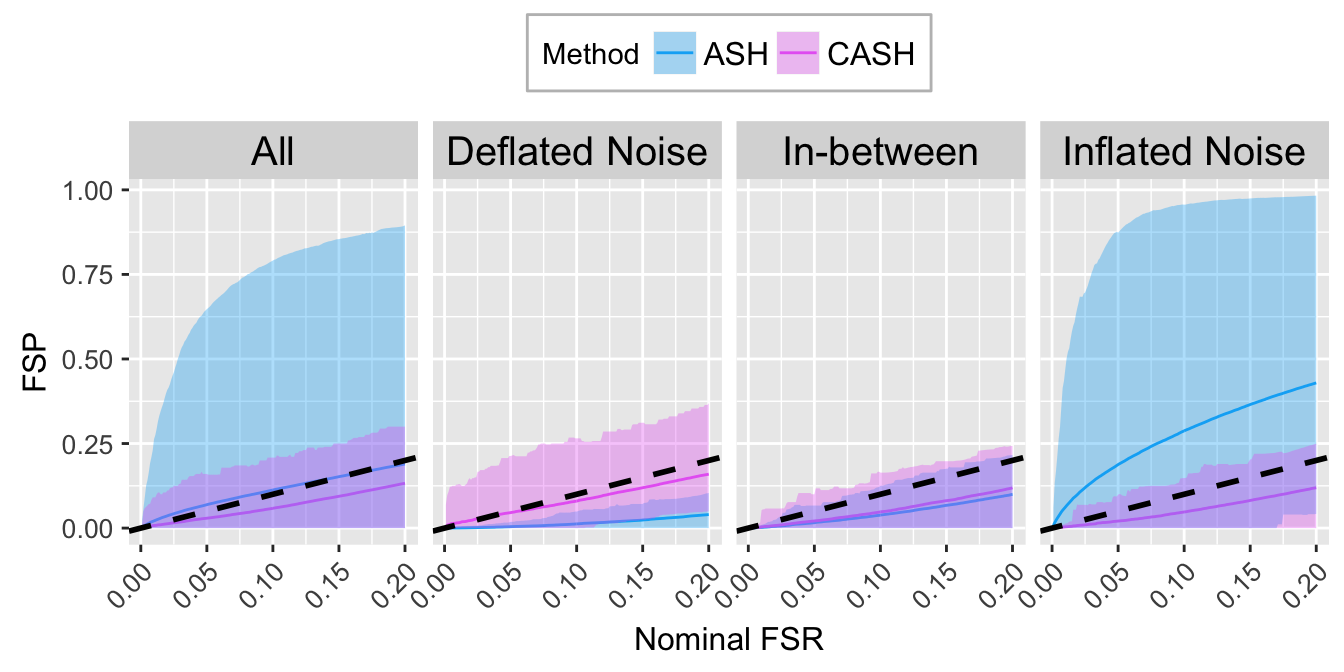
Expand here to see past versions of unnamed-chunk-15-3.png:
| Version | Author | Date |
|---|---|---|
| 1eec7b1 | LSun | 2018-05-23 |

Spikey
\[ g_4 = 0.4 N\left(0, 0.5^2\right) + 0.2 N\left(0, 1^2\right) + 0.2 N\left(0, 2^2\right) + 0.2 N\left(0, 3^2\right) \]
plotx <- seq(-6, 6, by = 0.01)
plot(plotx, plotx, ylim = c(0,
0.4 * dnorm(0, 0, 0.5) +
0.2 * dnorm(0) +
0.2 * dnorm(0, 0, 2) +
0.2 * dnorm(0, 0, 3)),
xlab = expression(theta), ylab = expression(g(theta)),
type = "n")
lines(plotx, dnorm(plotx), lty = 2)
lines(plotx, 0.4 * dnorm(plotx, 0, 0.5) +
0.2 * dnorm(plotx) +
0.2 * dnorm(plotx, 0, 2) +
0.2 * dnorm(plotx, 0, 3), col = "blue")
legend("topright", lty = c(1, 2), col = c(4, 1), c("g", "N(0, 1)"))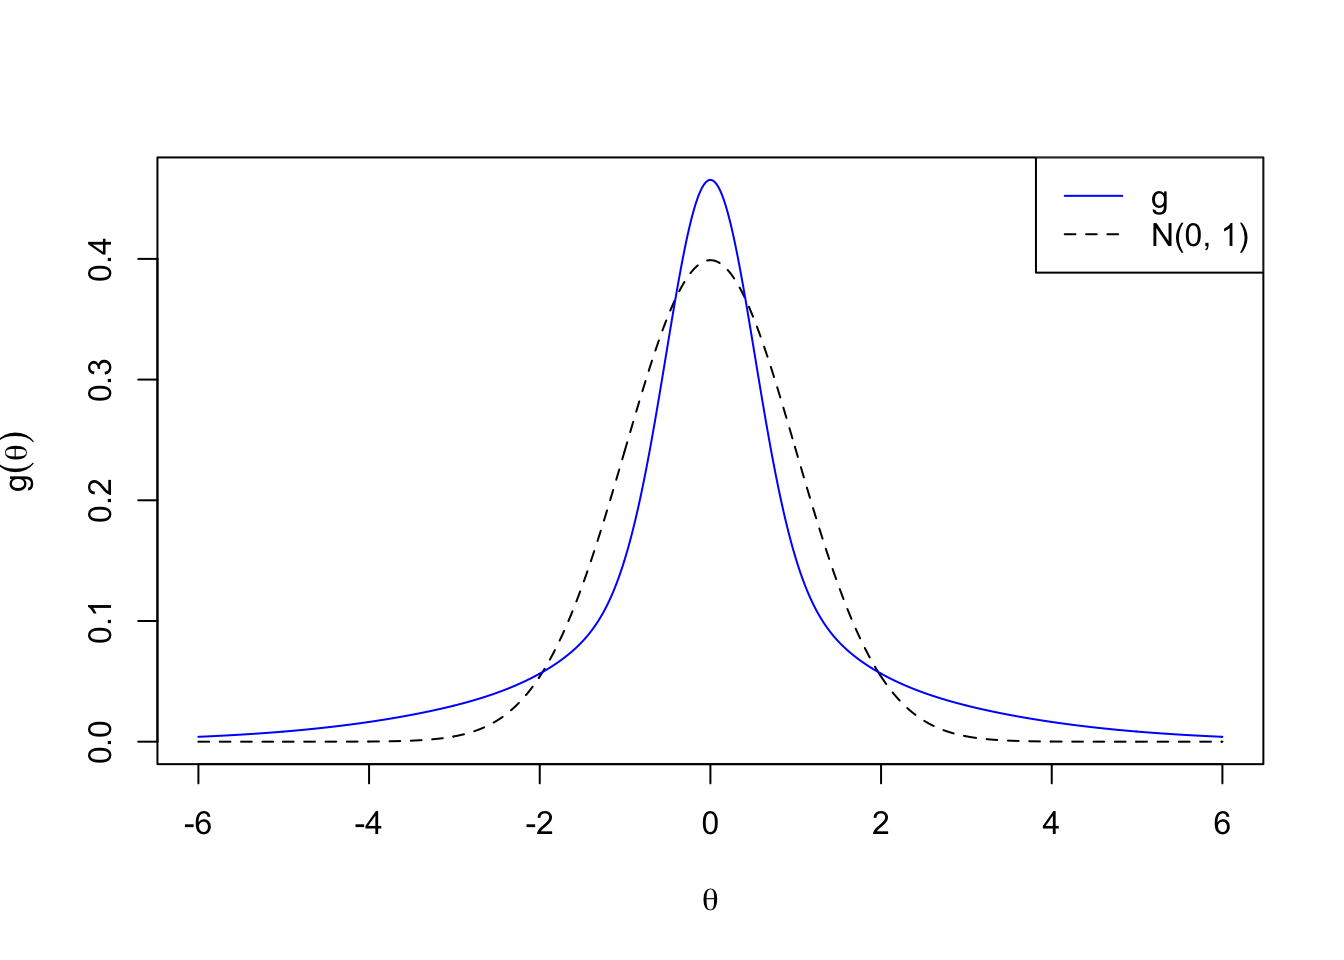
Expand here to see past versions of g4-1.png:
| Version | Author | Date |
|---|---|---|
| 1eec7b1 | LSun | 2018-05-23 |
pi0hat.mat <- cbind.data.frame(pi0 = factor(do.call(rbind, pi0.list)), do.call(rbind, pi0hat.list))

FDP.list <- lapply(q.vec, function (q) {
  t(mapply(function (qvalue.mat, beta, q) {
    apply(qvalue.mat, 2, function (qvalue, q, beta) {
      FDP(q, qvalue, beta)
    }, q, beta)
  }, qvalue.list, beta.list, q))
})
names(FDP.list) <- q.vec

FSP.list <- lapply(q.vec, function (s) {
  t(mapply(function (svalue.mat, beta, betahat, s) {
    apply(svalue.mat, 2, function (svalue, s, beta, betahat) {
      FSP(s, svalue, beta, betahat)
    }, s, beta, betahat)
  }, svalue.list, beta.list, betahat.list, s))
})
names(FSP.list) <- q.vec

TDP.list <- lapply(q.vec, function(q) {
  t(mapply(function(qvalue.mat, beta, q) {
    apply(qvalue.mat, 2, function (qvalue, q, beta) {
      TDP(q, qvalue, beta)
    }, q, beta)
  }, qvalue.list, beta.list, q))
})
names(TDP.list) <- q.vec
sd.z <- sapply(z.list, sd)
Noise <- cut(sd.z, breaks = c(0, quantile(sd.z, probs = 1 : 2 / 3), Inf), labels = c("Deflated Noise", "In-between", "Inflated Noise"))
# Noise <- cut(sd.z, breaks = c(0, z.under, z.over, Inf), labels = c("Deflated Noise", "In-between", "Inflated Noise"))
##=================================================
pi0hat.noise.mat <- rbind.data.frame(
cbind.data.frame(Noise = rep("All", length(Noise)), pi0hat.mat),
cbind.data.frame(Noise, pi0hat.mat)
)
pi0hat.ggdata <- melt(pi0hat.noise.mat, id.vars = c("Noise", "pi0"), variable.name = "Method", value.name = "pi0hat")
pi0hat.plot <- ggplot(data = pi0hat.ggdata, aes(x = pi0, y = pi0hat)) +
geom_boxplot(aes(fill = Method, color = Method), outlier.color = NULL, outlier.size = 0.5
# , outlier.shape = NA
) +
scale_color_manual(values = method.col.pi0hat) +
scale_fill_manual(values = alpha(method.col.pi0hat, 0.35)) +
facet_wrap(~Noise, nrow = 1, ncol = 4) +
geom_hline(yintercept = pi0.vec, col = "black", linetype = "dashed", size = 1) +
labs(x = expression(pi[0]), y = expression(hat(pi)[0])) +
theme(axis.title.x = element_text(size = 15),
axis.text.x = element_text(size = 10, angle = 45, hjust = 1),
axis.title.y = element_text(size = 15),
axis.text.y = element_text(size = 10),
strip.text = element_text(size = 15),
legend.position = "top",
legend.background = element_rect(color = "grey"),
legend.text = element_text(size = 12))
##==================================================
FDP.calib.ggdata <- FXP.ggdata(FDP.list, Noise)
FDR.calib.plot <- ggplot(data = FDP.calib.ggdata, aes(x = L1, y = mean, group = Method, col = Method)) +
geom_line() +
geom_ribbon(aes(ymin = q025, ymax = q975, fill = Method), alpha = 0.35, linetype = "blank") +
scale_color_manual(labels = method.name.FDR, values = method.col.FDR) +
scale_fill_manual(labels = method.name.FDR, values = method.col.FDR) +
facet_wrap(~Noise, nrow = 1, ncol = 4) +
geom_abline(slope = 1, intercept = 0, linetype = "dashed", size = 1, col = "black") +
labs(x = "Nominal FDR", y = "FDP") +
theme(axis.title.x = element_text(size = 12),
axis.text.x = element_text(size = 10, angle = 45, hjust = 1),
axis.title.y = element_text(size = 12),
axis.text.y = element_text(size = 10),
strip.text = element_text(size = 15),
legend.position = "top",
legend.background = element_rect(color = "grey"),
legend.text = element_text(size = 12))
##==================================================
FSP.calib.ggdata <- FXP.ggdata(FSP.list, Noise)
FSR.calib.plot <- ggplot(data = FSP.calib.ggdata, aes(x = L1, y = mean, group = Method, col = Method)) +
geom_line() +
geom_ribbon(aes(ymin = q025, ymax = q975, fill = Method), alpha = 0.35, linetype = "blank") +
scale_color_manual(labels = method.name.FSR, values = method.col.FSR) +
scale_fill_manual(labels = method.name.FSR, values = method.col.FSR) +
facet_wrap(~Noise, nrow = 1, ncol = 4) +
geom_abline(slope = 1, intercept = 0, linetype = "dashed", size = 1, col = "black") +
labs(x = "Nominal FSR", y = "FSP") +
theme(axis.title.x = element_text(size = 12),
axis.text.x = element_text(size = 10, angle = 45, hjust = 1),
axis.title.y = element_text(size = 12),
axis.text.y = element_text(size = 10),
strip.text = element_text(size = 15),
legend.position = "top",
legend.background = element_rect(color = "grey"),
legend.text = element_text(size = 12))
##============================================================
FDP.q <- FDP.list[[which(q.vec == q)]]
FDP.q.noise.mat <- rbind.data.frame(
cbind.data.frame(Noise = rep("All", length(Noise)),
pi0 = factor(do.call(rbind, pi0.list)),
FDP.q),
cbind.data.frame(Noise,
pi0 = factor(do.call(rbind, pi0.list)),
FDP.q)
)
FDP.q.ggdata <- melt(FDP.q.noise.mat, id.vars = c("Noise", "pi0"), variable.name = "Method", value.name = "FDP")
FDP.q.plot <- ggplot(data = FDP.q.ggdata, aes(x = pi0, y = FDP)) +
geom_boxplot(aes(fill = Method, color = Method), outlier.color = NULL, outlier.size = 0.5
# , outlier.shape = NA
) +
scale_color_manual(values = method.col.FDR) +
scale_fill_manual(values = alpha(method.col.FDR, 0.35)) +
facet_wrap(~Noise, nrow = 1, ncol = 4) +
geom_hline(yintercept = q, col = "black", linetype = "dashed", size = 1) +
labs(x = expression(pi[0]), y = "FDP") +
theme(axis.title.x = element_text(size = 15),
axis.text.x = element_text(size = 10, angle = 45, hjust = 1),
axis.title.y = element_text(size = 12),
axis.text.y = element_text(size = 10),
strip.text = element_text(size = 15),
legend.position = "top",
legend.background = element_rect(color = "grey"),
legend.text = element_text(size = 12))
##====================================================================
TDP.q <- TDP.list[[which(q.vec == q)]]
TDP.q.noise.mat <- rbind.data.frame(
cbind.data.frame(Noise = rep("All", length(Noise)),
pi0 = factor(do.call(rbind, pi0.list)),
TDP.q),
cbind.data.frame(Noise,
pi0 = factor(do.call(rbind, pi0.list)),
TDP.q)
)
TDP.q.ggdata <- melt(TDP.q.noise.mat, id.vars = c("Noise", "pi0"), variable.name = "Method", value.name = "TDP")
TDP.q.plot <- ggplot(data = TDP.q.ggdata, aes(x = pi0, y = TDP)) +
geom_boxplot(aes(fill = Method, color = Method), outlier.color = NULL, outlier.size = 0.5
# , outlier.shape = NA
) +
scale_color_manual(values = method.col.FDR) +
scale_fill_manual(values = alpha(method.col.FDR, 0.35)) +
facet_wrap(~Noise, nrow = 1, ncol = 4) +
labs(x = expression(pi[0]), y = "TDP") +
theme(axis.title.x = element_text(size = 15),
axis.text.x = element_text(size = 10, angle = 45, hjust = 1),
axis.title.y = element_text(size = 12),
axis.text.y = element_text(size = 10),
strip.text = element_text(size = 15),
legend.position = "top",
legend.background = element_rect(color = "grey"),
legend.text = element_text(size = 12))Overall
pi0hat.plot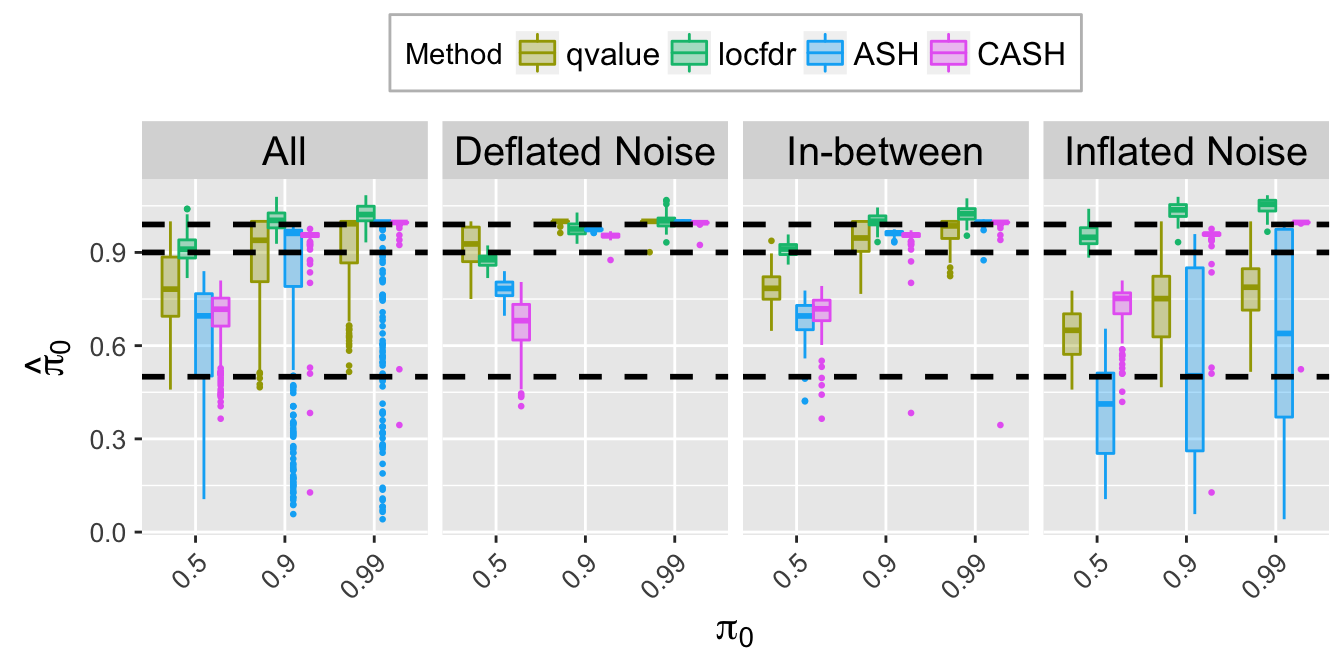
Expand here to see past versions of unnamed-chunk-19-1.png:
| Version | Author | Date |
|---|---|---|
| 1eec7b1 | LSun | 2018-05-23 |
FDR.calib.plot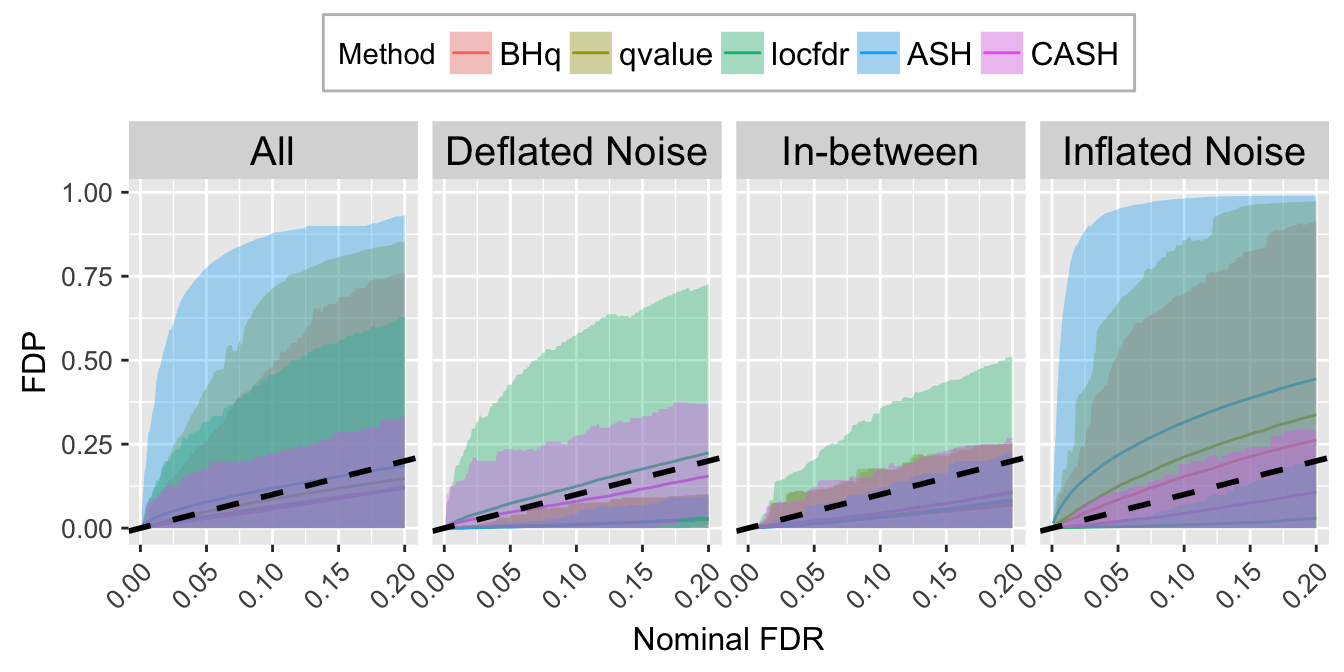
Expand here to see past versions of unnamed-chunk-19-2.png:
| Version | Author | Date |
|---|---|---|
| 1eec7b1 | LSun | 2018-05-23 |
FSR.calib.plot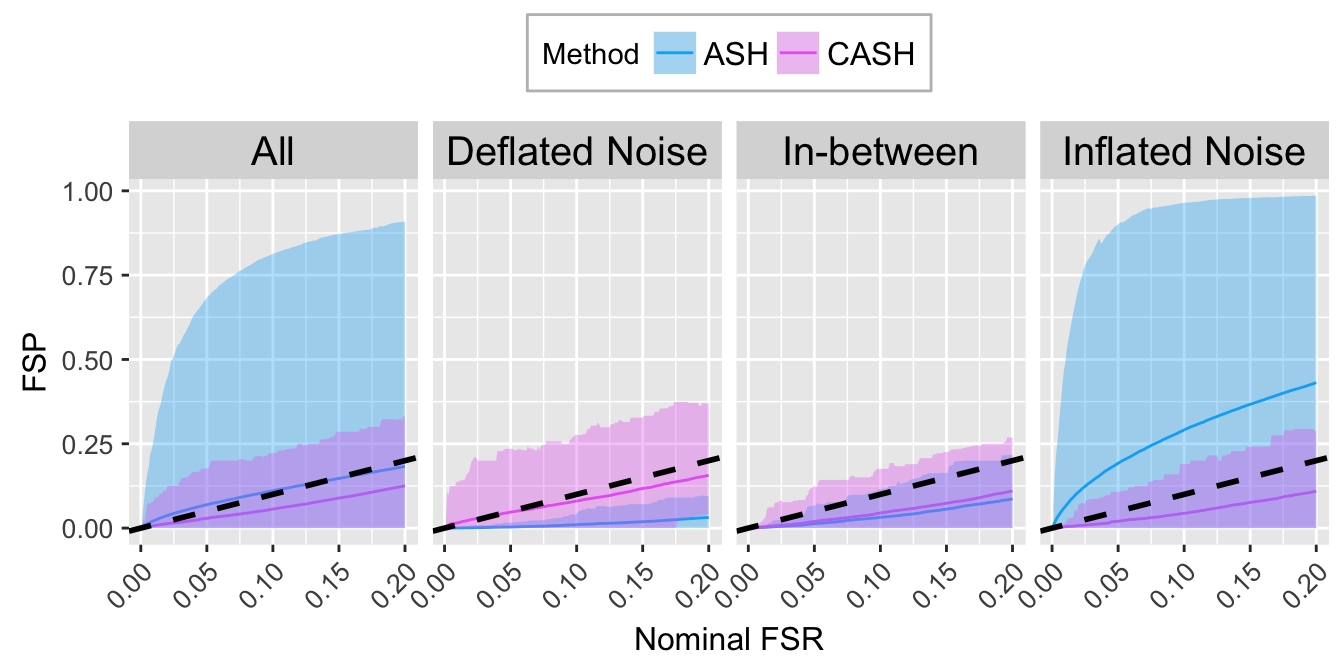
Expand here to see past versions of unnamed-chunk-19-3.png:
| Version | Author | Date |
|---|---|---|
| 1eec7b1 | LSun | 2018-05-23 |
Skew
\[ g_5 = 1/4 N\left(-2, 2^2\right) + 1/4 N\left(-1, 2^2\right) + 1/4 N\left(0, 1^2\right) + 1 / 4 N\left(1, 1^2\right) \]
plotx <- seq(-6, 6, by = 0.01)
plot(plotx, plotx, ylim = c(0, dnorm(0)),
xlab = expression(theta), ylab = expression(g(theta)),
type = "n")
lines(plotx, dnorm(plotx), lty = 2)
lines(plotx, 0.25 * dnorm(plotx, -2, 2) +
0.25 * dnorm(plotx, -1, 2) +
0.25 * dnorm(plotx, 0, 1) +
0.25 * dnorm(plotx, 1, 1), col = "blue")
legend("topright", lty = c(1, 2), col = c(4, 1), c("g", "N(0, 1)"))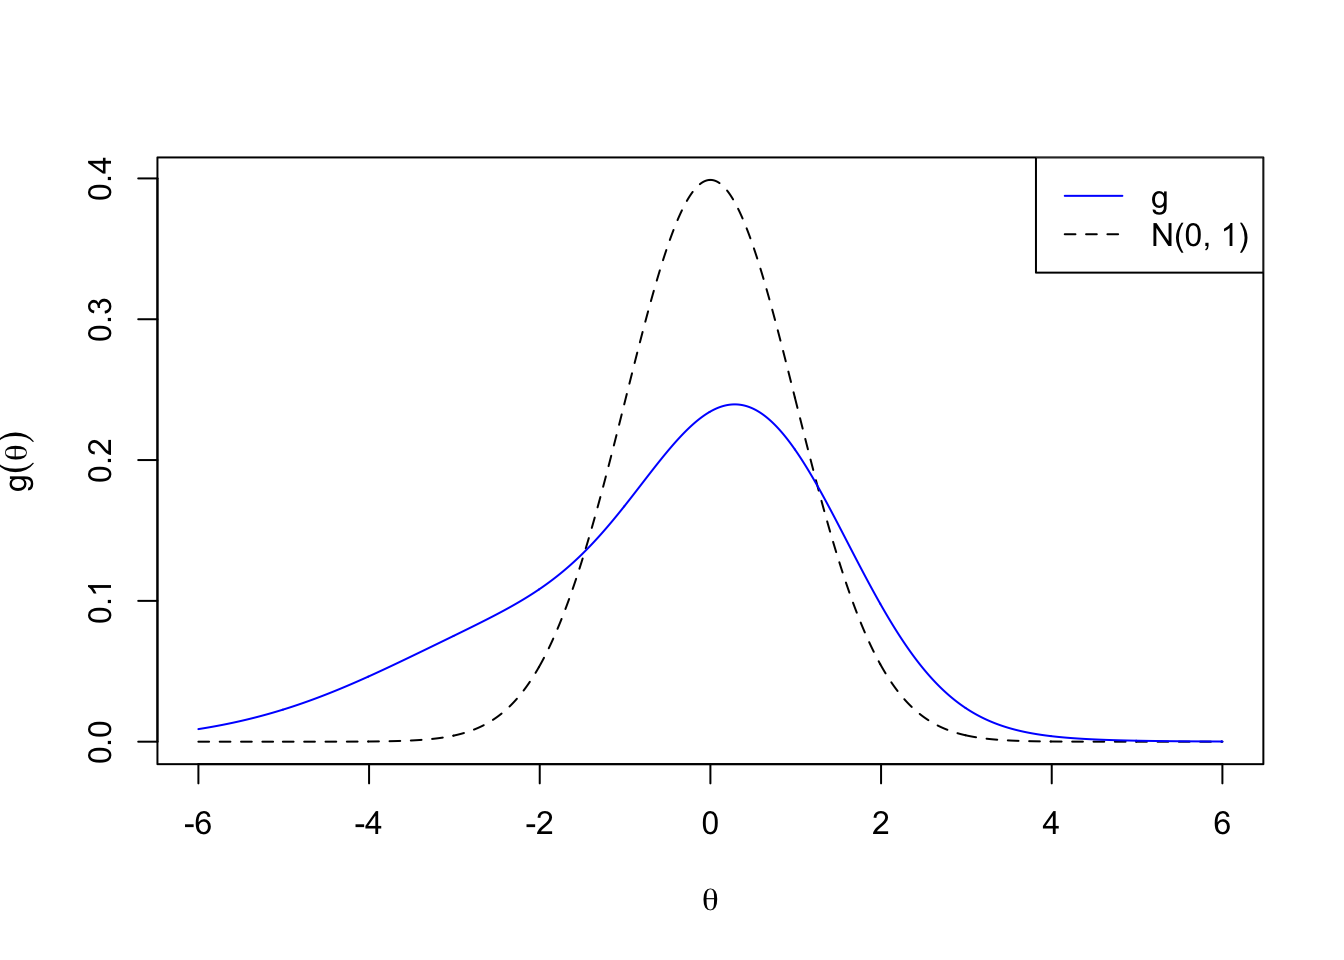
Expand here to see past versions of g5-1.png:
| Version | Author | Date |
|---|---|---|
| 1eec7b1 | LSun | 2018-05-23 |
pi0hat.mat <- cbind.data.frame(pi0 = factor(do.call(rbind, pi0.list)), do.call(rbind, pi0hat.list))

FDP.list <- lapply(q.vec, function (q) {
  t(mapply(function (qvalue.mat, beta, q) {
    apply(qvalue.mat, 2, function (qvalue, q, beta) {
      FDP(q, qvalue, beta)
    }, q, beta)
  }, qvalue.list, beta.list, q))
})
names(FDP.list) <- q.vec

FSP.list <- lapply(q.vec, function (s) {
  t(mapply(function (svalue.mat, beta, betahat, s) {
    apply(svalue.mat, 2, function (svalue, s, beta, betahat) {
      FSP(s, svalue, beta, betahat)
    }, s, beta, betahat)
  }, svalue.list, beta.list, betahat.list, s))
})
names(FSP.list) <- q.vec

TDP.list <- lapply(q.vec, function(q) {
  t(mapply(function(qvalue.mat, beta, q) {
    apply(qvalue.mat, 2, function (qvalue, q, beta) {
      TDP(q, qvalue, beta)
    }, q, beta)
  }, qvalue.list, beta.list, q))
})
names(TDP.list) <- q.vec
sd.z <- sapply(z.list, sd)
Noise <- cut(sd.z, breaks = c(0, quantile(sd.z, probs = 1 : 2 / 3), Inf), labels = c("Deflated Noise", "In-between", "Inflated Noise"))
# Noise <- cut(sd.z, breaks = c(0, z.under, z.over, Inf), labels = c("Deflated Noise", "In-between", "Inflated Noise"))
##=================================================
pi0hat.noise.mat <- rbind.data.frame(
cbind.data.frame(Noise = rep("All", length(Noise)), pi0hat.mat),
cbind.data.frame(Noise, pi0hat.mat)
)
pi0hat.ggdata <- melt(pi0hat.noise.mat, id.vars = c("Noise", "pi0"), variable.name = "Method", value.name = "pi0hat")
pi0hat.plot <- ggplot(data = pi0hat.ggdata, aes(x = pi0, y = pi0hat)) +
geom_boxplot(aes(fill = Method, color = Method), outlier.color = NULL, outlier.size = 0.5
# , outlier.shape = NA
) +
scale_color_manual(values = method.col.pi0hat) +
scale_fill_manual(values = alpha(method.col.pi0hat, 0.35)) +
facet_wrap(~Noise, nrow = 1, ncol = 4) +
geom_hline(yintercept = pi0.vec, col = "black", linetype = "dashed", size = 1) +
labs(x = expression(pi[0]), y = expression(hat(pi)[0])) +
theme(axis.title.x = element_text(size = 15),
axis.text.x = element_text(size = 10, angle = 45, hjust = 1),
axis.title.y = element_text(size = 15),
axis.text.y = element_text(size = 10),
strip.text = element_text(size = 15),
legend.position = "top",
legend.background = element_rect(color = "grey"),
legend.text = element_text(size = 12))
##==================================================
FDP.calib.ggdata <- FXP.ggdata(FDP.list, Noise)
FDR.calib.plot <- ggplot(data = FDP.calib.ggdata, aes(x = L1, y = mean, group = Method, col = Method)) +
geom_line() +
geom_ribbon(aes(ymin = q025, ymax = q975, fill = Method), alpha = 0.35, linetype = "blank") +
scale_color_manual(labels = method.name.FDR, values = method.col.FDR) +
scale_fill_manual(labels = method.name.FDR, values = method.col.FDR) +
facet_wrap(~Noise, nrow = 1, ncol = 4) +
geom_abline(slope = 1, intercept = 0, linetype = "dashed", size = 1, col = "black") +
labs(x = "Nominal FDR", y = "FDP") +
theme(axis.title.x = element_text(size = 12),
axis.text.x = element_text(size = 10, angle = 45, hjust = 1),
axis.title.y = element_text(size = 12),
axis.text.y = element_text(size = 10),
strip.text = element_text(size = 15),
legend.position = "top",
legend.background = element_rect(color = "grey"),
legend.text = element_text(size = 12))
##==================================================
FSP.calib.ggdata <- FXP.ggdata(FSP.list, Noise)
FSR.calib.plot <- ggplot(data = FSP.calib.ggdata, aes(x = L1, y = mean, group = Method, col = Method)) +
geom_line() +
geom_ribbon(aes(ymin = q025, ymax = q975, fill = Method), alpha = 0.35, linetype = "blank") +
scale_color_manual(labels = method.name.FSR, values = method.col.FSR) +
scale_fill_manual(labels = method.name.FSR, values = method.col.FSR) +
facet_wrap(~Noise, nrow = 1, ncol = 4) +
geom_abline(slope = 1, intercept = 0, linetype = "dashed", size = 1, col = "black") +
labs(x = "Nominal FSR", y = "FSP") +
theme(axis.title.x = element_text(size = 12),
axis.text.x = element_text(size = 10, angle = 45, hjust = 1),
axis.title.y = element_text(size = 12),
axis.text.y = element_text(size = 10),
strip.text = element_text(size = 15),
legend.position = "top",
legend.background = element_rect(color = "grey"),
legend.text = element_text(size = 12))
##============================================================
FDP.q <- FDP.list[[which(q.vec == q)]]
FDP.q.noise.mat <- rbind.data.frame(
cbind.data.frame(Noise = rep("All", length(Noise)),
pi0 = factor(do.call(rbind, pi0.list)),
FDP.q),
cbind.data.frame(Noise,
pi0 = factor(do.call(rbind, pi0.list)),
FDP.q)
)
FDP.q.ggdata <- melt(FDP.q.noise.mat, id.vars = c("Noise", "pi0"), variable.name = "Method", value.name = "FDP")
FDP.q.plot <- ggplot(data = FDP.q.ggdata, aes(x = pi0, y = FDP)) +
geom_boxplot(aes(fill = Method, color = Method), outlier.color = NULL, outlier.size = 0.5
# , outlier.shape = NA
) +
scale_color_manual(values = method.col.FDR) +
scale_fill_manual(values = alpha(method.col.FDR, 0.35)) +
facet_wrap(~Noise, nrow = 1, ncol = 4) +
geom_hline(yintercept = q, col = "black", linetype = "dashed", size = 1) +
labs(x = expression(pi[0]), y = "FDP") +
theme(axis.title.x = element_text(size = 15),
axis.text.x = element_text(size = 10, angle = 45, hjust = 1),
axis.title.y = element_text(size = 12),
axis.text.y = element_text(size = 10),
strip.text = element_text(size = 15),
legend.position = "top",
legend.background = element_rect(color = "grey"),
legend.text = element_text(size = 12))
##====================================================================
TDP.q <- TDP.list[[which(q.vec == q)]]
TDP.q.noise.mat <- rbind.data.frame(
cbind.data.frame(Noise = rep("All", length(Noise)),
pi0 = factor(do.call(rbind, pi0.list)),
TDP.q),
cbind.data.frame(Noise,
pi0 = factor(do.call(rbind, pi0.list)),
TDP.q)
)
TDP.q.ggdata <- melt(TDP.q.noise.mat, id.vars = c("Noise", "pi0"), variable.name = "Method", value.name = "TDP")
TDP.q.plot <- ggplot(data = TDP.q.ggdata, aes(x = pi0, y = TDP)) +
geom_boxplot(aes(fill = Method, color = Method), outlier.color = NULL, outlier.size = 0.5
# , outlier.shape = NA
) +
scale_color_manual(values = method.col.FDR) +
scale_fill_manual(values = alpha(method.col.FDR, 0.35)) +
facet_wrap(~Noise, nrow = 1, ncol = 4) +
labs(x = expression(pi[0]), y = "TDP") +
theme(axis.title.x = element_text(size = 15),
axis.text.x = element_text(size = 10, angle = 45, hjust = 1),
axis.title.y = element_text(size = 12),
axis.text.y = element_text(size = 10),
strip.text = element_text(size = 15),
legend.position = "top",
legend.background = element_rect(color = "grey"),
legend.text = element_text(size = 12))Overall
pi0hat.plot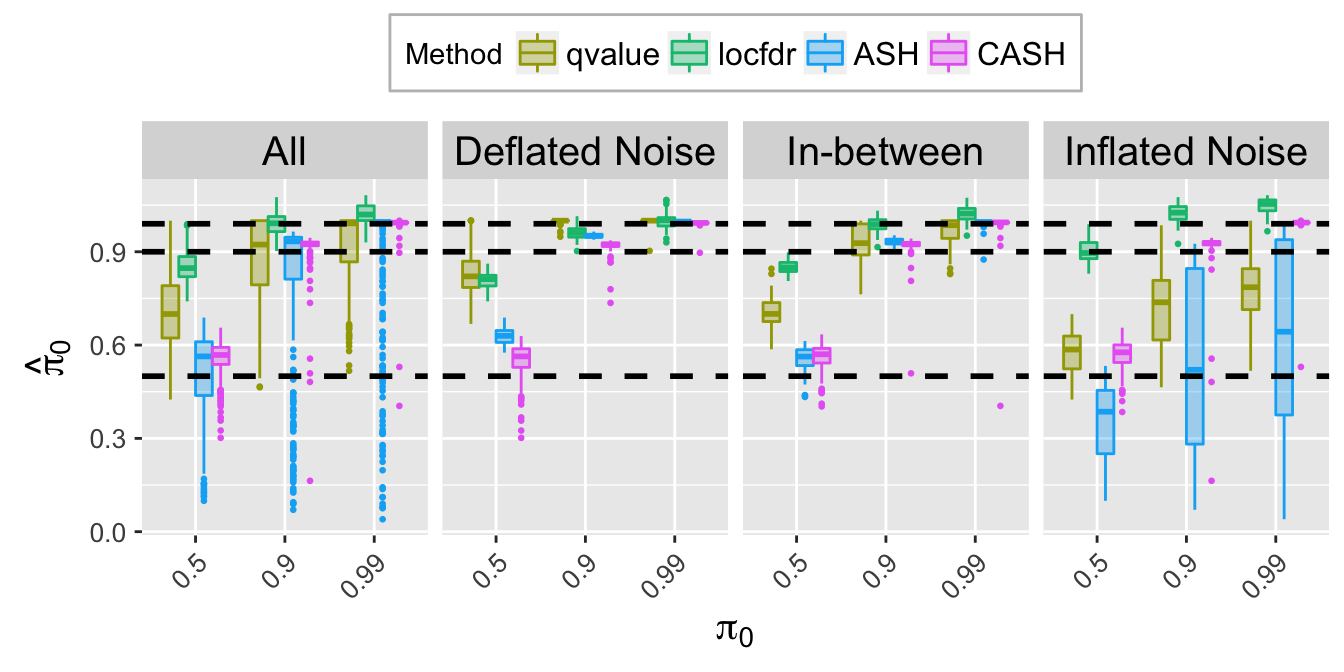
Expand here to see past versions of unnamed-chunk-23-1.png:
| Version | Author | Date |
|---|---|---|
| 1eec7b1 | LSun | 2018-05-23 |
FDR.calib.plot
Expand here to see past versions of unnamed-chunk-23-2.png:
| Version | Author | Date |
|---|---|---|
| 1eec7b1 | LSun | 2018-05-23 |
FSR.calib.plot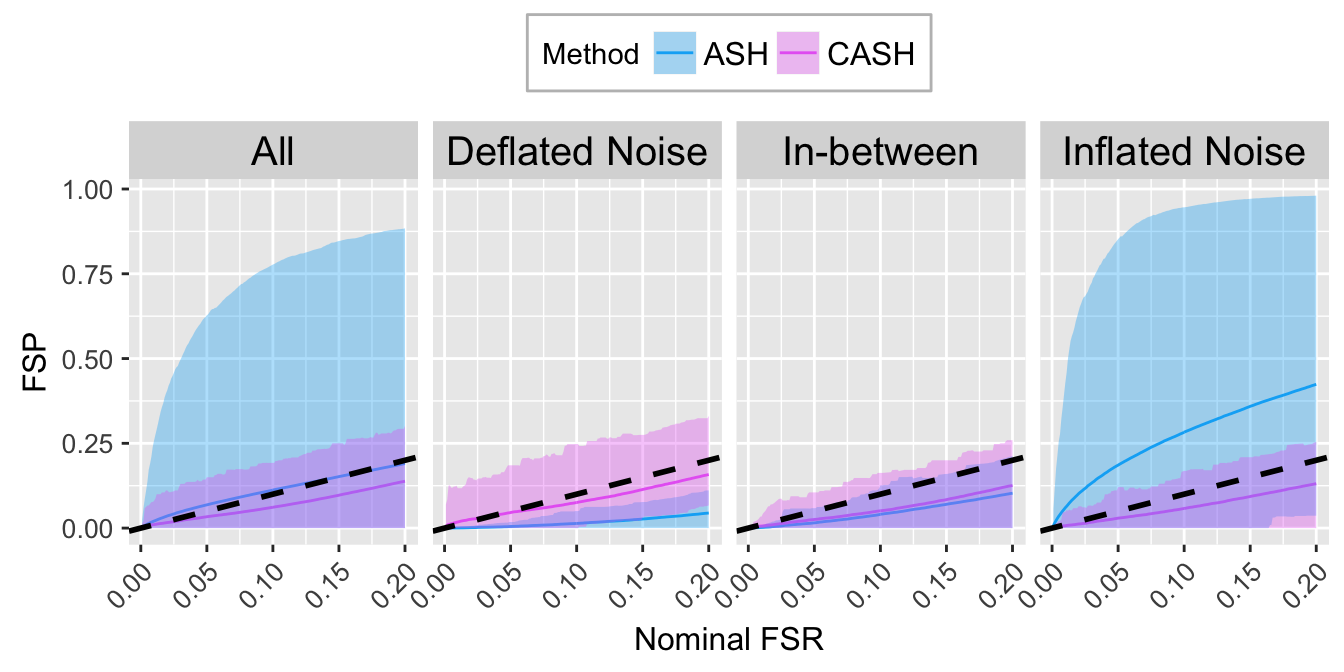
Expand here to see past versions of unnamed-chunk-23-3.png:
| Version | Author | Date |
|---|---|---|
| 1eec7b1 | LSun | 2018-05-23 |
Flattop
\[ g_6 = \frac17\left[N\left(-1.5, 0.5^2\right) + N\left(-1, 0.5^2\right) + N\left(-0.5, 0.5^2\right) + N\left(0, 0.5^2\right) + N\left(0.5, 0.5^2\right) + N\left(1, 0.5^2\right) + N\left(1.5, 0.5^2\right)\right] \]
plotx <- seq(-6, 6, by = 0.01)
plot(plotx, plotx, ylim = c(0, dnorm(0)),
xlab = expression(theta), ylab = expression(g(theta)),
type = "n")
lines(plotx, dnorm(plotx), lty = 2)
lines(plotx, sapply(plotx, function(x) {mean(dnorm(x, seq(-1.5, 1.5, by = 0.5), 0.5))}), col = "blue")
legend("topright", lty = c(1, 2), col = c(4, 1), c("g", "N(0, 1)"))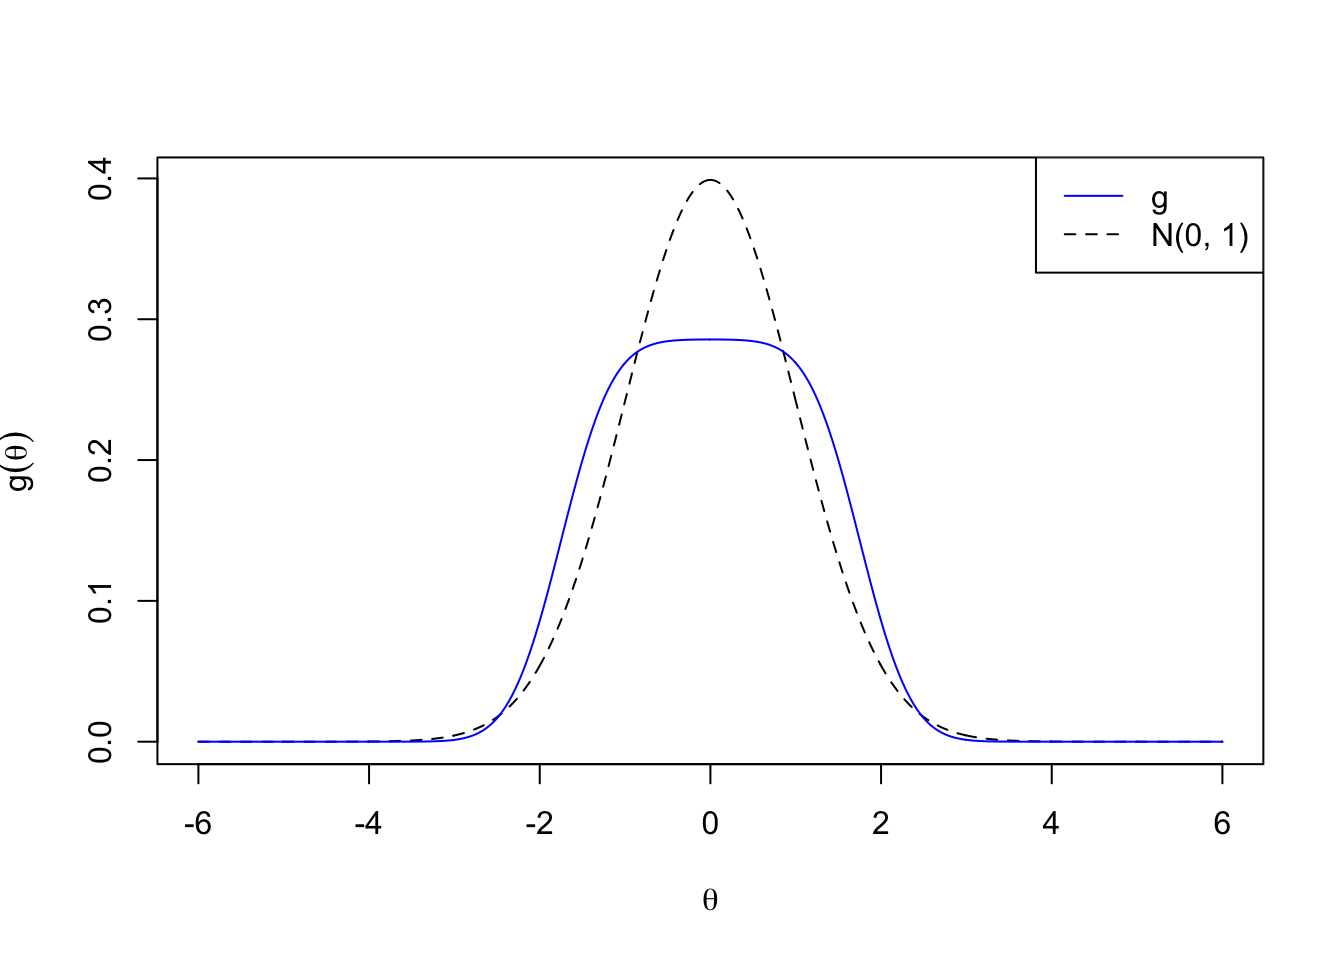
Expand here to see past versions of g6-1.png:
| Version | Author | Date |
|---|---|---|
| 1eec7b1 | LSun | 2018-05-23 |
pi0hat.mat <- cbind.data.frame(pi0 = factor(do.call(rbind, pi0.list)), do.call(rbind, pi0hat.list))

FDP.list <- lapply(q.vec, function (q) {
  t(mapply(function (qvalue.mat, beta, q) {
    apply(qvalue.mat, 2, function (qvalue, q, beta) {
      FDP(q, qvalue, beta)
    }, q, beta)
  }, qvalue.list, beta.list, q))
})
names(FDP.list) <- q.vec

FSP.list <- lapply(q.vec, function (s) {
  t(mapply(function (svalue.mat, beta, betahat, s) {
    apply(svalue.mat, 2, function (svalue, s, beta, betahat) {
      FSP(s, svalue, beta, betahat)
    }, s, beta, betahat)
  }, svalue.list, beta.list, betahat.list, s))
})
names(FSP.list) <- q.vec

TDP.list <- lapply(q.vec, function(q) {
  t(mapply(function(qvalue.mat, beta, q) {
    apply(qvalue.mat, 2, function (qvalue, q, beta) {
      TDP(q, qvalue, beta)
    }, q, beta)
  }, qvalue.list, beta.list, q))
})
names(TDP.list) <- q.vec
sd.z <- sapply(z.list, sd)
Noise <- cut(sd.z, breaks = c(0, quantile(sd.z, probs = 1 : 2 / 3), Inf), labels = c("Deflated Noise", "In-between", "Inflated Noise"))
# Noise <- cut(sd.z, breaks = c(0, z.under, z.over, Inf), labels = c("Deflated Noise", "In-between", "Inflated Noise"))
##=================================================
pi0hat.noise.mat <- rbind.data.frame(
cbind.data.frame(Noise = rep("All", length(Noise)), pi0hat.mat),
cbind.data.frame(Noise, pi0hat.mat)
)
pi0hat.ggdata <- melt(pi0hat.noise.mat, id.vars = c("Noise", "pi0"), variable.name = "Method", value.name = "pi0hat")
pi0hat.plot <- ggplot(data = pi0hat.ggdata, aes(x = pi0, y = pi0hat)) +
geom_boxplot(aes(fill = Method, color = Method), outlier.color = NULL, outlier.size = 0.5
# , outlier.shape = NA
) +
scale_color_manual(values = method.col.pi0hat) +
scale_fill_manual(values = alpha(method.col.pi0hat, 0.35)) +
facet_wrap(~Noise, nrow = 1, ncol = 4) +
geom_hline(yintercept = pi0.vec, col = "black", linetype = "dashed", size = 1) +
labs(x = expression(pi[0]), y = expression(hat(pi)[0])) +
theme(axis.title.x = element_text(size = 15),
axis.text.x = element_text(size = 10, angle = 45, hjust = 1),
axis.title.y = element_text(size = 15),
axis.text.y = element_text(size = 10),
strip.text = element_text(size = 15),
legend.position = "top",
legend.background = element_rect(color = "grey"),
legend.text = element_text(size = 12))
##==================================================
FDP.calib.ggdata <- FXP.ggdata(FDP.list, Noise)
FDR.calib.plot <- ggplot(data = FDP.calib.ggdata, aes(x = L1, y = mean, group = Method, col = Method)) +
geom_line() +
geom_ribbon(aes(ymin = q025, ymax = q975, fill = Method), alpha = 0.35, linetype = "blank") +
scale_color_manual(labels = method.name.FDR, values = method.col.FDR) +
scale_fill_manual(labels = method.name.FDR, values = method.col.FDR) +
facet_wrap(~Noise, nrow = 1, ncol = 4) +
geom_abline(slope = 1, intercept = 0, linetype = "dashed", size = 1, col = "black") +
labs(x = "Nominal FDR", y = "FDP") +
theme(axis.title.x = element_text(size = 12),
axis.text.x = element_text(size = 10, angle = 45, hjust = 1),
axis.title.y = element_text(size = 12),
axis.text.y = element_text(size = 10),
strip.text = element_text(size = 15),
legend.position = "top",
legend.background = element_rect(color = "grey"),
legend.text = element_text(size = 12))
##==================================================
FSP.calib.ggdata <- FXP.ggdata(FSP.list, Noise)
FSR.calib.plot <- ggplot(data = FSP.calib.ggdata, aes(x = L1, y = mean, group = Method, col = Method)) +
geom_line() +
geom_ribbon(aes(ymin = q025, ymax = q975, fill = Method), alpha = 0.35, linetype = "blank") +
scale_color_manual(labels = method.name.FSR, values = method.col.FSR) +
scale_fill_manual(labels = method.name.FSR, values = method.col.FSR) +
facet_wrap(~Noise, nrow = 1, ncol = 4) +
geom_abline(slope = 1, intercept = 0, linetype = "dashed", size = 1, col = "black") +
labs(x = "Nominal FSR", y = "FSP") +
theme(axis.title.x = element_text(size = 12),
axis.text.x = element_text(size = 10, angle = 45, hjust = 1),
axis.title.y = element_text(size = 12),
axis.text.y = element_text(size = 10),
strip.text = element_text(size = 15),
legend.position = "top",
legend.background = element_rect(color = "grey"),
legend.text = element_text(size = 12))
##============================================================
FDP.q <- FDP.list[[which(q.vec == q)]]
FDP.q.noise.mat <- rbind.data.frame(
cbind.data.frame(Noise = rep("All", length(Noise)),
pi0 = factor(do.call(rbind, pi0.list)),
FDP.q),
cbind.data.frame(Noise,
pi0 = factor(do.call(rbind, pi0.list)),
FDP.q)
)
FDP.q.ggdata <- melt(FDP.q.noise.mat, id.vars = c("Noise", "pi0"), variable.name = "Method", value.name = "FDP")
FDP.q.plot <- ggplot(data = FDP.q.ggdata, aes(x = pi0, y = FDP)) +
geom_boxplot(aes(fill = Method, color = Method), outlier.color = NULL, outlier.size = 0.5
# , outlier.shape = NA
) +
scale_color_manual(values = method.col.FDR) +
scale_fill_manual(values = alpha(method.col.FDR, 0.35)) +
facet_wrap(~Noise, nrow = 1, ncol = 4) +
geom_hline(yintercept = q, col = "black", linetype = "dashed", size = 1) +
labs(x = expression(pi[0]), y = "FDP") +
theme(axis.title.x = element_text(size = 15),
axis.text.x = element_text(size = 10, angle = 45, hjust = 1),
axis.title.y = element_text(size = 12),
axis.text.y = element_text(size = 10),
strip.text = element_text(size = 15),
legend.position = "top",
legend.background = element_rect(color = "grey"),
legend.text = element_text(size = 12))
##====================================================================
TDP.q <- TDP.list[[which(q.vec == q)]]
TDP.q.noise.mat <- rbind.data.frame(
cbind.data.frame(Noise = rep("All", length(Noise)),
pi0 = factor(do.call(rbind, pi0.list)),
TDP.q),
cbind.data.frame(Noise,
pi0 = factor(do.call(rbind, pi0.list)),
TDP.q)
)
TDP.q.ggdata <- melt(TDP.q.noise.mat, id.vars = c("Noise", "pi0"), variable.name = "Method", value.name = "TDP")
TDP.q.plot <- ggplot(data = TDP.q.ggdata, aes(x = pi0, y = TDP)) +
geom_boxplot(aes(fill = Method, color = Method), outlier.color = NULL, outlier.size = 0.5
# , outlier.shape = NA
) +
scale_color_manual(values = method.col.FDR) +
scale_fill_manual(values = alpha(method.col.FDR, 0.35)) +
facet_wrap(~Noise, nrow = 1, ncol = 4) +
labs(x = expression(pi[0]), y = "TDP") +
theme(axis.title.x = element_text(size = 15),
axis.text.x = element_text(size = 10, angle = 45, hjust = 1),
axis.title.y = element_text(size = 12),
axis.text.y = element_text(size = 10),
strip.text = element_text(size = 15),
legend.position = "top",
legend.background = element_rect(color = "grey"),
legend.text = element_text(size = 12))Overall
pi0hat.plot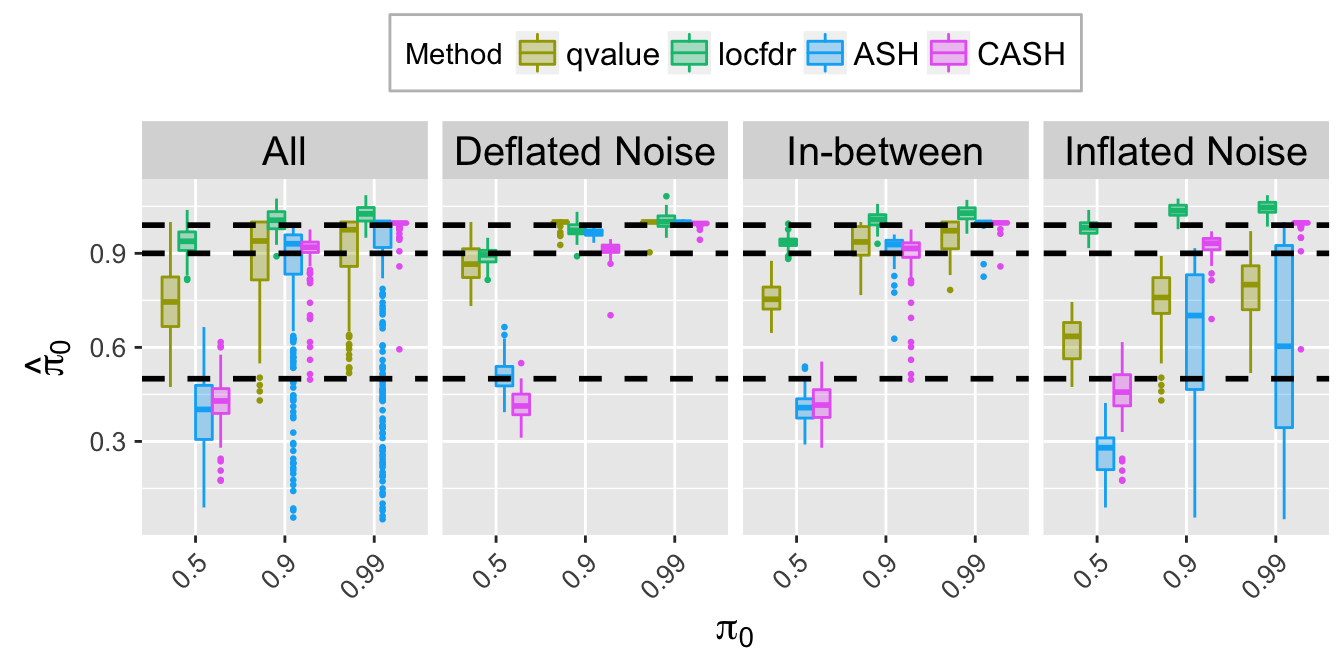
Expand here to see past versions of unnamed-chunk-27-1.png:
| Version | Author | Date |
|---|---|---|
| 1eec7b1 | LSun | 2018-05-23 |
FDR.calib.plot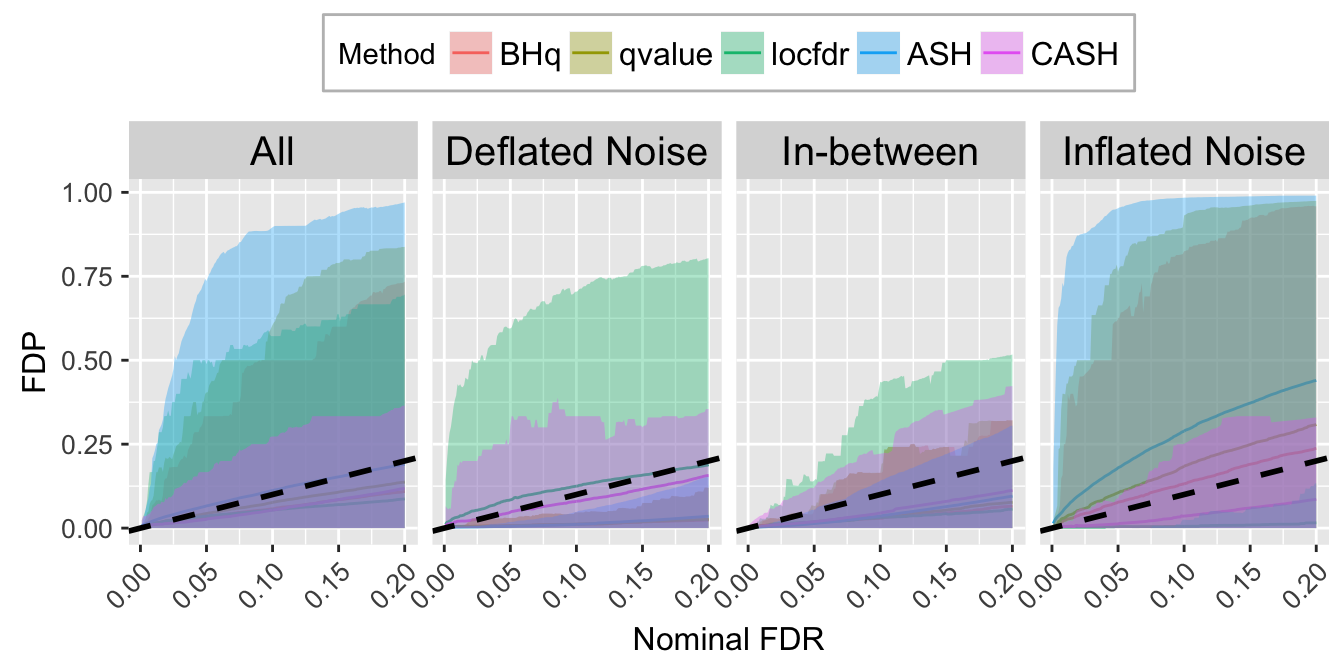
Expand here to see past versions of unnamed-chunk-27-2.png:
| Version | Author | Date |
|---|---|---|
| 1eec7b1 | LSun | 2018-05-23 |
FSR.calib.plot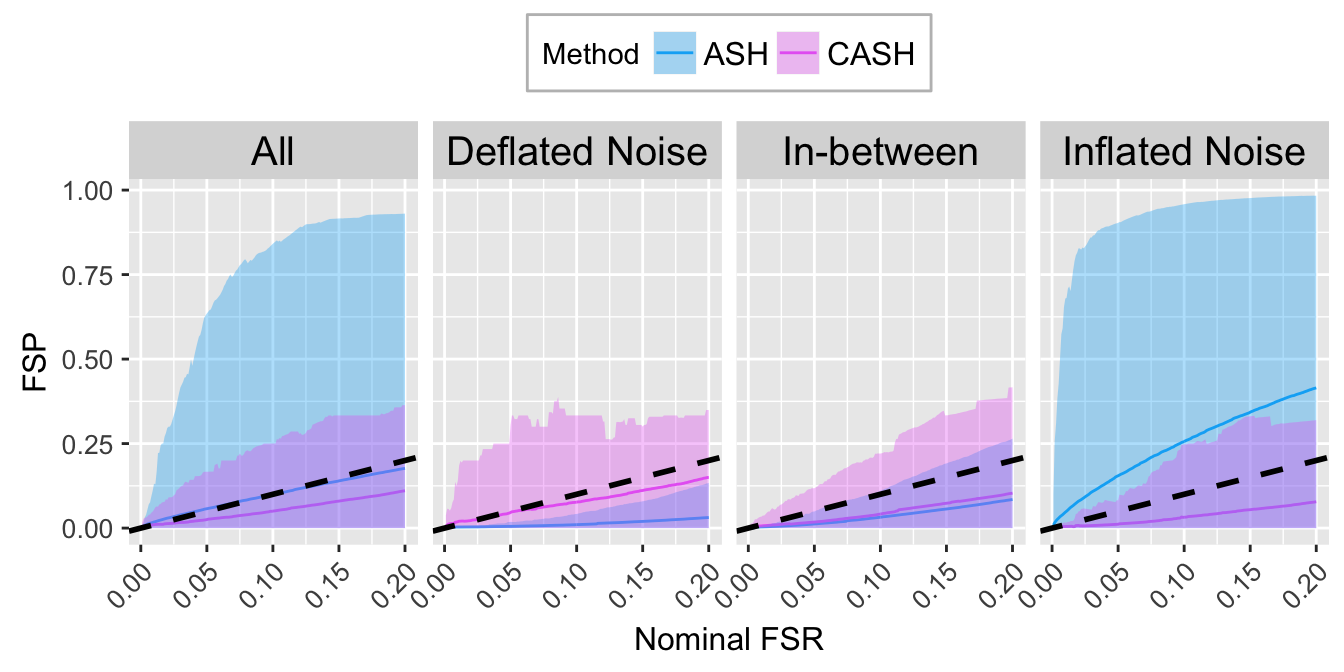
Expand here to see past versions of unnamed-chunk-27-3.png:
| Version | Author | Date |
|---|---|---|
| 1eec7b1 | LSun | 2018-05-23 |
Bimodal
\[ g_7 = 0.5 N\left(-1.5, 1\right) + 0.5 N\left(1.5, 1\right) \]
plotx <- seq(-6, 6, by = 0.01)
plot(plotx, plotx, ylim = c(0, dnorm(0)),
xlab = expression(theta), ylab = expression(g(theta)),
type = "n")
lines(plotx, dnorm(plotx), lty = 2)
lines(plotx, 0.5 * dnorm(plotx, -1.5, 1) +
0.5 * dnorm(plotx, 1.5, 1), col = "blue")
legend("topright", lty = c(1, 2), col = c(4, 1), c("g", "N(0, 1)"))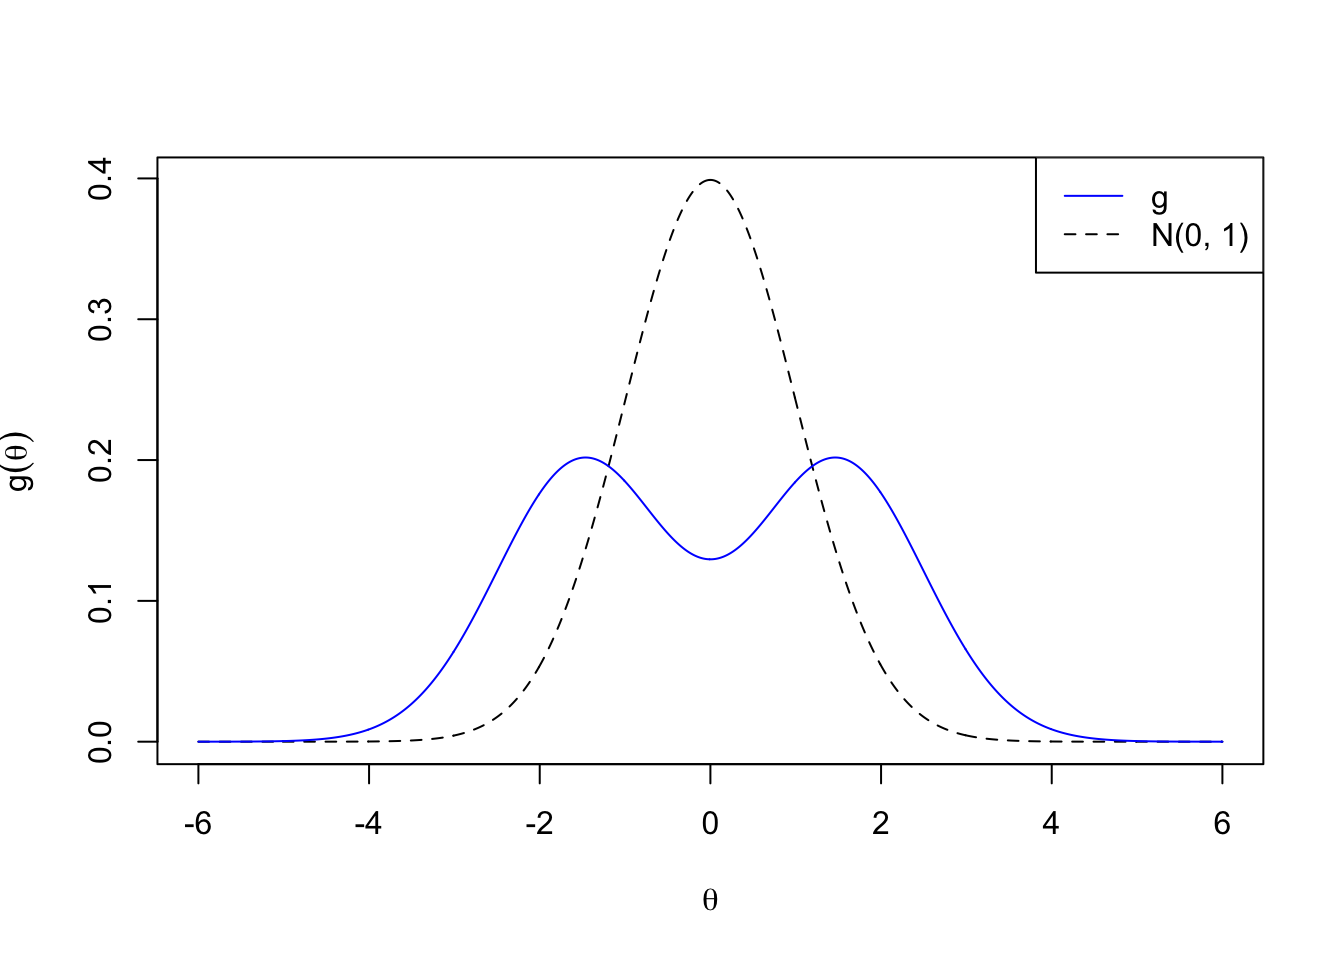
Expand here to see past versions of g7-1.png:
| Version | Author | Date |
|---|---|---|
| 1eec7b1 | LSun | 2018-05-23 |
pi0hat.mat <- cbind.data.frame(pi0 = factor(do.call(rbind, pi0.list)), do.call(rbind, pi0hat.list))

FDP.list <- lapply(q.vec, function (q) {
  t(mapply(function (qvalue.mat, beta, q) {
    apply(qvalue.mat, 2, function (qvalue, q, beta) {
      FDP(q, qvalue, beta)
    }, q, beta)
  }, qvalue.list, beta.list, q))
})
names(FDP.list) <- q.vec

FSP.list <- lapply(q.vec, function (s) {
  t(mapply(function (svalue.mat, beta, betahat, s) {
    apply(svalue.mat, 2, function (svalue, s, beta, betahat) {
      FSP(s, svalue, beta, betahat)
    }, s, beta, betahat)
  }, svalue.list, beta.list, betahat.list, s))
})
names(FSP.list) <- q.vec

TDP.list <- lapply(q.vec, function(q) {
  t(mapply(function(qvalue.mat, beta, q) {
    apply(qvalue.mat, 2, function (qvalue, q, beta) {
      TDP(q, qvalue, beta)
    }, q, beta)
  }, qvalue.list, beta.list, q))
})
names(TDP.list) <- q.vec
sd.z <- sapply(z.list, sd)
Noise <- cut(sd.z, breaks = c(0, quantile(sd.z, probs = 1 : 2 / 3), Inf), labels = c("Deflated Noise", "In-between", "Inflated Noise"))
# Noise <- cut(sd.z, breaks = c(0, z.under, z.over, Inf), labels = c("Deflated Noise", "In-between", "Inflated Noise"))
##=================================================
pi0hat.noise.mat <- rbind.data.frame(
cbind.data.frame(Noise = rep("All", length(Noise)), pi0hat.mat),
cbind.data.frame(Noise, pi0hat.mat)
)
pi0hat.ggdata <- melt(pi0hat.noise.mat, id.vars = c("Noise", "pi0"), variable.name = "Method", value.name = "pi0hat")
pi0hat.plot <- ggplot(data = pi0hat.ggdata, aes(x = pi0, y = pi0hat)) +
geom_boxplot(aes(fill = Method, color = Method), outlier.color = NULL, outlier.size = 0.5
# , outlier.shape = NA
) +
scale_color_manual(values = method.col.pi0hat) +
scale_fill_manual(values = alpha(method.col.pi0hat, 0.35)) +
facet_wrap(~Noise, nrow = 1, ncol = 4) +
geom_hline(yintercept = pi0.vec, col = "black", linetype = "dashed", size = 1) +
labs(x = expression(pi[0]), y = expression(hat(pi)[0])) +
theme(axis.title.x = element_text(size = 15),
axis.text.x = element_text(size = 10, angle = 45, hjust = 1),
axis.title.y = element_text(size = 15),
axis.text.y = element_text(size = 10),
strip.text = element_text(size = 15),
legend.position = "top",
legend.background = element_rect(color = "grey"),
legend.text = element_text(size = 12))
##==================================================
FDP.calib.ggdata <- FXP.ggdata(FDP.list, Noise)
FDR.calib.plot <- ggplot(data = FDP.calib.ggdata, aes(x = L1, y = mean, group = Method, col = Method)) +
geom_line() +
geom_ribbon(aes(ymin = q025, ymax = q975, fill = Method), alpha = 0.35, linetype = "blank") +
scale_color_manual(labels = method.name.FDR, values = method.col.FDR) +
scale_fill_manual(labels = method.name.FDR, values = method.col.FDR) +
facet_wrap(~Noise, nrow = 1, ncol = 4) +
geom_abline(slope = 1, intercept = 0, linetype = "dashed", size = 1, col = "black") +
labs(x = "Nominal FDR", y = "FDP") +
theme(axis.title.x = element_text(size = 12),
axis.text.x = element_text(size = 10, angle = 45, hjust = 1),
axis.title.y = element_text(size = 12),
axis.text.y = element_text(size = 10),
strip.text = element_text(size = 15),
legend.position = "top",
legend.background = element_rect(color = "grey"),
legend.text = element_text(size = 12))
##==================================================
FSP.calib.ggdata <- FXP.ggdata(FSP.list, Noise)
FSR.calib.plot <- ggplot(data = FSP.calib.ggdata, aes(x = L1, y = mean, group = Method, col = Method)) +
geom_line() +
geom_ribbon(aes(ymin = q025, ymax = q975, fill = Method), alpha = 0.35, linetype = "blank") +
scale_color_manual(labels = method.name.FSR, values = method.col.FSR) +
scale_fill_manual(labels = method.name.FSR, values = method.col.FSR) +
facet_wrap(~Noise, nrow = 1, ncol = 4) +
geom_abline(slope = 1, intercept = 0, linetype = "dashed", size = 1, col = "black") +
labs(x = "Nominal FSR", y = "FSP") +
theme(axis.title.x = element_text(size = 12),
axis.text.x = element_text(size = 10, angle = 45, hjust = 1),
axis.title.y = element_text(size = 12),
axis.text.y = element_text(size = 10),
strip.text = element_text(size = 15),
legend.position = "top",
legend.background = element_rect(color = "grey"),
legend.text = element_text(size = 12))
##============================================================
FDP.q <- FDP.list[[which(q.vec == q)]]
FDP.q.noise.mat <- rbind.data.frame(
cbind.data.frame(Noise = rep("All", length(Noise)),
pi0 = factor(do.call(rbind, pi0.list)),
FDP.q),
cbind.data.frame(Noise,
pi0 = factor(do.call(rbind, pi0.list)),
FDP.q)
)
FDP.q.ggdata <- melt(FDP.q.noise.mat, id.vars = c("Noise", "pi0"), variable.name = "Method", value.name = "FDP")
FDP.q.plot <- ggplot(data = FDP.q.ggdata, aes(x = pi0, y = FDP)) +
geom_boxplot(aes(fill = Method, color = Method), outlier.color = NULL, outlier.size = 0.5
# , outlier.shape = NA
) +
scale_color_manual(values = method.col.FDR) +
scale_fill_manual(values = alpha(method.col.FDR, 0.35)) +
facet_wrap(~Noise, nrow = 1, ncol = 4) +
geom_hline(yintercept = q, col = "black", linetype = "dashed", size = 1) +
labs(x = expression(pi[0]), y = "FDP") +
theme(axis.title.x = element_text(size = 15),
axis.text.x = element_text(size = 10, angle = 45, hjust = 1),
axis.title.y = element_text(size = 12),
axis.text.y = element_text(size = 10),
strip.text = element_text(size = 15),
legend.position = "top",
legend.background = element_rect(color = "grey"),
legend.text = element_text(size = 12))
##====================================================================
TDP.q <- TDP.list[[which(q.vec == q)]]
TDP.q.noise.mat <- rbind.data.frame(
cbind.data.frame(Noise = rep("All", length(Noise)),
pi0 = factor(do.call(rbind, pi0.list)),
TDP.q),
cbind.data.frame(Noise,
pi0 = factor(do.call(rbind, pi0.list)),
TDP.q)
)
TDP.q.ggdata <- melt(TDP.q.noise.mat, id.vars = c("Noise", "pi0"), variable.name = "Method", value.name = "TDP")
TDP.q.plot <- ggplot(data = TDP.q.ggdata, aes(x = pi0, y = TDP)) +
geom_boxplot(aes(fill = Method, color = Method), outlier.color = NULL, outlier.size = 0.5
# , outlier.shape = NA
) +
scale_color_manual(values = method.col.FDR) +
scale_fill_manual(values = alpha(method.col.FDR, 0.35)) +
facet_wrap(~Noise, nrow = 1, ncol = 4) +
labs(x = expression(pi[0]), y = "TDP") +
theme(axis.title.x = element_text(size = 15),
axis.text.x = element_text(size = 10, angle = 45, hjust = 1),
axis.title.y = element_text(size = 12),
axis.text.y = element_text(size = 10),
strip.text = element_text(size = 15),
legend.position = "top",
legend.background = element_rect(color = "grey"),
legend.text = element_text(size = 12))Overall
pi0hat.plot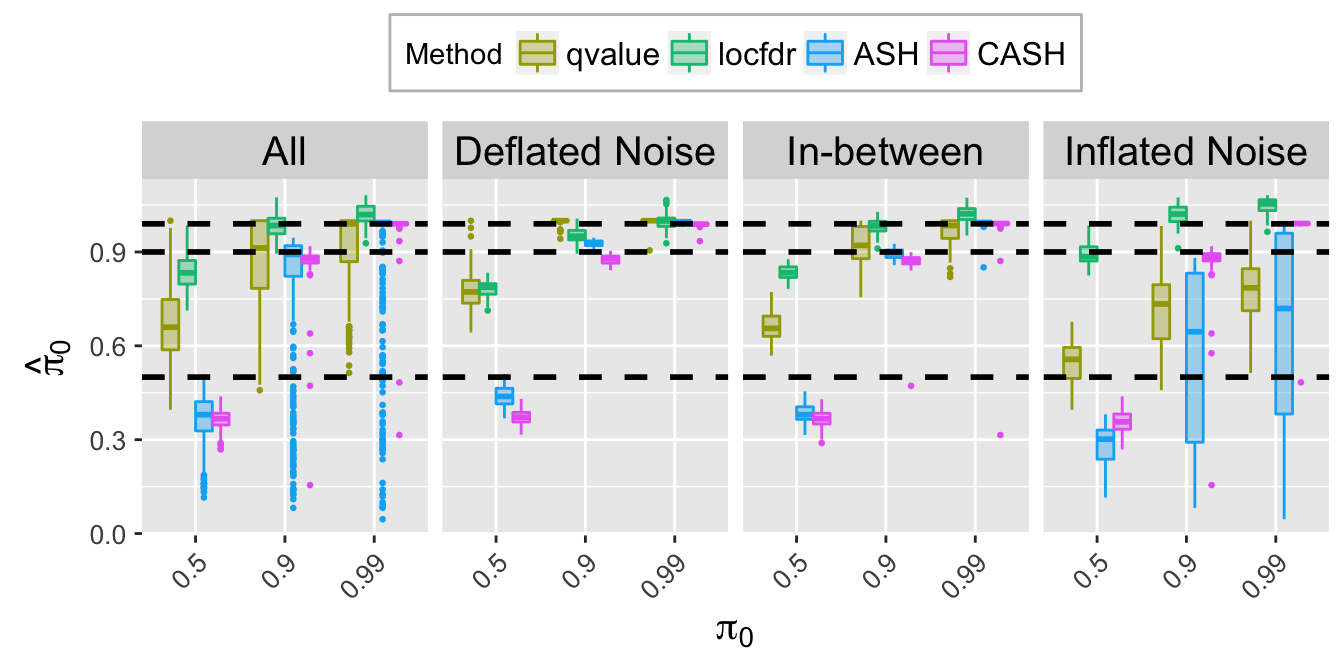
Expand here to see past versions of unnamed-chunk-31-1.png:
| Version | Author | Date |
|---|---|---|
| 1eec7b1 | LSun | 2018-05-23 |
FDR.calib.plot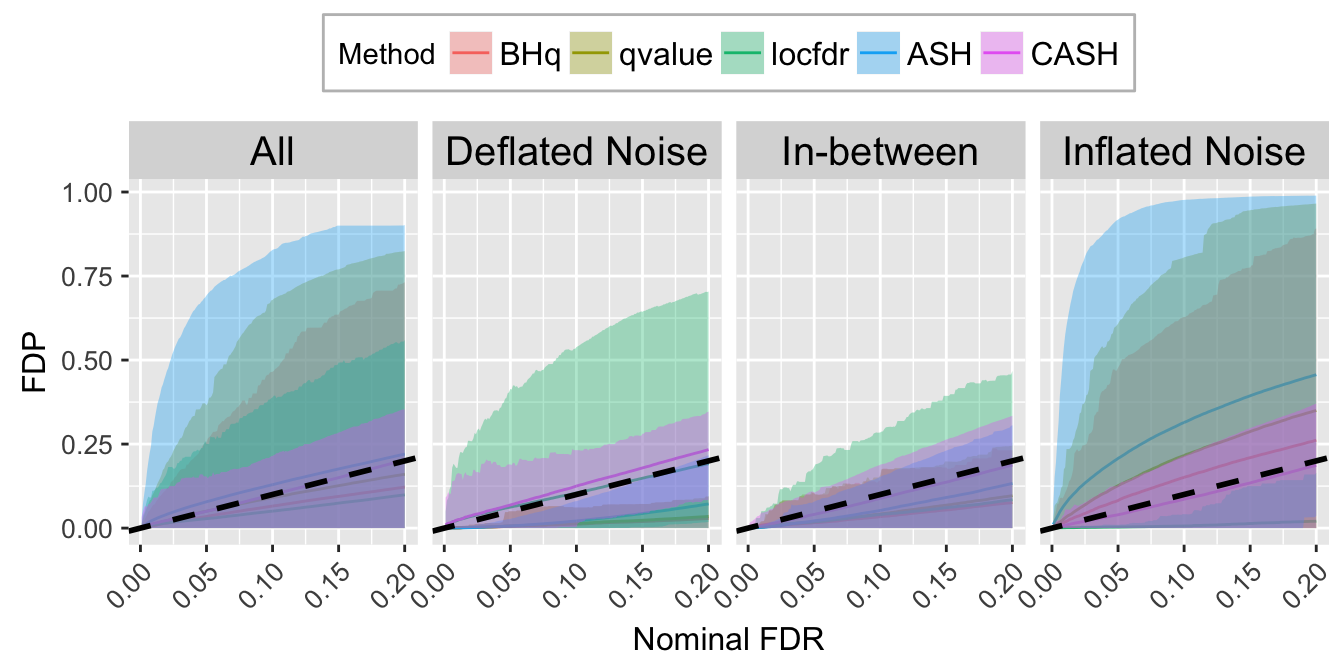
Expand here to see past versions of unnamed-chunk-31-2.png:
| Version | Author | Date |
|---|---|---|
| 1eec7b1 | LSun | 2018-05-23 |
FSR.calib.plot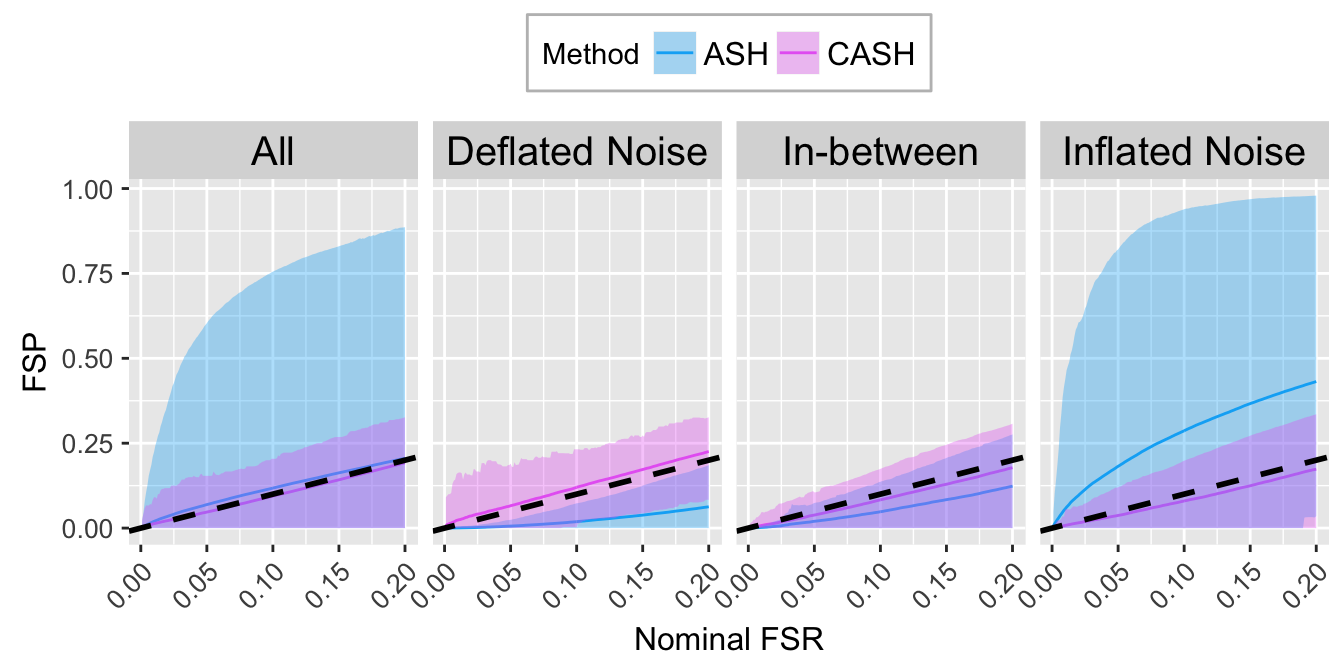
Expand here to see past versions of unnamed-chunk-31-3.png:
| Version | Author | Date |
|---|---|---|
| 1eec7b1 | LSun | 2018-05-23 |
Session information
sessionInfo()R version 3.4.3 (2017-11-30)
Platform: x86_64-apple-darwin15.6.0 (64-bit)
Running under: macOS High Sierra 10.13.4
Matrix products: default
BLAS: /Library/Frameworks/R.framework/Versions/3.4/Resources/lib/libRblas.0.dylib
LAPACK: /Library/Frameworks/R.framework/Versions/3.4/Resources/lib/libRlapack.dylib
locale:
[1] en_US.UTF-8/en_US.UTF-8/en_US.UTF-8/C/en_US.UTF-8/en_US.UTF-8
attached base packages:
[1] stats graphics grDevices utils datasets methods base
other attached packages:
[1] ggplot2_2.2.1 reshape2_1.4.3 qvalue_2.10.0
[4] locfdr_1.1-8 ashr_2.2-7 Rmosek_8.0.69
[7] CVXR_0.95 REBayes_1.3 Matrix_1.2-14
[10] SQUAREM_2017.10-1 EQL_1.0-0 ttutils_1.0-1
[13] PolynomF_1.0-2
loaded via a namespace (and not attached):
[1] gmp_0.5-13.1 Rcpp_0.12.16 pillar_1.2.2
[4] plyr_1.8.4 compiler_3.4.3 git2r_0.21.0
[7] workflowr_1.0.1 R.methodsS3_1.7.1 R.utils_2.6.0
[10] iterators_1.0.9 tools_3.4.3 digest_0.6.15
[13] bit_1.1-13 tibble_1.4.2 gtable_0.2.0
[16] evaluate_0.10.1 lattice_0.20-35 rlang_0.2.0
[19] foreach_1.4.4 parallel_3.4.3 yaml_2.1.19
[22] Rmpfr_0.7-0 ECOSolveR_0.4 stringr_1.3.1
[25] knitr_1.20 rprojroot_1.3-2 bit64_0.9-7
[28] grid_3.4.3 R6_2.2.2 rmarkdown_1.9
[31] magrittr_1.5 whisker_0.3-2 scales_0.5.0
[34] splines_3.4.3 MASS_7.3-50 backports_1.1.2
[37] codetools_0.2-15 htmltools_0.3.6 scs_1.1-1
[40] colorspace_1.3-2 labeling_0.3 stringi_1.2.2
[43] lazyeval_0.2.1 munsell_0.4.3 pscl_1.5.2
[46] doParallel_1.0.11 truncnorm_1.0-8 R.oo_1.22.0 This reproducible R Markdown analysis was created with workflowr 1.0.1