Variability of Knockoff’s FDR Control
Lei Sun
2018-04-03
Last updated: 2018-04-05
Code version: 1187399
Introduction
We hypothesize that Knockoff might have a potential problem: the variability of the actual FDP could be large, although the mean of FDP is theoretically and empirically controlled at FDR.
The reason is that Knockoff relies on the flip sign property of the test statistics \(W_j\) for all null variables. Actually the events \(\{W_j \geq t_j\}\) or \(\{W_j \leq -t_j\}\) are independent for all null variables. However, they are not identically distributed.
Therefore, if every null variable is “unique,” in the sense that its test statistic has a distinct distribution, for example, if it tends to be larger or in a different region than anyone else, then this test statistic could randomly be positive or negative, and affect the estimate of FDP for different random samples.
In common high-dimensional settings it’s usually not a big problem since in those simulations no null variables are unique, meaning that we would expect to see \(W_i\) and \(W_j\) showing up in regions symmetric at zero.
A simple illustration
\(X\) is \(30 \times 4\), \(X_1\) and \(X_3\) are “true” variables, and \(X_2\) and \(X_4\) are nulls. \(X_2\) is highly correlated with \(X_1\), \(\rho = 0.99\), whereas \(X_4\) is almost uncorrelated with \(X_3\), \(\rho = 0.01\).
Below is a plot of \(W_2\) vs \(W_4\). As we can see, \(|W_2|\) is usually much greater than \(|W_4|\), and in many samples, only \(W_2\) will show up in the rejection region \(W \geq t\) or its symmetric null estimation region \(W \le -t\), which brings variability of \(\hat{FDP}\) as the null statistic \(W_2\) shows up in one region or the other.

Example
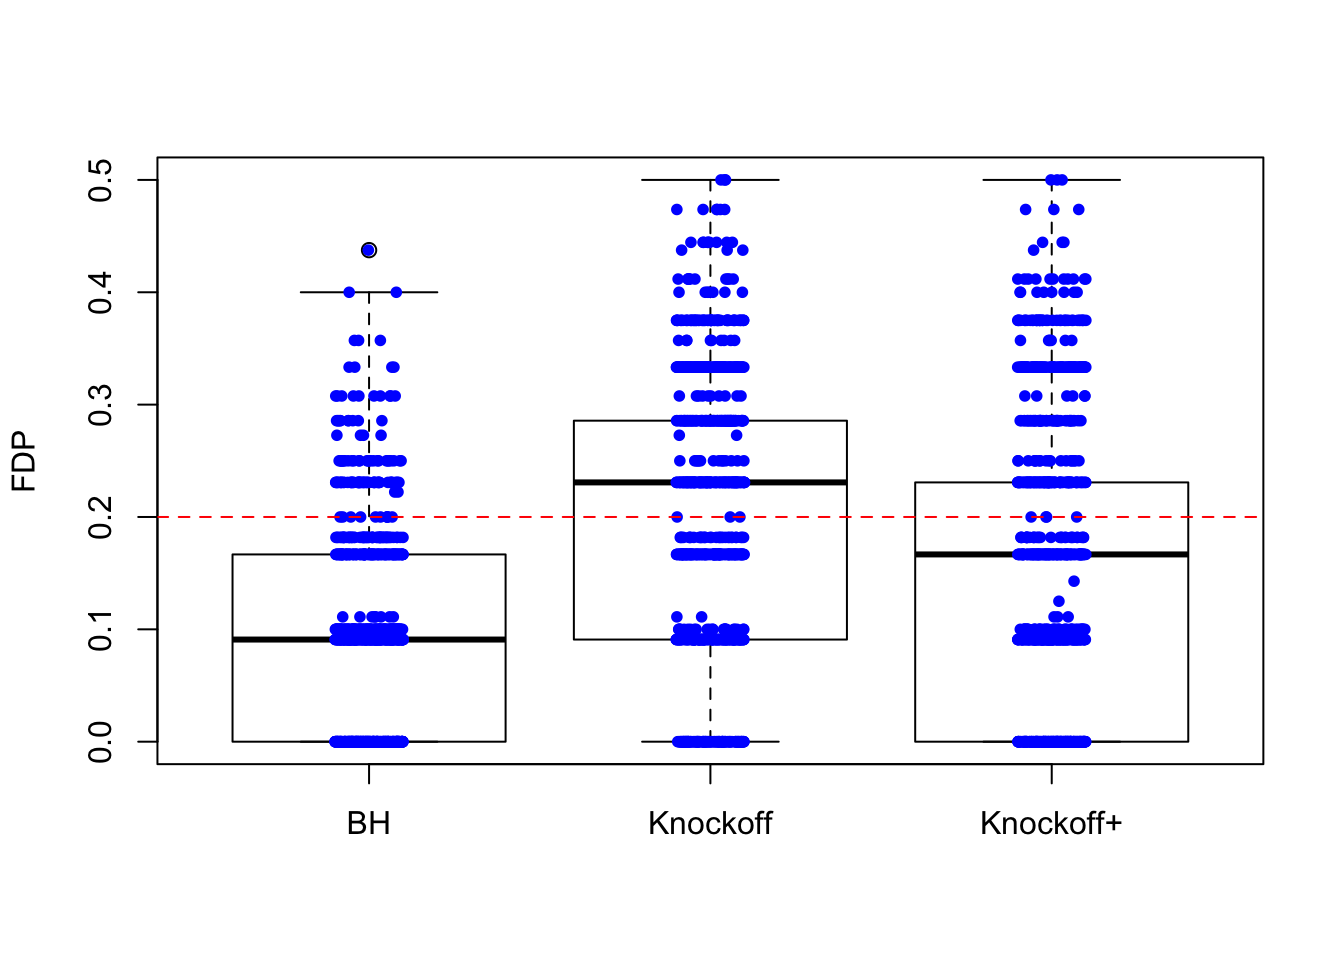
\(X\) is \(n \times 20\). There are \(10\) “true” variables: \(X_1, X_3, X_5, \ldots, X_{17}, X_{19}\) and \(10\) null variables: \(X_2, X_4, X_6, \ldots, X_{18}, X_{20}\). The correlation between the true and null variables are decreasing such that \(\rho(X_1, X_2) = 0.9, \rho(X_3, X_4) = 0.8, \rho(X_5, X_6) = 0.7, \ldots, \rho(X_{17}, X_{18}) = 0.2, \rho(X_{19}, X_{20}) = 0.1\), and all other pairwise correlations are zero.
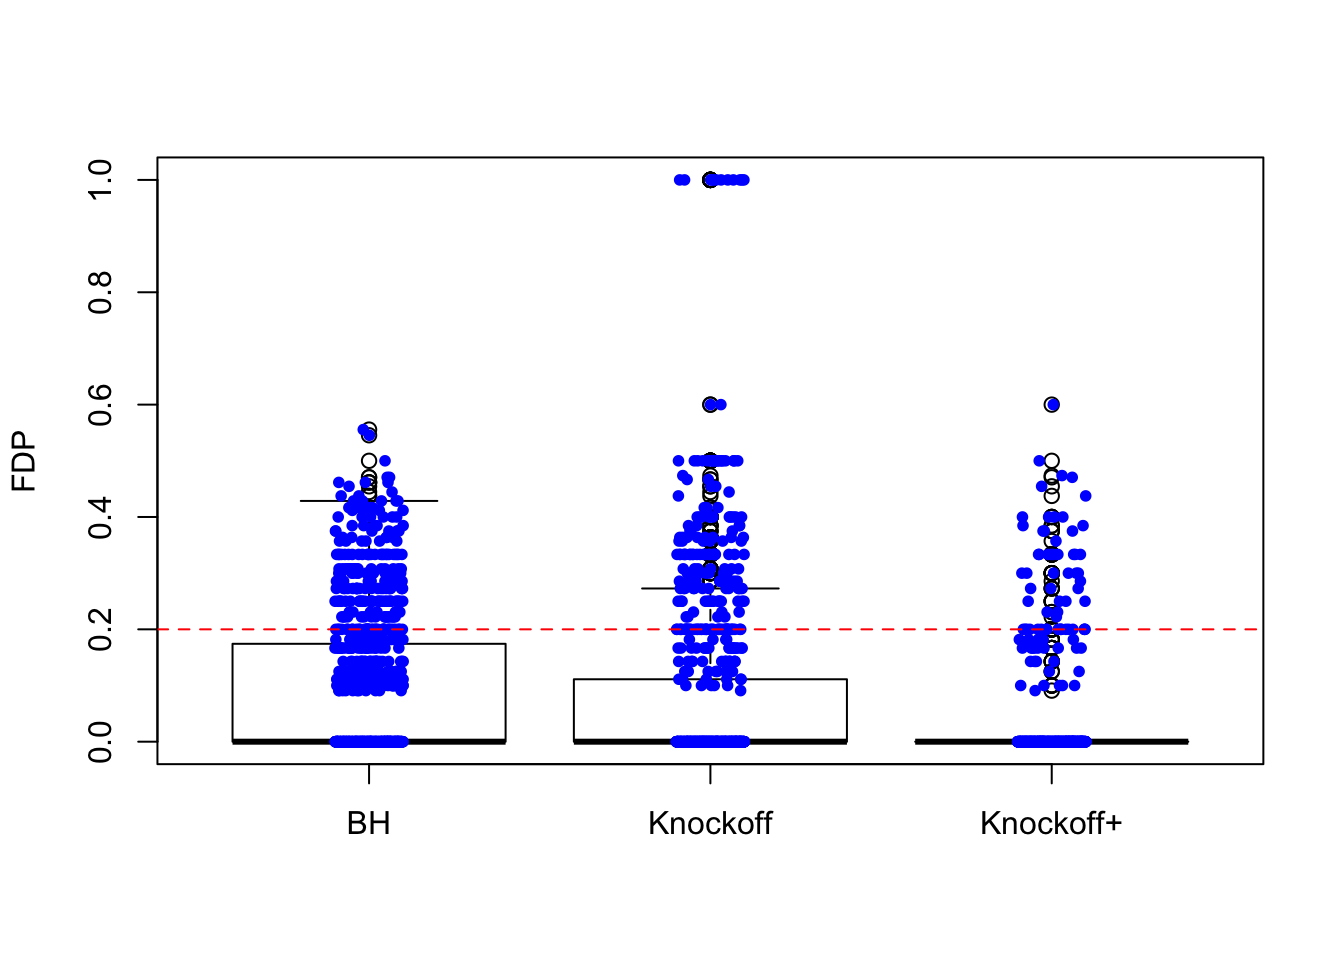
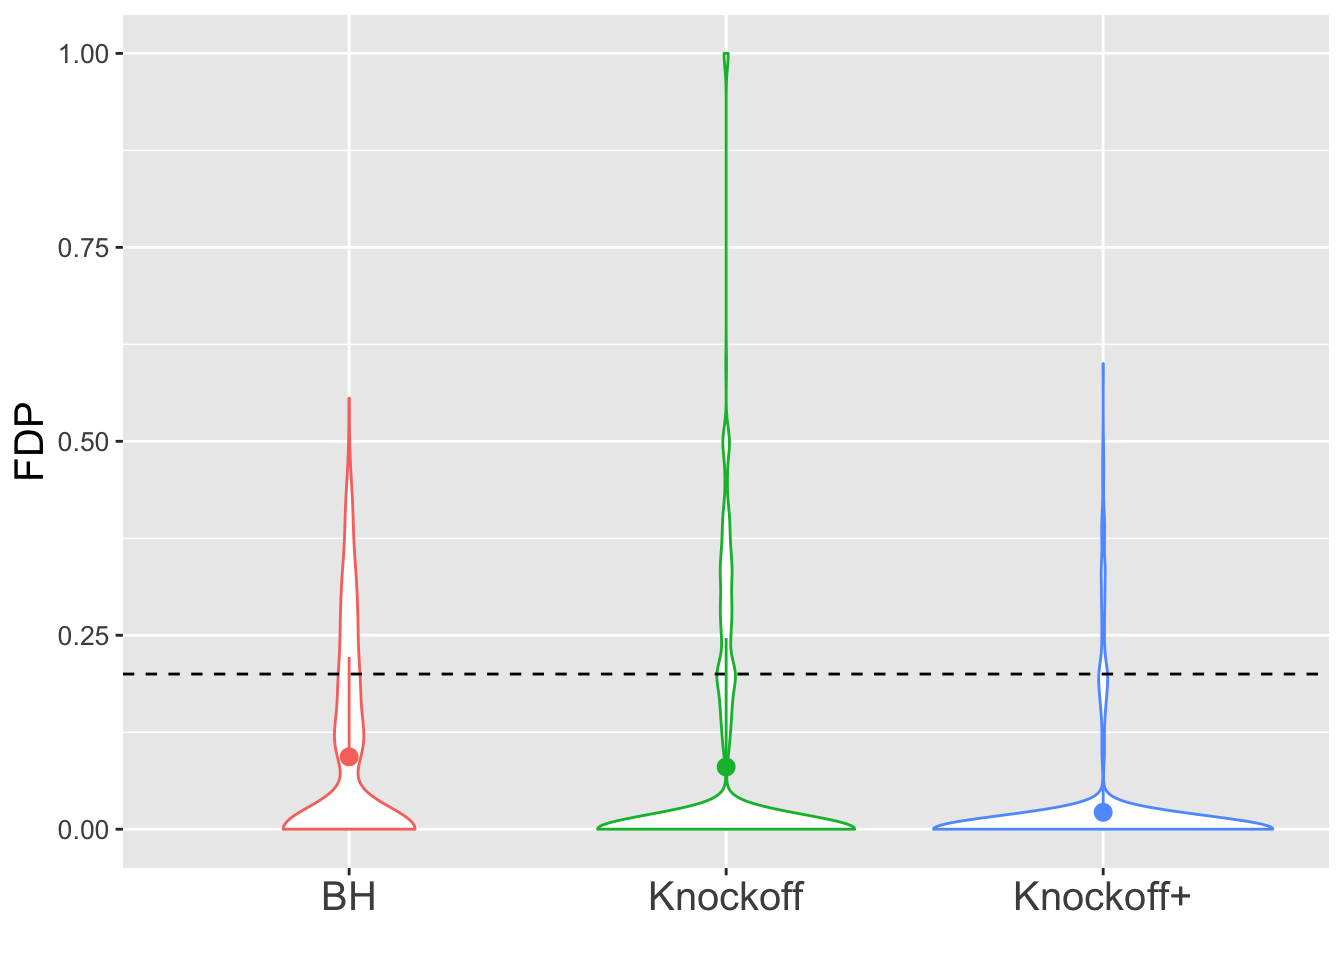
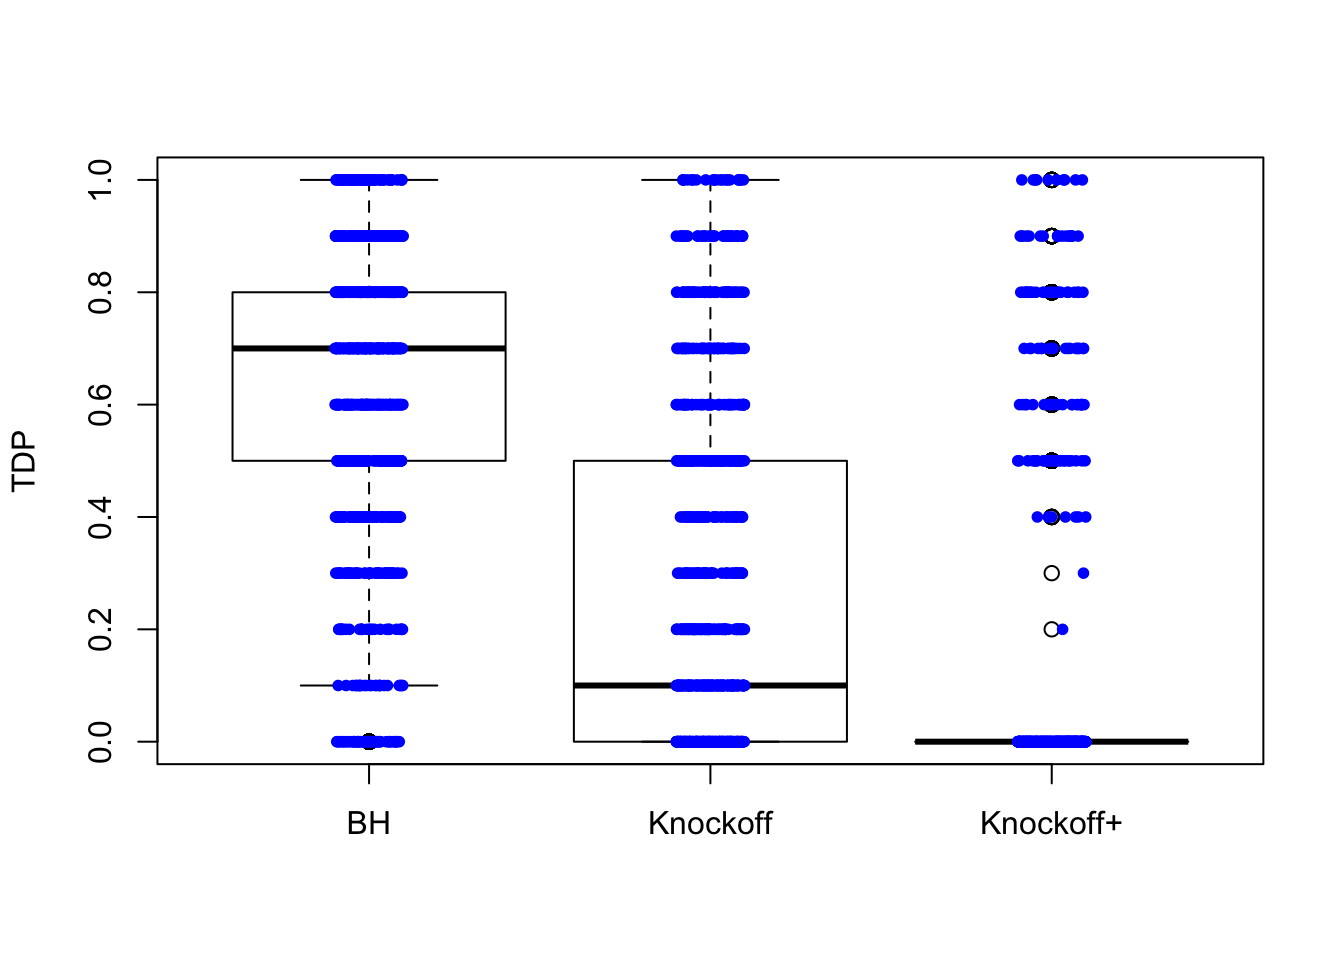
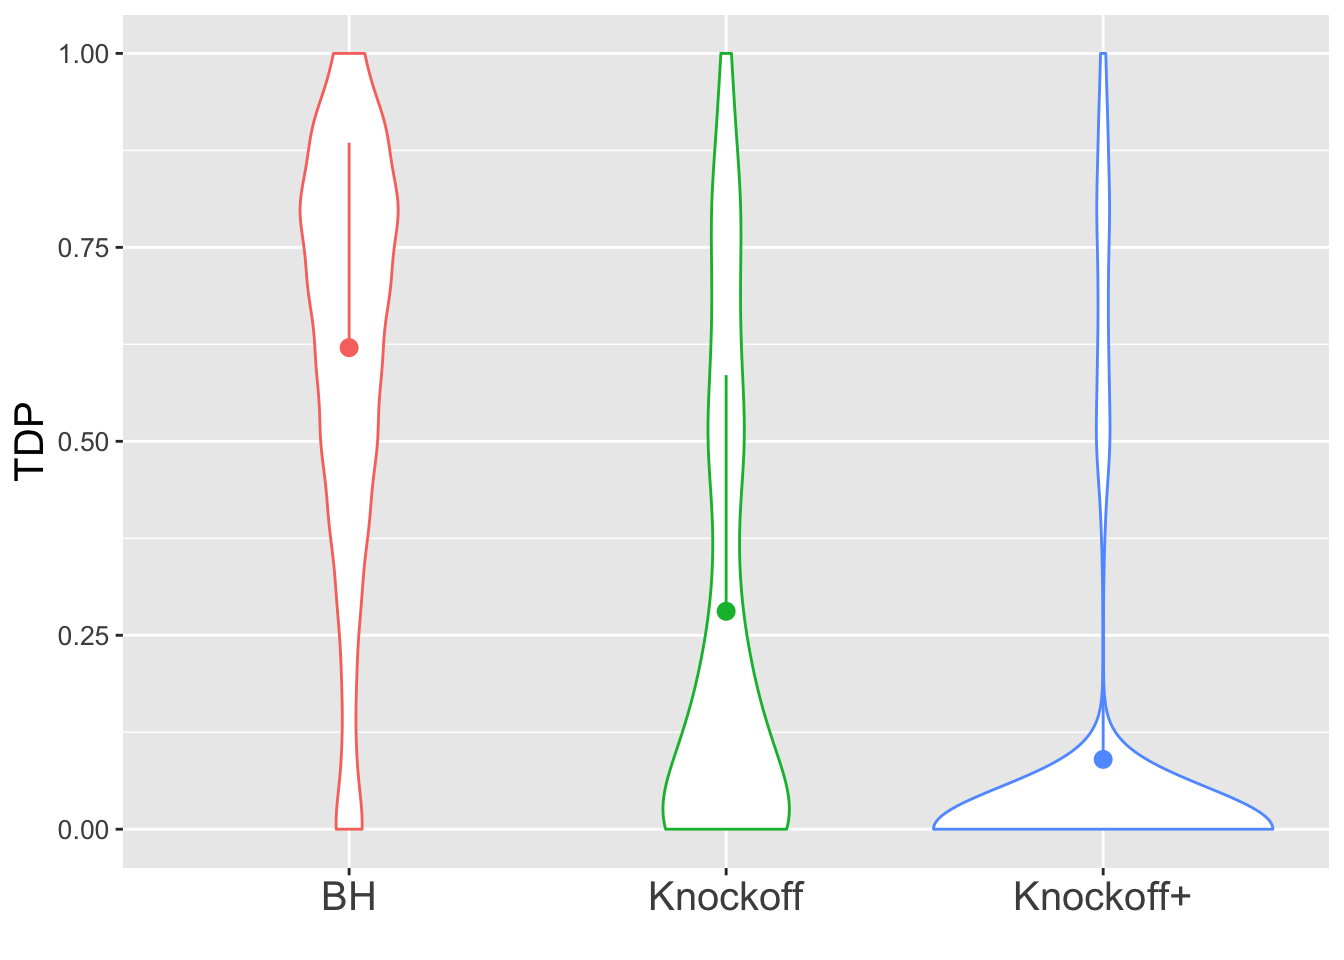
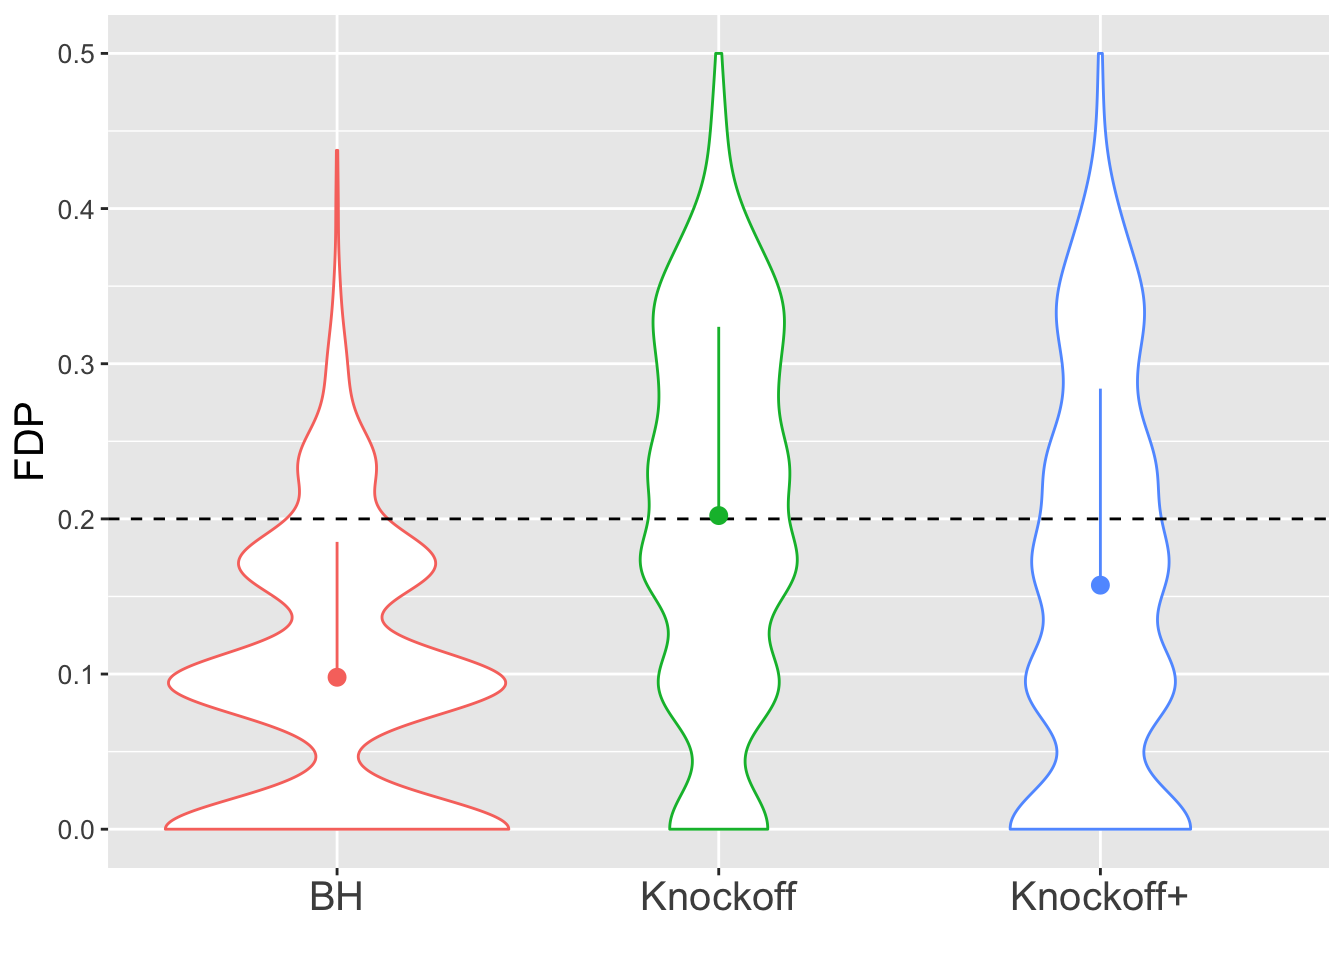
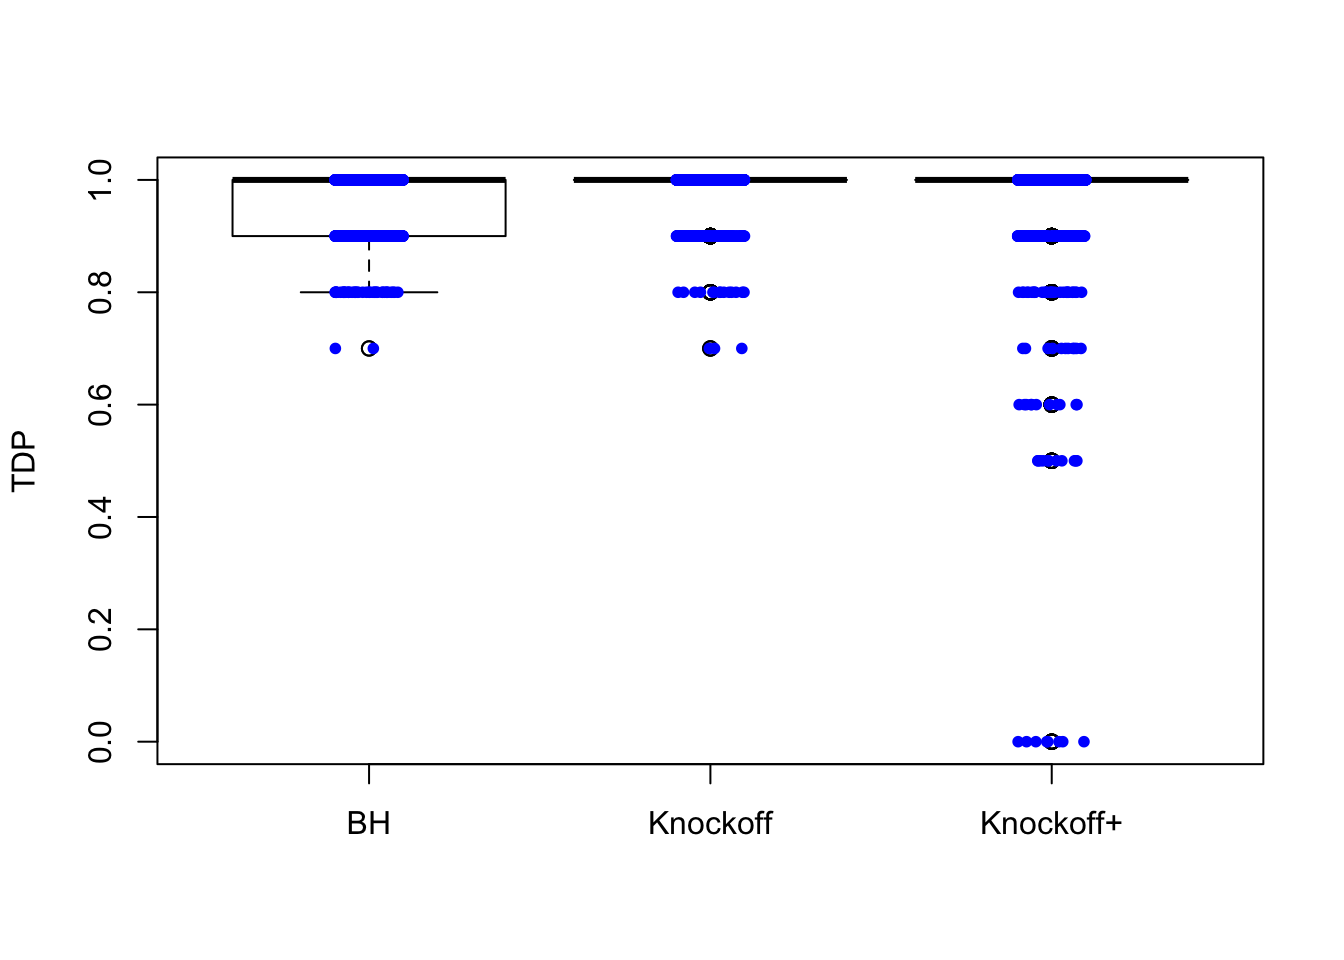
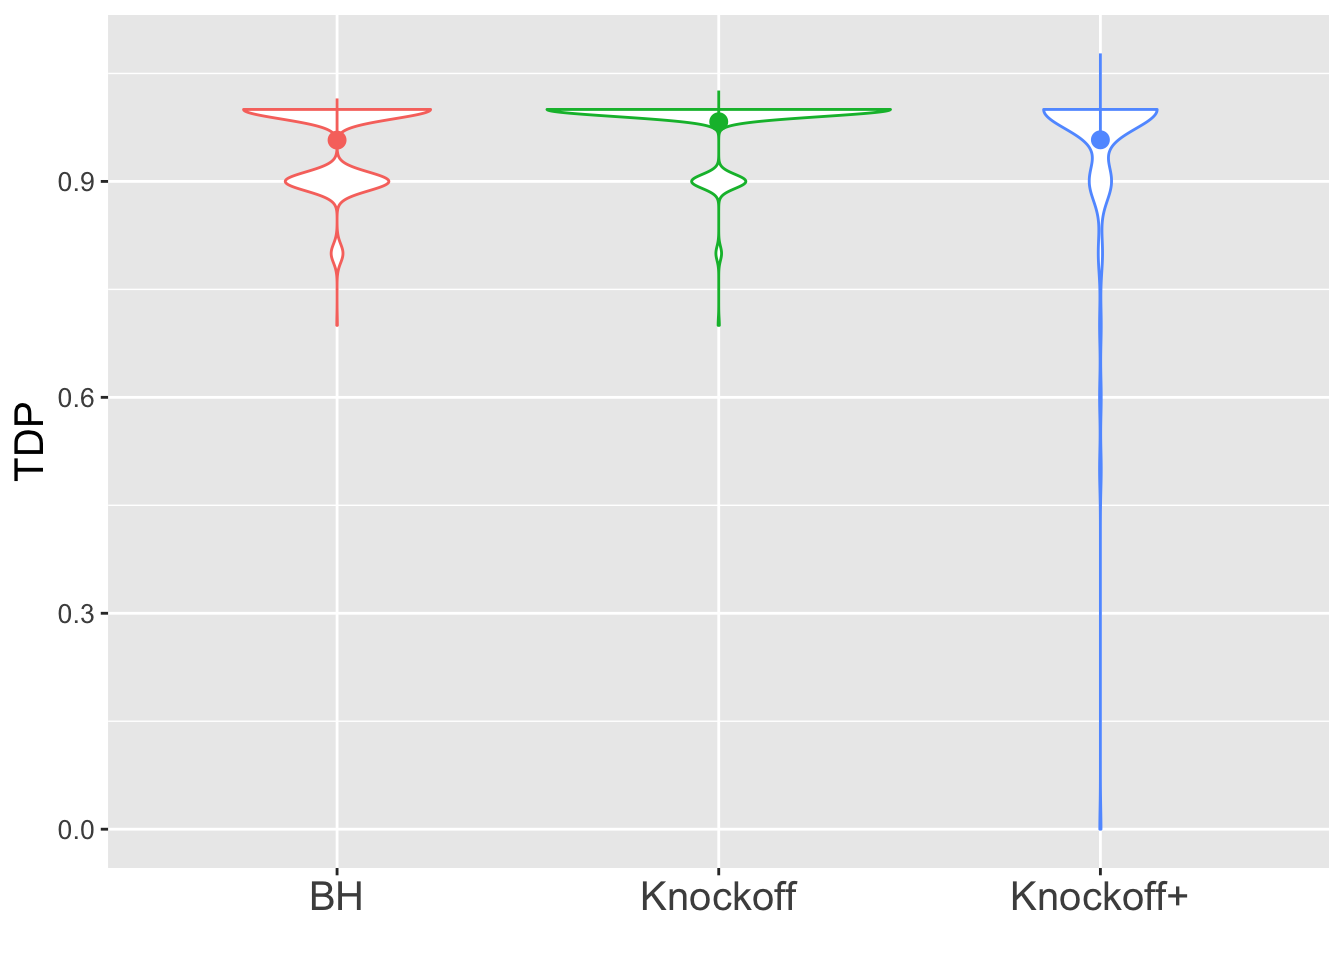
\(n = 30\)
The variability in FDP given by Knockoff is obvious.
\(n = 10K\)
The variability in FDP given by Knockoff is less than when \(n = 30\), but still bigger than that given by BH.
Session information
sessionInfo()R version 3.4.3 (2017-11-30)
Platform: x86_64-apple-darwin15.6.0 (64-bit)
Running under: macOS High Sierra 10.13.4
Matrix products: default
BLAS: /Library/Frameworks/R.framework/Versions/3.4/Resources/lib/libRblas.0.dylib
LAPACK: /Library/Frameworks/R.framework/Versions/3.4/Resources/lib/libRlapack.dylib
locale:
[1] en_US.UTF-8/en_US.UTF-8/en_US.UTF-8/C/en_US.UTF-8/en_US.UTF-8
attached base packages:
[1] stats graphics grDevices utils datasets methods base
other attached packages:
[1] forcats_0.2.0 stringr_1.3.0 dplyr_0.7.4 purrr_0.2.4
[5] readr_1.1.1 tidyr_0.7.2 tibble_1.4.1 ggplot2_2.2.1
[9] tidyverse_1.2.1 Matrix_1.2-12 knockoff_0.3.0
loaded via a namespace (and not attached):
[1] reshape2_1.4.3 haven_1.1.0 lattice_0.20-35 colorspace_1.3-2
[5] htmltools_0.3.6 yaml_2.1.18 rlang_0.1.6 pillar_1.0.1
[9] foreign_0.8-69 glue_1.2.0 modelr_0.1.1 readxl_1.0.0
[13] bindrcpp_0.2 bindr_0.1 plyr_1.8.4 munsell_0.4.3
[17] gtable_0.2.0 cellranger_1.1.0 rvest_0.3.2 psych_1.7.8
[21] evaluate_0.10.1 labeling_0.3 knitr_1.20 parallel_3.4.3
[25] broom_0.4.3 Rcpp_0.12.14 backports_1.1.2 scales_0.5.0
[29] jsonlite_1.5 mnormt_1.5-5 hms_0.4.0 digest_0.6.15
[33] stringi_1.1.6 grid_3.4.3 rprojroot_1.3-2 cli_1.0.0
[37] tools_3.4.3 magrittr_1.5 lazyeval_0.2.1 crayon_1.3.4
[41] pkgconfig_2.0.1 xml2_1.1.1 lubridate_1.7.1 rstudioapi_0.7
[45] assertthat_0.2.0 rmarkdown_1.9 httr_1.3.1 R6_2.2.2
[49] nlme_3.1-131 git2r_0.21.0 compiler_3.4.3 This R Markdown site was created with workflowr